
Cloud Visualization And 3D Rendering Software Market Size 2025-2029
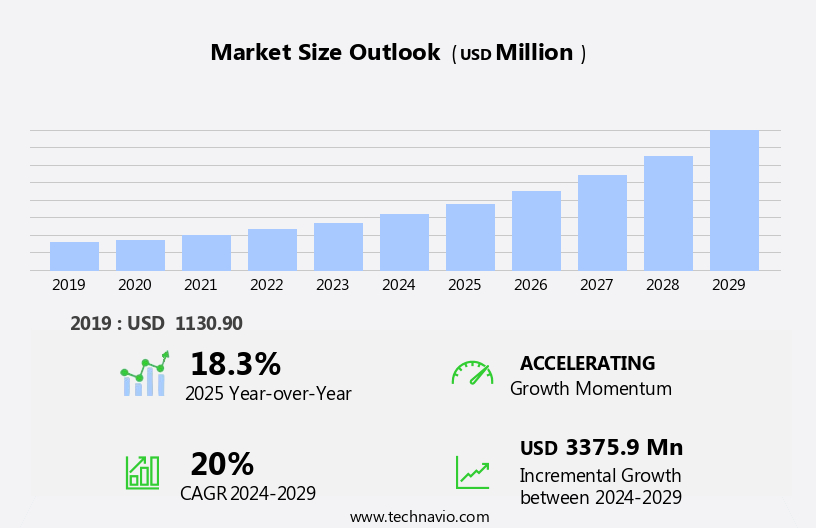
The cloud visualization and 3D rendering software market size is forecast to increase by USD 3.38 billion at a CAGR of 20% between 2024 and 2029.
- The market is experiencing significant growth, driven by the increasing demand for high-quality visual content across various industries. This trend is particularly noticeable in sectors such as architecture, engineering, and construction, where accurate and realistic 3D renderings are essential for project planning and client presentations. Furthermore, the introduction of new solutions that leverage cloud computing and artificial intelligence technologies is expanding the market's reach and capabilities. However, the market's growth is not without challenges. Data security and privacy concerns are becoming increasingly important, as companies rely on cloud-based platforms to store and process sensitive information. The market is experiencing significant growth, driven by the increasing digital transformation across industries and the integration of artificial intelligence (AI) into web applications.
- As such, providers must prioritize strong security measures and transparent data handling practices to maintain client trust and comply with regulatory requirements. Companies seeking to capitalize on this market's opportunities must stay abreast of emerging technologies and prioritize data security to differentiate themselves from competitors and meet the evolving demands of their clients. Furthermore, the rapid evolution of technologies such as Progressive Web Apps (PWAs), serverless architecture, and the Internet of Things (IoT) is creating new opportunities for innovation and expansion.
What will be the Size of the Cloud Visualization And 3D Rendering Software Market during the forecast period?
- The market in the United States is experiencing significant growth due to the increasing demand for realistic and visualizations across various industries. The market's size is substantial, driven by the adoption of cloud rendering services, which offer on-demand access to powerful rendering capabilities, enabling businesses to produce high-quality outputs more efficiently. Key growth factors include the expanding applications of rendering technology in sectors such as engineering, research, animation, e-commerce, healthcare, and marketing. Additionally, advancements in GPU rendering farms, 3D model optimization, and workflow optimization contribute to the market's momentum. Trends in the market include the integration of advanced features, such as real-time rendering and AI-assisted optimization, as well as the increasing focus on security and performance metrics to cater to the evolving needs of businesses. Marketing automation, email marketing platforms, and CRM systems enhance digital marketing efforts, while social media analytics and Google Analytics provide valuable insights for data-driven decision-making.
- The future of rendering is expected to be characterized by continued innovation, with a shift towards more accessible and user-friendly solutions that cater to diverse user needs.
How is this Cloud Visualization And 3D Rendering Software Industry segmented?
The cloud visualization and 3D rendering software industry research report provides comprehensive data (region-wise segment analysis), with forecasts and estimates in "USD million" for the period 2025-2029, as well as historical data from 2019-2023 for the following segments.
- Application
- PDM
- Animation
- Visualization and simulation
- Others
- End-user
- Construction
- Media and entertainment
- Gaming
- Manufacturing and automotive
- Others
- Geography
- North America
- US
- Canada
- Europe
- France
- Germany
- Spain
- UK
- APAC
- China
- India
- Japan
- South Korea
- South America
- Middle East and Africa
- North America
By Application Insights
The PDM segment is estimated to witness significant growth during the forecast period. The Product Lifecycle Management (PLM) segment in the market holds a substantial market share. This segment is widely adopted across industries such as manufacturing, automotive, aerospace, consumer electronics, and fashion. The primary applications within this segment include product design and prototyping, digital twin creation, mechanical simulation, and ergonomic and aesthetic visualization. These applications enable businesses to expedite their design processes, decrease time-to-market, and improve product quality. A significant advantage of cloud-based rendering in PLM is the provision of faster iteration capabilities. Advancements in cloud computing technology have led to the development of sophisticated rendering engines, such as ray tracing, high-fidelity rendering, and real-time rendering. The market is experiencing significant growth due to the digital transformation sweeping various industries.
Small businesses and enterprises alike can leverage cloud rendering services for their rendering needs, with remote rendering and distributed rendering options available for added flexibility. The market offers numerous benefits to businesses, including faster rendering speeds, advanced rendering pipelines, and high-quality rendering engines. These advantages enable companies to create more accurate digital models, streamline their design processes, and ultimately produce better products.
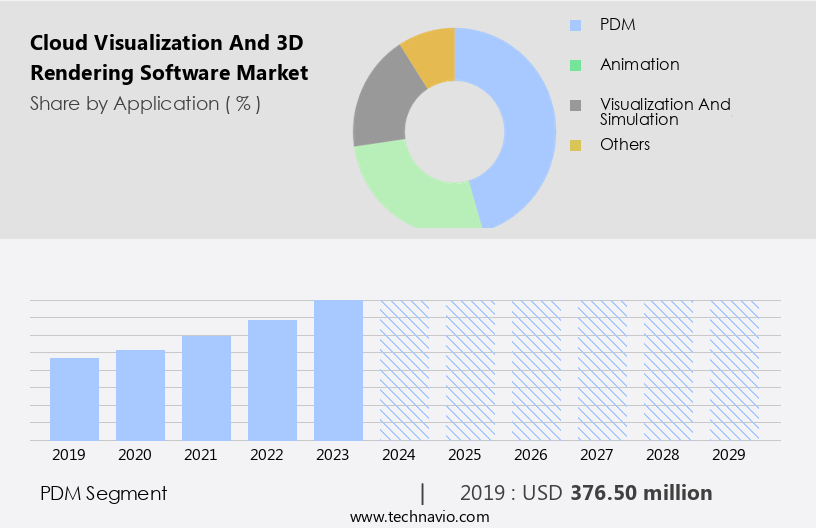
Get a glance at the market report of share of various segments Request Free Sample
The PDM segment was valued at USD 376.50 billion in 2019 and showed a gradual increase during the forecast period.
Regional Analysis
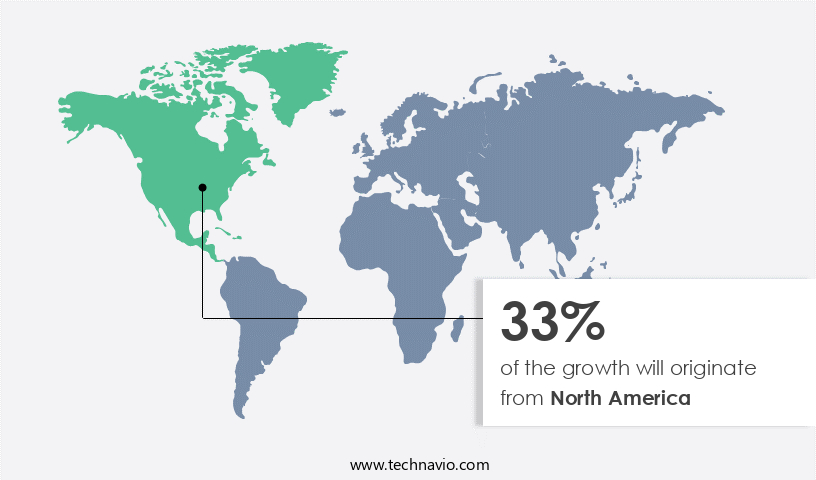
North America is estimated to contribute 33% to the growth of the global market during the forecast period. Technavio's analysts have elaborately explained the regional trends and drivers that shape the market during the forecast period.
For more insights on the market size of various regions, Request Free Sample
The North American market for cloud visualization and 3D rendering software is experiencing significant growth due to substantial investments and advancements in various sectors. The Bipartisan Infrastructure Law (BIL) in the US and the Canadian infrastructure plan have allocated over USD 2.5 trillion for infrastructure projects over the next decade. These projects necessitate advanced visualization and rendering tools for planning, design, and simulation. Cloud-based solutions offer the scalability and flexibility required to handle the complex and extensive data involved, enabling efficient collaboration among stakeholders and reducing the need for costly local infrastructure. Key features of cloud-based rendering software include high rendering speed, ray tracing, 3D modeling, user interface, texture mapping, and high-fidelity rendering. Furthermore, businesses are investing in Data Analytics, Business Intelligence (BI), Email Marketing, and Content Marketing for data-driven decision making and customer acquisition.
Virtual reality, augmented reality, and mixed reality integration offer experiences, while VR/AR integration and digital twins enable accurate simulations and prototyping. Enterprise solutions cater to the unique needs of small businesses and large organizations, providing scalable and customizable solutions. The market in North America is poised for substantial growth due to the significant investments and advancements in infrastructure projects. Cloud-based solutions offer the scalability, flexibility, and advanced features required to handle the complex and extensive data involved, enabling efficient collaboration and reducing the need for costly local infrastructure.
Market Dynamics
Our researchers analyzed the data with 2024 as the base year, along with the key drivers, trends, and challenges. A holistic analysis of drivers will help companies refine their marketing strategies to gain a competitive advantage.
What are the key market drivers leading to the rise in the adoption of Cloud Visualization And 3D Rendering Software Industry?
- Rising demand for high-quality visual content is the key driver of the market. The market is experiencing significant growth due to the increasing demand for high-quality visual content across various industries. In sectors such as architecture, engineering, construction, media and entertainment, advertising, gaming, and product design, there is a growing need to create realistic, and visually engaging content. This trend is driven by the evolving expectations of end-users and clients who demand photorealistic images, animations, and interactive experiences. In industries like architecture and real estate, high-quality 3D visualizations and walkthroughs are essential for communicating design intent, securing client approvals, and marketing properties before they are built. The use of cloud-based solutions enables faster rendering times, greater collaboration, and easier access to visual content from anywhere. The market is expected to continue growing as businesses seek to enhance their digital presence and provide more engaging experiences to their customers.
- Advanced lighting effects and photorealistic rendering enable experiences, while interactive visualization, distributed rendering, and workflow automation enhance productivity. Additionally, cloud computing enables AI-powered rendering, machine learning, and real-time rendering. Industry verticals such as engineering visualization, architectural visualization, game development, and medical visualization benefit from these features. Collaboration tools, render farm management, API integrations, and cloud-based rendering further streamline the rendering process. Performance optimization and CAD integration ensure rendering quality, while rendering pipelines and rendering engines offer flexibility and customization. Data security is a critical concern, and these solutions provide strong security measures to protect sensitive project data.
What are the market trends shaping the Cloud Visualization And 3D Rendering Software Industry?
- Introduction of new solutions is the upcoming market trend. The market is experiencing notable progress with the introduction of innovative solutions. Leading software companies continue to advance the technology, enabling enhanced performance, streamlined workflows, and improved user experiences. On August 22, 2023, HYBRID Software unveiled iC3D Suite Version 9, marking a significant leap forward in 3D rendering software. This new version offers enhanced automation, improved performance, and seamless workflow integration. A major upgrade to its PDF Editor utilizes proprietary PDF Libraries, delivering faster rendering speeds, greater stability, and advanced functionality. Integration with CLOUDFLOW Plugin Suite of HYBRID creates a unified digital workflow, supporting various file formats and boosting productivity. These advancements are driving innovation across industries and contributing to the growth of the market.
- User interface and workflow automation are essential aspects of these software offerings, enabling users to easily manage their projects and collaborate with team members. Texture mapping, material libraries, and API integrations further enhance the visual fidelity and customization options for users. Industry verticals such as game development, engineering visualization, architectural visualization, and product design have unique requirements for rendering software. Consequently, solutions cater to these needs by offering specialized features and integrations, such as BIM, CAD, VR/AR, and project management tools. High-fidelity rendering and interactive visualization are increasingly important for creating experiences in various applications, including virtual and augmented reality, medical visualization, and digital twins.
What challenges does the Cloud Visualization And 3D Rendering Software Industry face during its growth?
- Data security and privacy concerns is a key challenge affecting the industry growth. The market faces a critical challenge in ensuring data security and privacy. With the increasing adoption of cloud-based platforms for rendering complex 3D models, organizations transfer and store sensitive design data on third-party servers. This data includes proprietary blueprints, intellectual property, and confidential client information, making it a prime target for cyberattacks, unauthorized access, data leakage, and non-compliance with data protection regulations such as the GDPR and CCPA. The complex regulatory environments of cloud rendering services, which often operate across multiple geographies, further complicate matters. Companies must ensure their data is handled in accordance with local and international laws to avoid financial and reputational damage. This requirement adds an essential layer of complexity to the market.
- These engines deliver photorealistic visuals, lighting effects, and texture mapping, enhancing the overall quality of 3D renderings. Additionally, collaboration tools, API integrations, and render farm management systems facilitate seamless teamwork and workflow automation. Industry verticals, including engineering visualization, architectural visualization, game development, and medical visualization, also benefit from cloud-based rendering solutions. These applications enable users to create experiences through virtual reality (VR), augmented reality (AR), and mixed reality (MR) integration. Furthermore, AI-powered rendering and machine learning algorithms contribute to performance optimization and project management efficiency. Cloud-based rendering offers data security, making it an attractive solution for businesses seeking to protect their intellectual property. Web hosting, cloud computing, API integration, and growth hacking are other critical components.
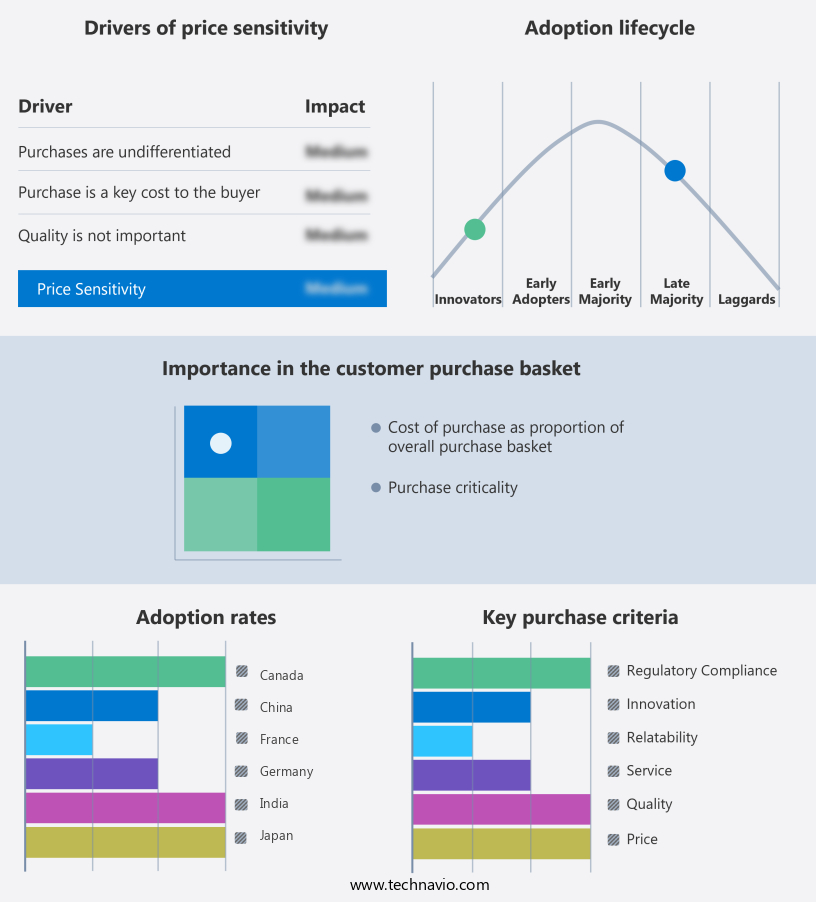
Exclusive Customer Landscape
The cloud visualization and 3D rendering software market forecasting report includes the adoption lifecycle of the market, covering from the innovator's stage to the laggard's stage. It focuses on adoption rates in different regions based on penetration. Furthermore, the cloud visualization and 3D rendering software market report also includes key purchase criteria and drivers of price sensitivity to help companies evaluate and develop their market growth analysis strategies.
Customer Landscape
Key Companies & Market Insights
Companies are implementing various strategies, such as strategic alliances, cloud visualization and 3D rendering software market forecast, partnerships, mergers and acquisitions, geographical expansion, and product/service launches, to enhance their presence in the industry.
Adobe Inc. - The company offers cloud visualization and 3D rendering software which is used for various industries, including architecture, product design, and entertainment.
The industry research and growth report includes detailed analyses of the competitive landscape of the market and information about key companies, including:
- Adobe Inc.
- Altair Engineering Inc.
- Autodesk Inc.
- Bentley Systems Inc.
- Chaos Software EOOD
- Corel Corp.
- Dassault Systemes SE
- Epic Games Inc.
- Lumion
- Luxion Inc.
- Maxon Computer GmbH
- NEXT LIMIT SL
- NVIDIA Corp.
- SAP SE
- Side Effects Software Inc.
- The Foundry Visionmongers Ltd.
- Trimble Inc.
- Unity Technologies Inc.
Qualitative and quantitative analysis of companies has been conducted to help clients understand the wider business environment as well as the strengths and weaknesses of key industry players. Data is qualitatively analyzed to categorize companies as pure play, category-focused, industry-focused, and diversified; it is quantitatively analyzed to categorize companies as dominant, leading, strong, tentative, and weak.
Research Analyst Overview
The market continues to evolve, driven by advancements in technology and increasing demand for high-quality, interactive visualizations across various industry verticals. This market encompasses a range of solutions designed to streamline the rendering process, enhance user experience, and improve collaboration and productivity. At the core of these solutions are rendering engines, which utilize advanced algorithms to generate photorealistic images and animations from 3D models. Ray tracing, a technique used to simulate the behavior of light in a scene, has gained significant attention due to its ability to produce lifelike visuals. Rendering speed is a crucial factor in this market, with solutions employing distributed rendering, GPU rendering, and cloud-based rendering to accelerate the process.
These solutions enable users to explore complex data sets and models in a more engaging and intuitive way. Enterprise solutions cater to larger organizations, offering advanced features, scalability, and security. Data security is a significant concern for these clients, with solutions providing strong encryption and access control mechanisms. Performance optimization and collaboration tools are essential components of rendering software, enabling users to manage large projects and distribute rendering tasks across multiple machines or a cloud-based render farm. Machine learning and deep learning technologies are being integrated into these solutions to improve rendering quality and efficiency. Remote rendering and real-time rendering are gaining traction, allowing users to render images and animations from anywhere and in near real-time.
StartFragment The Cloud Visualization And 3D Rendering Software Market is revolutionizing industries with on-demand rendering offering flexibility and scalability. Businesses analyze rendering software pricing to balance cost and efficiency. Key rendering software features include enhanced user interfaces and powerful rendering for animation. Comprehensive rendering software comparisons assist in decision-making. Rendering workflow optimization boosts productivity. Effective rendering software integration with existing tools is essential. Rendering performance metrics ensure efficiency and high-quality output. Rendering software security safeguards sensitive data. Improved rendering software accessibility allows global usage. D visualization trends drive innovation in rendering for marketing, rendering for ecommerce, rendering for training, rendering for education, rendering for research, and rendering for healthcare. This dynamic sector continues to evolve, impacting diverse applications globally.EndFragment
These solutions enable small businesses and individuals to access high-performance rendering capabilities without the need for expensive hardware. In summary, the market is driven by the need for high-quality, interactive visualizations across various industry verticals. Solutions offer advanced rendering engines, user-friendly interfaces, and specialized features to cater to specific needs. The market is continually evolving, with a focus on performance optimization, collaboration, and experiences.
|
Market Scope |
|
|
Report Coverage |
Details |
|
Page number |
225 |
|
Base year |
2024 |
|
Historic period |
2019-2023 |
|
Forecast period |
2025-2029 |
|
Growth momentum & CAGR |
Accelerate at a CAGR of 20% |
|
Market growth 2025-2029 |
USD 3.38 Billion |
|
Market structure |
Fragmented |
|
YoY growth 2024-2025(%) |
18.3 |
|
Key countries |
US, China, Germany, UK, India, Canada, France, Japan, South Korea, and Spain |
|
Competitive landscape |
Leading Companies, Market Positioning of Companies, Competitive Strategies, and Industry Risks |
What are the Key Data Covered in this Cloud Visualization And 3D Rendering Software Market Research and Growth Report?
- CAGR of the Cloud Visualization And 3D Rendering Software industry during the forecast period
- Detailed information on factors that will drive the growth and forecasting between 2025 and 2029
- Precise estimation of the size of the market and its contribution of the industry in focus to the parent market
- Accurate predictions about upcoming growth and trends and changes in consumer behaviour
- Growth of the market across North America, Europe, APAC, South America, and Middle East and Africa
- Thorough analysis of the market's competitive landscape and detailed information about companies
- Comprehensive analysis of factors that will challenge the cloud visualization and 3D rendering software market growth and forecasting
We can help! Our analysts can customize this cloud visualization and 3D rendering software market research report to meet your requirements.
 RIA -
RIA - 
