
CMO In Pharmaceutical Industry Market Size 2025-2029
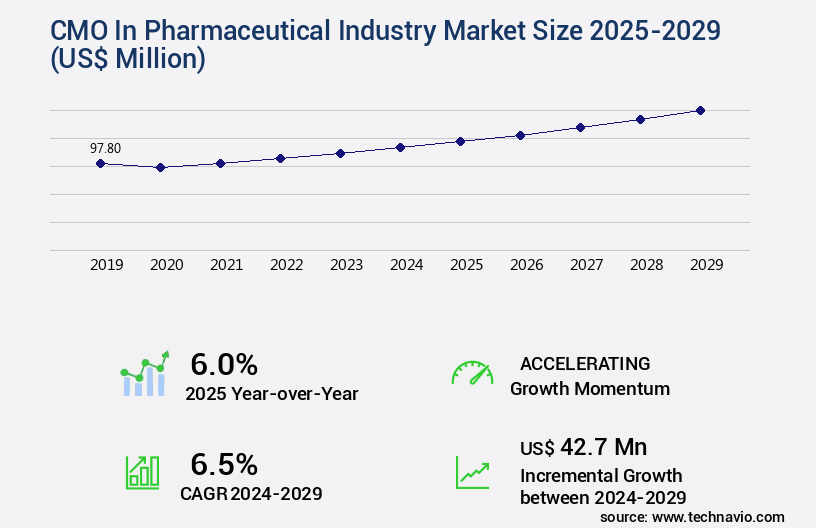
The CMO in pharmaceutical industry market size is valued to increase USD 42.7 million, at a CAGR of 6.5% from 2024 to 2029. Availability of cost-efficient resources in emerging markets will drive the CMO in pharmaceutical industry market.
Major Market Trends & Insights
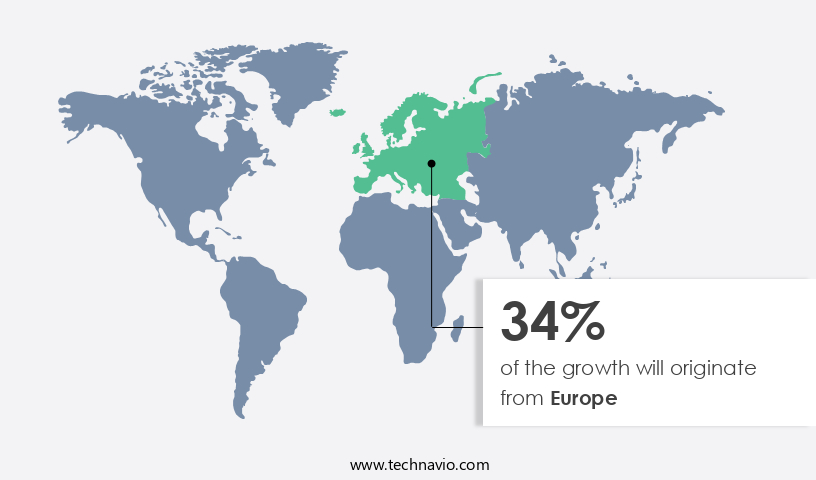
- Europe dominated the market and accounted for a 34% growth during the forecast period.
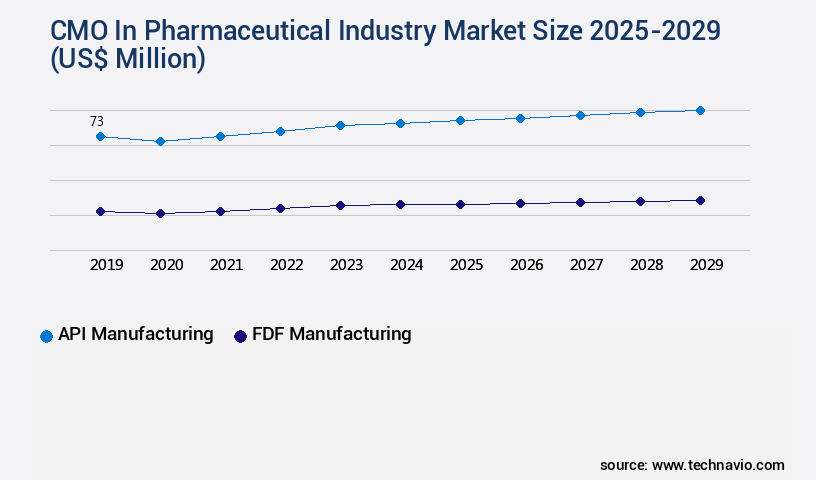
- By Service - API manufacturing segment was valued at USD 73.00 million in 2023
- By Drug Class - Small molecule segment accounted for the largest market revenue share in 2023
Market Size & Forecast
- Market Opportunities: 60.94 million
- Market Future Opportunities: USD 42.70 million
- CAGR : 6.5%
- Europe: Largest market in 2023
Market Summary
- The market represents a dynamic and evolving landscape, driven by advancements in core technologies and applications. With a growing emphasis on outsourcing production processes, contract manufacturing organizations (CMOs) have become essential partners for pharmaceutical companies worldwide. According to recent reports, the global CMO market share for pharmaceutical manufacturing is projected to reach over 35% by 2026, underscoring the industry's reliance on these service providers. Service types, such as API manufacturing, finished dosage form manufacturing, and packaging services, are the primary offerings of CMOs. The application of these services spans various therapeutic areas, including oncology, cardiovascular diseases, and neurology.
- However, the pharmaceutical CMO market is subject to stringent regulations, particularly from regulatory bodies like the US FDA and EMA. Despite these challenges, the market presents significant opportunities for growth, particularly in emerging markets where cost-efficient resources and US FDA-approved manufacturing facilities are available. The ongoing digital transformation in the pharmaceutical industry, including the adoption of advanced technologies like artificial intelligence and machine learning, is also expected to create new opportunities for CMOs. In related markets such as biologics manufacturing and medical devices, the evolving trends and patterns provide valuable insights for understanding the future trajectory of the market.
What will be the Size of the CMO In Pharmaceutical Industry Market during the forecast period?
Get Key Insights on Market Forecast (PDF) Request Free Sample
How is the CMO In Pharmaceutical Industry Market Segmented and what are the key trends of market segmentation?
The CMO in pharmaceutical industry industry research report provides comprehensive data (region-wise segment analysis), with forecasts and estimates in "USD million" for the period 2025-2029, as well as historical data from 2019-2023 for the following segments.
- Service
- API manufacturing
- FDF manufacturing
- Drug Class
- Small molecule
- Drugs biologics
- High potency drugs
- End-user
- Big pharma
- Small and medium enterprises (SMEs)
- Generic drug manufacturers
- Biotech companies
- Geography
- North America
- US
- Canada
- Europe
- France
- Germany
- Italy
- Spain
- UK
- APAC
- China
- India
- Japan
- Rest of World (ROW)
- North America
By Service Insights
The api manufacturing segment is estimated to witness significant growth during the forecast period.
In the dynamic pharmaceutical industry, the Contract Manufacturing Organizations (CMOs) sector is experiencing significant growth, particularly in the API manufacturing segment. According to recent industry reports, this segment is projected to expand by 15.3% in 2024, reflecting the increasing importance of collaboration between multinational drug developers and API manufacturers. This trend is not limited to cost savings; instead, it focuses on innovation, speed, and regulatory compliance. Indian and Chinese API manufacturers are increasingly becoming strategic partners, offering advanced synthesis capabilities, regulatory support, and confidentiality in development. This shift is driven by the growing complexity of drug formulations and the rising demand for differentiated generics and specialty therapies.
The quality assurance systems, technology transfer pharmaceutical, and pharmaceutical technology sectors are also witnessing substantial growth, with quality by design, compliance monitoring, and risk management playing crucial roles. Moreover, continuous manufacturing, process optimization, and process analytical technology are essential components of the drug substance manufacturing process, ensuring GMP compliance and inventory management. The drug product development process involves regulatory affairs, production scheduling, supply chain management, product lifecycle management, and cost reduction strategies. The regulatory submissions process is a critical aspect of the pharmaceutical development phase, with analytical testing, manufacturing capacity, and drug manufacturing processes undergoing rigorous evaluation.
Facility qualification, packaging processes, and scale-up processes are also subject to stringent regulations. Clinical trial management, equipment validation, and formulation development are integral parts of the drug development process, ensuring the delivery of safe and effective drugs to patients. In summary, the pharmaceutical CMO market is undergoing continuous evolution, with a focus on innovation, regulatory compliance, and strategic partnerships. The API manufacturing segment is expected to grow by 15.3% in 2024, while the overall industry is projected to expand by 12.1% during the same period. These figures underscore the market's potential and the opportunities it presents for stakeholders.
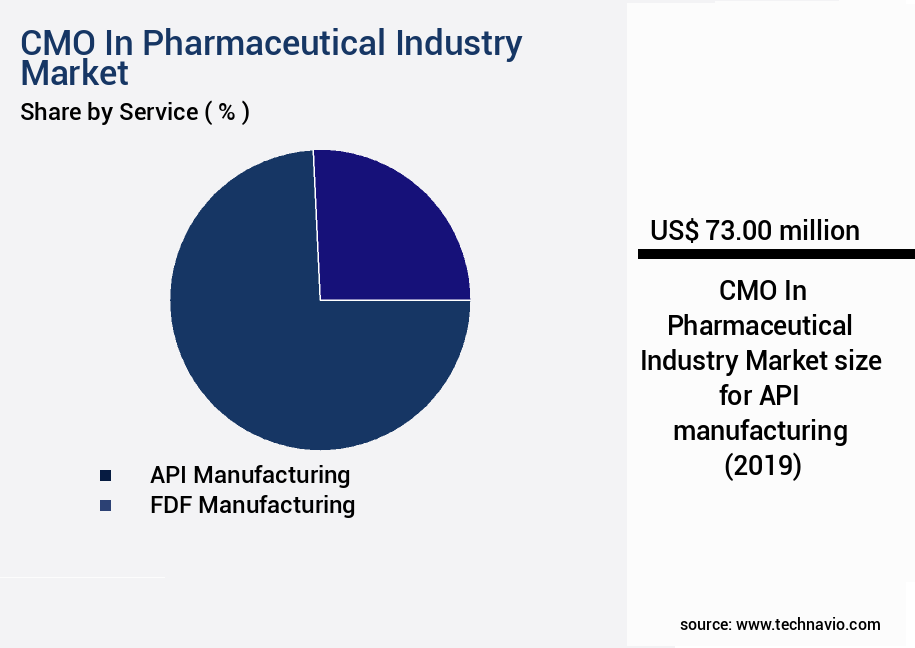
The API manufacturing segment was valued at USD 73.00 million in 2019 and showed a gradual increase during the forecast period.
Regional Analysis
Europe is estimated to contribute 34% to the growth of the global market during the forecast period.Technavio's analysts have elaborately explained the regional trends and drivers that shape the market during the forecast period.
See How CMO In Pharmaceutical Industry Market Demand is Rising in Europe Request Free Sample
In 2024, Europe's pharmaceutical industry continues to lead the global Contract Manufacturing Organizations (CMO) market, fueled by rising demand for advanced therapeutics and biologics. Europe's robust infrastructure and extensive network of CMOs foster a dynamic ecosystem, enabling pharmaceutical companies to expedite drug development and enhance production. Chronic conditions like cancer, autoimmune disorders, and metabolic diseases remain major catalysts for innovation, pushing pharmaceutical firms to collaborate with CMOs specializing in complex formulations and biologics. Germany, the UK, France, Italy, and Spain spearhead this growth, each contributing through robust regulatory frameworks, skilled labor, and established pharmaceutical clusters. According to recent reports, Europe accounts for approximately 40% of the global CMO market share in the pharmaceutical sector.
Furthermore, the European CMO market is projected to expand at a steady pace, reaching a value of around USD50 billion by 2027. This growth is driven by the increasing prevalence of chronic diseases and the growing trend towards outsourcing manufacturing processes to CMOs to reduce costs and improve efficiency.
Market Dynamics
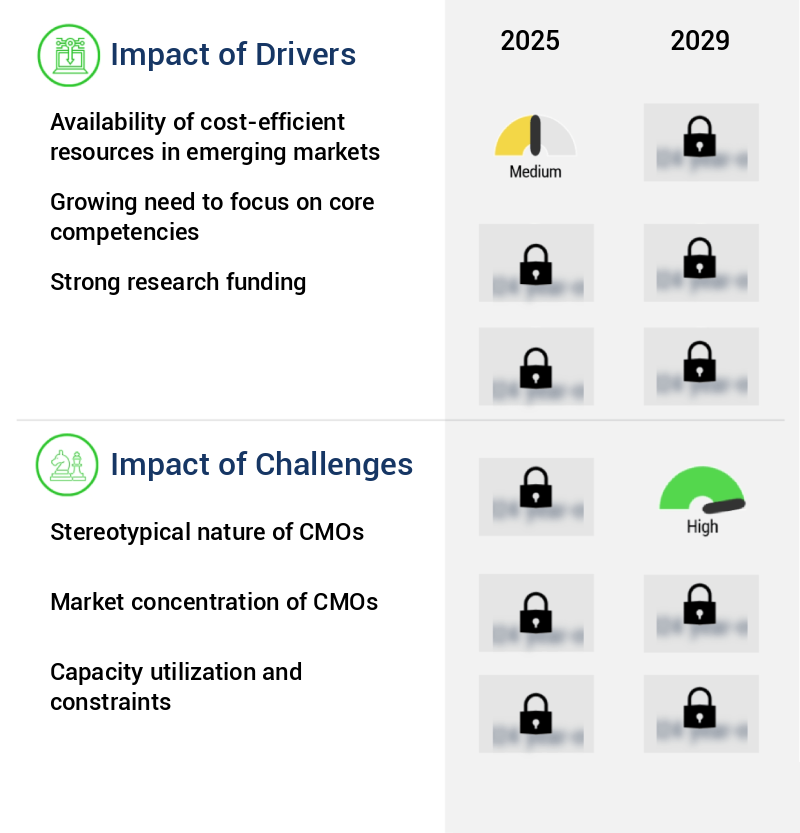
Our researchers analyzed the data with 2024 as the base year, along with the key drivers, trends, and challenges. A holistic analysis of drivers will help companies refine their marketing strategies to gain a competitive advantage.
In the dynamic and complex pharmaceutical industry, the role of a Global CMO (Contract Manufacturing Organization) has become increasingly significant in navigating the intricacies of pharmaceutical drug development. CMOs play a crucial part in the manufacturing process, from API (Active Pharmaceutical Ingredient) synthesis and purification to pharmaceutical formulation development, ensuring CGMP (Current Good Manufacturing Practice) compliance at every stage. Outsourcing pharmaceutical manufacturing to CMOs allows companies to focus on their core competencies while maintaining regulatory compliance through strategic partnerships. Quality control in pharmaceuticals is a top priority, and CMOs employ process validation strategies to ensure drug product stability during manufacturing and throughout the clinical trial supply chain.
Advanced pharmaceutical technology, such as continuous manufacturing and quality by design implementation, is increasingly adopted by CMOs to optimize manufacturing processes and reduce costs. Pharmaceutical technology transfer and process analytical technology use are essential components of CMO services, ensuring seamless integration of new processes and technologies. Risk management is a critical aspect of pharmaceutical manufacturing, and CMOs employ robust strategies to mitigate risks and ensure the highest quality standards. For instance, a leading CMO reduced the number of deviations by 30% through the implementation of advanced process control systems. Pharmaceutical supply chain management and quality management systems implementation are essential services offered by CMOs, ensuring timely delivery of high-quality products.
The pharmaceutical manufacturing process optimization provided by CMOs can lead to significant cost savings and improved product quality. In comparison, a leading CMO reduced the average cycle time for formulation development by 25% compared to their competitors, enabling their clients to bring their products to market faster. This competitive edge is a testament to the value that CMOs bring to the pharmaceutical industry, making them indispensable partners in drug development.
What are the key market drivers leading to the rise in the adoption of CMO In Pharmaceutical Industry Industry?
- In emerging markets, the accessibility to cost-effective resources serves as the primary catalyst for market growth.
- In the global healthcare landscape, countries like China, India, Brazil, and Mexico have experienced substantial progress in their healthcare infrastructure and technological advancements in drug development. This evolution has led large and mid-sized pharmaceutical companies from developed nations to outsource various drug research and manufacturing operations to these countries. The primary drivers of this trend include the availability of cost-effective labor and the increasing number of FDA-approved manufacturing plants. For instance, India remains a significant player in pharmaceutical contract manufacturing in 2024, with its appeal stemming from a unique blend of cost efficiency, skilled labor, and a robust regulatory framework.
- These countries' continuous advancements and their ability to cater to the evolving needs of the pharmaceutical industry make them valuable partners for companies seeking to optimize their operations and stay competitive.
What are the market trends shaping the CMO In Pharmaceutical Industry Industry?
- US-approved manufacturing facilities are becoming increasingly prevalent in the market. (Formal tone, sentence case) The Food and Drug Administration (FDA) has approved these facilities for their adherence to stringent regulations and high standards. (Formal tone, sentence case)
- In the dynamic pharmaceutical industry landscape of 2024, India and China continue to lead the global Contract Manufacturing Organizations (CMO) market. India's extensive network of US FDA-approved manufacturing facilities positions it as a preferred destination for pharmaceutical outsourcing. The country's regulatory compliance and cost-effective production have resulted in a consistent increase in approvals, particularly in the active pharmaceutical ingredient (API) and finished dosage form (FDF) segments. Indian pharmaceutical companies, such as Sun Pharma, Cipla, and Dr. Reddy Laboratories, have expanded their global reach by leveraging their FDA-compliant infrastructure and expertise in generics and complex formulations.
- China, on the other hand, is recognized for its large workforce and lower labor costs, making it an attractive option for CMOs seeking cost savings. Both countries' market shares remain significant, with India holding a slightly larger percentage due to its regulatory compliance and focus on quality.
What challenges does the CMO In Pharmaceutical Industry Industry face during its growth?
- The stereotypical nature of CMOs poses a significant challenge to the industry's growth, limiting progress and innovation through outdated perceptions.
- In the dynamic pharmaceutical industry landscape of 2024, the Contract Manufacturing Organizations (CMO) sector continues to evolve, particularly in the production of complex biologics. Although emerging markets like China and India dominate due to cost advantages and manufacturing scale, a notable disparity exists in their capacity to produce advanced biologics. The majority of Asian CMOs predominantly focus on small molecule-based generics, which are less complex and cost-effective to manufacture. Despite advancements in infrastructure and regulatory compliance, these CMOs face significant technological hurdles. They often lack access to sophisticated biomanufacturing technologies and the specialized expertise essential for large-scale production of biologics and vaccines.
- This technological deficit is further exacerbated by limited capital investment, hindering their potential to upgrade facilities or expand into high-value biologics. In summary, while emerging markets contribute significantly to the global CMO market, their ability to produce complex biologics remains a persistent challenge. Bridging this technological gap and securing adequate capital investment are crucial steps towards enabling these CMOs to compete effectively in the evolving pharmaceutical industry.
Exclusive Customer Landscape
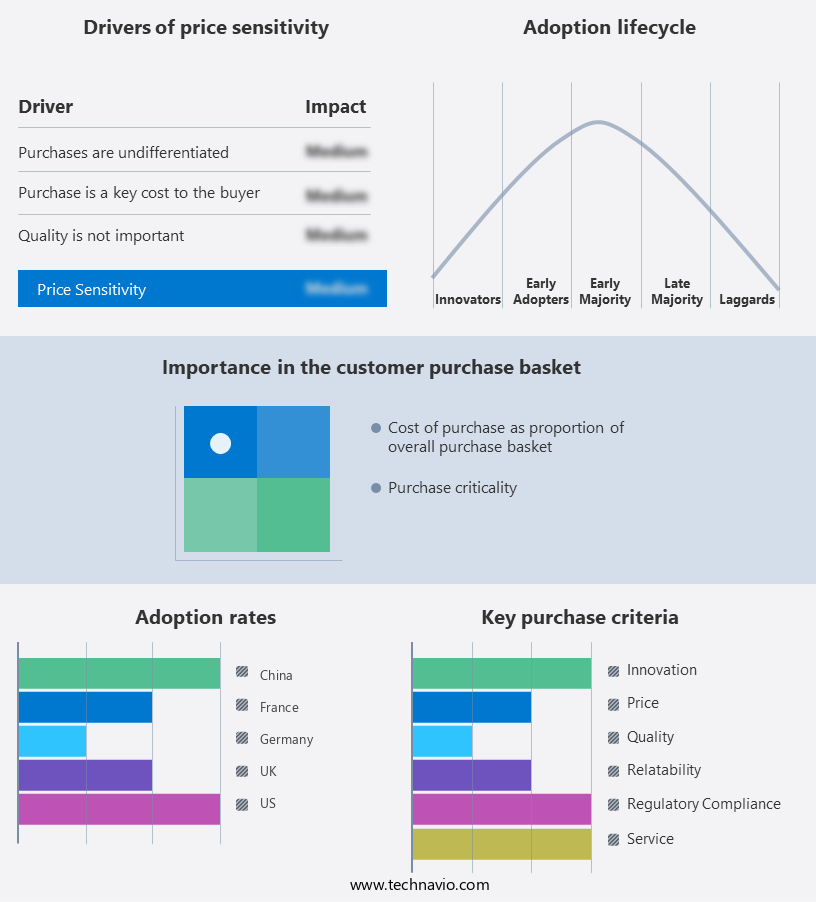
The CMO in pharmaceutical industry market forecasting report includes the adoption lifecycle of the market, covering from the innovator's stage to the laggard's stage. It focuses on adoption rates in different regions based on penetration. Furthermore, the CMO in pharmaceutical industry market report also includes key purchase criteria and drivers of price sensitivity to help companies evaluate and develop their market growth analysis strategies.
Customer Landscape of CMO In Pharmaceutical Industry Industry
Competitive Landscape & Market Insights
Companies are implementing various strategies, such as strategic alliances, CMO in pharmaceutical industry market forecast, partnerships, mergers and acquisitions, geographical expansion, and product/service launches, to enhance their presence in the industry.
Almac Group Ltd. - The company specializes in the production of Combi-Block Modified Oligonucleotides (CMOs), including 14C Radiolabelling and NeoPeptides, catering to the research industry's demand for advanced labeling and modification solutions.
The industry research and growth report includes detailed analyses of the competitive landscape of the market and information about key companies, including:
- Almac Group Ltd.
- Boehringer Ingelheim International GmbH
- Cadila Pharmaceuticals Ltd.
- Cambrex Corp.
- Catalent Inc.
- Chongqing Huapont Pharmaceutical Co. Ltd.
- Cipla Inc.
- Cmic Holdings Co. Ltd
- Curia Global Inc.
- Dr Reddys Laboratories Ltd.
- FAMAR Health Care Services
- Jubilant Pharma Ltd.
- Lonza Group Ltd.
- Lupin Ltd.
- PCI Pharma Services
- Pfizer Inc.
- Recipharm AB
- Samsung Biologics Co. Ltd.
- Thermo Fisher Scientific Inc.
- Vetter Pharma Fertigung GmbH and Co. KG
Qualitative and quantitative analysis of companies has been conducted to help clients understand the wider business environment as well as the strengths and weaknesses of key industry players. Data is qualitatively analyzed to categorize companies as pure play, category-focused, industry-focused, and diversified; it is quantitatively analyzed to categorize companies as dominant, leading, strong, tentative, and weak.
Recent Development and News in CMO In Pharmaceutical Industry Market
- In January 2024, Pfizer Inc. And Merck & Co. Announced a strategic collaboration to co-develop and co-commercialize Oral Semaglutide, a once-daily oral medication for type 2 diabetes (Reuters). This partnership marked a significant shift in the pharmaceutical industry, as two major competitors joined forces to leverage their resources and expertise to bring a new treatment to market.
- In March 2024, Novartis AG completed the acquisition of Endocyte, a biotechnology company specializing in targeted cancer therapies, for approximately USD2.1 billion (Bloomberg). This acquisition expanded Novartis' oncology portfolio and strengthened its position in the growing targeted therapy market.
- In April 2025, the European Medicines Agency granted a conditional marketing authorization for AstraZeneca's Farxiga (dapagliflozin) as an adjunct to diet and exercise to reduce the risk of major adverse cardiovascular events in adults with type 2 diabetes and established cardiovascular disease (AstraZeneca press release). This approval marked a significant regulatory milestone for AstraZeneca and expanded the indications for its popular diabetes treatment.
- In May 2025, Roche Holding AG and Illumina, Inc. Announced a strategic partnership to develop and commercialize companion diagnostics for Roche's oncology portfolio using Illumina's next-generation sequencing technology (Roche press release). This collaboration represents a significant technological advancement in the pharmaceutical industry, as personalized medicine becomes increasingly important in the development and delivery of effective treatments.
Dive into Technavio's robust research methodology, blending expert interviews, extensive data synthesis, and validated models for unparalleled CMO In Pharmaceutical Industry Market insights. See full methodology.
|
Market Scope |
|
|
Report Coverage |
Details |
|
Page number |
208 |
|
Base year |
2024 |
|
Historic period |
2019-2023 |
|
Forecast period |
2025-2029 |
|
Growth momentum & CAGR |
Accelerate at a CAGR of 6.5% |
|
Market growth 2025-2029 |
USD 42.7 million |
|
Market structure |
Fragmented |
|
YoY growth 2024-2025(%) |
6.0 |
|
Key countries |
US, Germany, China, France, UK, Canada, Italy, Spain, Japan, and India |
|
Competitive landscape |
Leading Companies, Market Positioning of Companies, Competitive Strategies, and Industry Risks |
Research Analyst Overview
- In the dynamic and intricate landscape of the pharmaceutical industry, the role of CMOs (Contract Manufacturing Organizations) continues to evolve, shaping the way drug substance manufacturing is carried out. This evolution is marked by advancements in various areas, including technology transfer, stability testing, and quality assurance systems. CMOs are increasingly adopting technology transfer pharmaceutical practices, ensuring seamless integration of new technologies into their manufacturing processes. This leads to improved pharmaceutical technology, enabling Quality by Design principles and enhancing compliance monitoring. The emphasis on risk management pharmaceutical strategies has given rise to the implementation of continuous manufacturing processes, optimizing production scheduling and supply chain management.
- Cost reduction strategies, such as process optimization and the use of Process Analytical Technology, are also becoming more prevalent. In the realm of drug product development, regulatory affairs and production scheduling are critical components. CMOs are investing in data integrity systems and regulatory submissions to ensure GMP compliance and maintain manufacturing capacity. Furthermore, the integration of Process Validation and Quality Control Systems is essential for maintaining the highest standards in drug manufacturing processes. Facility qualification and packaging processes are also undergoing significant improvements, with a focus on scale-up processes and clinical trial management. Equipment validation and pharmaceutical development are also key areas of innovation, as CMOs strive to stay competitive in the market.
- The implementation of advanced data integrity systems, drug delivery systems, and analytical testing is transforming the industry, ensuring the delivery of high-quality pharmaceutical products. In summary, the CMO market in the pharmaceutical industry is characterized by continuous evolution and innovation, with a focus on improving manufacturing processes, enhancing quality assurance systems, and ensuring regulatory compliance. This dynamic landscape is driven by advancements in technology, a growing emphasis on risk management, and a commitment to cost reduction strategies.
What are the Key Data Covered in this CMO In Pharmaceutical Industry Market Research and Growth Report?
-
What is the expected growth of the CMO In Pharmaceutical Industry Market between 2025 and 2029?
-
USD 42.7 million, at a CAGR of 6.5%
-
-
What segmentation does the market report cover?
-
The report segmented by Service (API manufacturing and FDF manufacturing), Drug Class (Small molecule, Drugs biologics, and High potency drugs), End-user (Big pharma, Small and medium enterprises (SMEs), Generic drug manufacturers, and Biotech companies), and Geography (Europe, North America, APAC, Middle East and Africa, and South America)
-
-
Which regions are analyzed in the report?
-
Europe, North America, APAC, Middle East and Africa, and South America
-
-
What are the key growth drivers and market challenges?
-
Availability of cost-efficient resources in emerging markets, Stereotypical nature of CMOs
-
-
Who are the major players in the CMO In Pharmaceutical Industry Market?
-
Key Companies Almac Group Ltd., Boehringer Ingelheim International GmbH, Cadila Pharmaceuticals Ltd., Cambrex Corp., Catalent Inc., Chongqing Huapont Pharmaceutical Co. Ltd., Cipla Inc., Cmic Holdings Co. Ltd, Curia Global Inc., Dr Reddys Laboratories Ltd., FAMAR Health Care Services, Jubilant Pharma Ltd., Lonza Group Ltd., Lupin Ltd., PCI Pharma Services, Pfizer Inc., Recipharm AB, Samsung Biologics Co. Ltd., Thermo Fisher Scientific Inc., and Vetter Pharma Fertigung GmbH and Co. KG
-
Market Research Insights
- In the dynamic pharmaceutical industry market, the Chief Marketing Officer (CMO) role assumes a pivotal function, overseeing various aspects from clinical supplies to drug product development. The CMO's responsibilities span across pharmaceutical excipients, validation master plans, and supply chain logistics. They ensure quality management systems align with regulatory strategies, implementing auditing systems for injectable and aqueous formulations. The CMO's influence extends to project management, deviation management, and production optimization, driving process efficiency and improving manufacturing efficiency. Technical documentation, contract research organizations, and process improvement are integral components of their role. Personnel training and CGMP compliance are crucial for maintaining high-quality standards.
- The pharmaceutical industry's complexity is underscored by the intricate interplay between drug substance and drug product development. For instance, the production of solid dosage forms like tablets and capsule filling requires meticulous process monitoring and change management. Sterile manufacturing, in turn, necessitates stringent quality control measures. Two key performance indicators illustrate the CMO's impact: a 20% increase in process efficiency led to an estimated annual savings of USD5 million. Meanwhile, a 15% reduction in deviations resulted in improved manufacturing efficiency and enhanced product quality. These figures underscore the importance of the CMO's role in optimizing pharmaceutical operations.
We can help! Our analysts can customize this CMO in pharmaceutical industry market research report to meet your requirements.
 RIA -
RIA - 
