Sugar-Free Food And Beverage Market Size 2025-2029
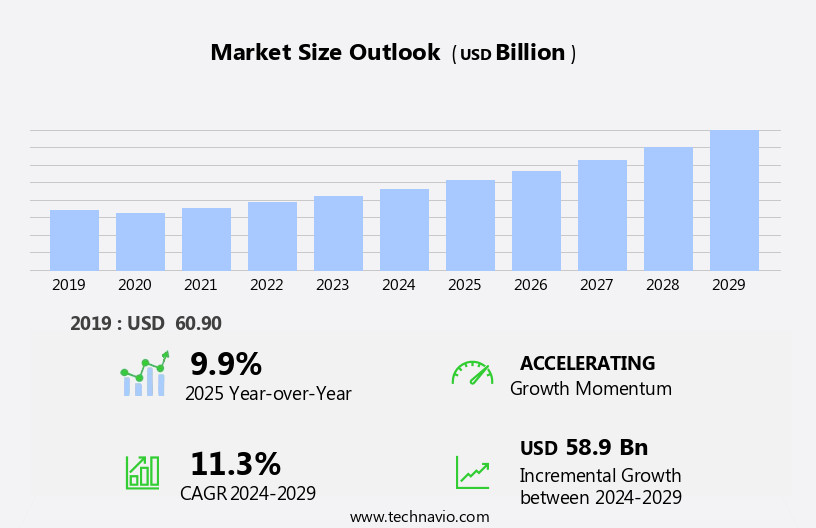
The sugar-free food and beverage market size is forecast to increase by USD 58.9 billion at a CAGR of 11.3% between 2024 and 2029.
- The market is witnessing significant growth due to several key trends. One of the major factors driving market growth is the increasing influence of online retailing. Consumers are increasingly preferring to purchase sugar-free products online due to the convenience and wide product selection. Another trend is the increasing prominence of private-label brands, which offer consumers affordable and high-quality sugar-free options. Sugar-free concepts extend to biscuits, cookies, muffins, and various types of beverages like whey protein drinks in flavors such as vanilla, chocolate, mint chip, and strawberry. However, the market faces challenges such as the lower acceptance of sugar-free products due to ambiguity surrounding the safety profile of artificial sweeteners. Producers must address consumer concerns by providing clear labeling and transparent information about the ingredients used in their products. Overall, the market is expected to continue its growth trajectory, driven by these trends and challenges.
What will be the Size of the Sugar-Free Food And Beverage Market During the Forecast Period?

Request Free Sample
- The market encompasses a wide range of products designed to cater to consumers seeking to reduce their intake of added sugars. Fueled by rising health consciousness and the prevalence of disorders such as diabetes and obesity, this market has experienced significant growth. Glycation, a process that damages proteins and fats In the body due to sugar intake, has heightened awareness of the negative effects of refined sugar. As a result, demand for low-calorie beverages, sugar substitutes, and sugar-free alternatives has increased. Veganism, gluten-free, raw, refined sugar-free, organic, and other dietary trends have also influenced the market's direction. Consumers increasingly prefer sugar-free and zero-sugar options, prioritizing taste and calorie reduction over traditional sugar-laden products.
- The market's size is substantial, with low-calorie foods and beverages accounting for a notable share. Sugar taxes and regulations aimed at limiting added sugars have further boosted market growth. The industry continues to innovate, offering a diverse range of sugar-free products that cater to various dietary preferences and needs. The market is poised for continued expansion as consumers increasingly seek healthier alternatives to traditional sugary options.
How is this Sugar-Free Food And Beverage Industry segmented and which is the largest segment?
The sugar-free food and beverage industry research report provides comprehensive data (region-wise segment analysis), with forecasts and estimates in "USD billion" for the period 2025-2029, as well as historical data from 2019-2023 for the following segments.
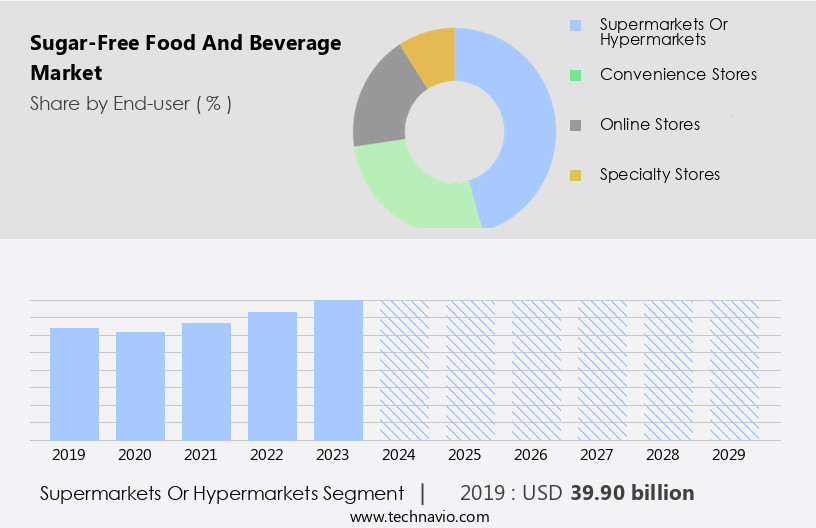
- End-user
- Supermarkets or hypermarkets
- Convenience stores
- Online stores
- Specialty stores
- Product
- Sugar-free beverages
- Sugar-free dairy products
- Sugar-free confectionery
- Sugar-free bakery
- Sugar-free ice-creams
- Product Type
- Artificial sweeteners
- Natural sweeteners
- Sugar alcohols
- Packaging
- Bottles and cans
- Pouches and sachets
- Boxes and cartons
- Geography
- North America
- Europe
- APAC
- South America
- Middle East and Africa
By End-user Insights
- The supermarkets or hypermarkets segment is estimated to witness significant growth during the forecast period.
Supermarkets and hypermarkets serve as the primary distribution channels for sugar-free food and beverages due to their extensive product offerings and competitive pricing. Consumers are drawn to these retail outlets for their convenient one-stop shopping experience, enhanced by discounts and attractive shelf displays. Supermarkets' high product volumes grant them significant buying power, enabling them to price sugar-free items competitively, often at discounted rates. Sugar-free alternatives cater to various health concerns, including diabetes, obesity, irritable bowel disease, and Crohn's disease. These products encompass low-calorie beverages, sugar substitutes, vegan, gluten-free, raw, refined sugar-free, organic, non-GMO, oil-free, and low-carb options.

Get a glance at the Sugar-Free Food And Beverage Industry report of share of various segments Request Free Sample
The supermarkets or hypermarkets segment was valued at USD 39.90 billion in 2019 and showed a gradual increase during the forecast period.
Regional Analysis
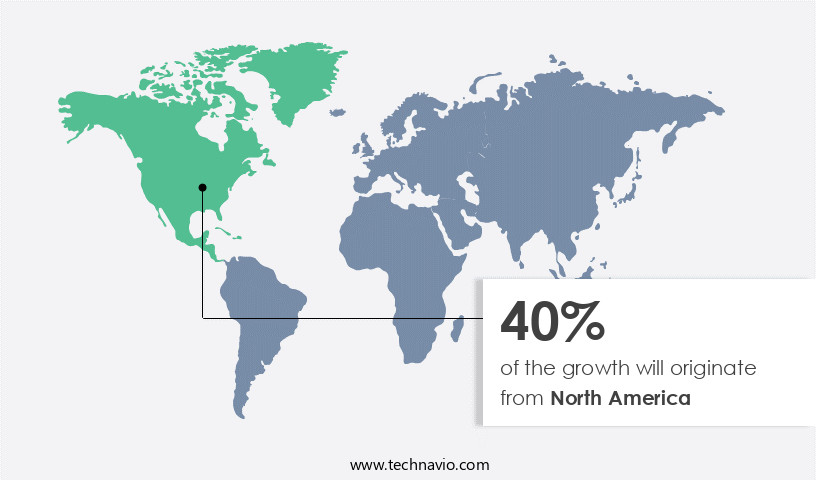
- North America is estimated to contribute 40% to the growth of the global market during the forecast period.
Technavio's analysts have elaborately explained the regional trends and drivers that shape the market during the forecast period.

For more insights on the market share of various regions, Request Free Sample
The North American market for sugar-free food and beverages is experiencing significant growth due to the rising prevalence of obesity and diabetes. According to recent studies, over 34 million Americans have diabetes, and an estimated 84.1 million have pre-diabetes. This health concern has led consumers to seek low-calorie, sugar-free alternatives to processed foods and beverages. Major food and beverage companies, such as Coca Cola and Hershey, headquartered In the region, are responding to this trend by introducing sugar-free versions of their popular products. Additionally, the increasing popularity of veganism, gluten-free, raw, refined sugar-free, organic, non-GMO, oil-free, and low-carb diets is fueling the demand for sugar-free products.
Market Dynamics
Our researchers analyzed the data with 2024 as the base year, along with the key drivers, trends, and challenges. A holistic analysis of drivers will help companies refine their marketing strategies to gain a competitive advantage.
What are the key market drivers leading to the rise In the adoption of Sugar-Free Food And Beverage Industry?
Growing influence of online retailing is the key driver of the market.
- The market has witnessed notable growth due to the rising health consciousness among consumers. Factors such as diabetes, obesity, and various disorders, including irritable bowel disease and Crohn's disease, have driven the demand for sugar-free alternatives. Low-calorie beverages, sugar substitutes, and vegan, gluten-free, raw, refined sugar-free, organic, non-GMO, oil-free, and other sugar-free products have gained popularity. Type 2 diabetes and pre-diabetes patients, as well as health-conscious consumers, seek low-carb beverages and metabolic state-friendly food options. Maltitol, sucrose, and glucose are common sugar substitutes used in sugar-free products. Companies like Mondelez International offer sugar-free versions of popular items such as biscuits, cookies, and muffins in various flavors like vanilla, chocolate, mint chip, and strawberry.
- In addition, overweight and obese individuals are increasingly opting for sugar-free alternatives to reduce their sugar intake and manage their caloric consumption. The market dynamics are influenced by factors such as low-sugar solutions, increasing product formulations, and the availability of a wide range of sugar-free foods and beverages in specialty stores, online retail, and convenience stores. Zero sugar and calorie-conscious consumers are driving the demand for low-calorie foods, while sugar taxes and the availability of hygienic, nutritious foods further fuel market growth. Dietary supplements and tabletop sweeteners are other sugar-free product categories that cater to specific dietary needs. The sweetening type and taste preferences of consumers continue to influence product development.
What are the market trends shaping the Sugar-Free Food And Beverage Industry?
Increasing prominence of private-label brands is the upcoming market trend.
- The market is witnessing significant growth due to increasing health consciousness among consumers. This trend is driven by the rising prevalence of conditions such as diabetes, obesity, irritable bowel disease, and Crohn's disease, which require individuals to adopt low-sugar diets. As a result, retailers are expanding their private-label offerings to include sugar-free alternatives. These include low-calorie beverages, sugar substitutes like maltitol and stevia, and vegan, gluten-free, raw, refined sugar-free, organic, non-GMO, oil-free, and dairy-free options. Product formulators are developing low-carb beverages and low-sugar solutions to cater to this market. The demand for sugar-free foods and beverages is not limited to specific diets but is also being adopted by health-conscious customers.
- The market includes a wide range of products, from sugar-free biscuits, cookies, and muffins, to sugar-free type 2 diabetes-friendly foods, and sugar-free beverages like whey protein drinks in flavors such as vanilla, chocolate, mint chip, and strawberry. The market also offers tabletop sweeteners and other sugar-free products. The taste and calorie count of these products are important considerations for consumers. The market for sugar-free and low-calorie foods and beverages is expected to continue growing as more people seek healthier alternatives to processed food and fast food sales. Sugar taxes and a focus on hygiene and nutritious foods are further fueling the demand for these products.
What challenges does the Sugar-Free Food And Beverage Industry face during its growth?
Lower acceptance due to ambiguity on safety profile of artificial sweeteners is a key challenge affecting the industry growth.
- The market caters to health-conscious consumers with various dietary requirements, including those with diabetes, obesity, irritable bowel disease, and other disorders. The demand for sugar-free alternatives to conventional sweeteners, such as refined sugar, sucrose, and glucose, is increasing due to concerns over health risks associated with added sugar intake. Low-calorie beverages, sugar substitutes like maltitol, and low-carb beverages are popular choices. Moreover, consumers are increasingly opting for vegan, gluten-free, raw, organic, non-GMO, oil-free, and dairy-free options. The Caribbean market offers a range of sugar-free products, including biscuits, cookies, muffins, and tabletop sweeteners. Type 2 diabetes, pre-diabetes, and metabolic disorders have driven the demand for sugar-free solutions.
- Product formulators are focusing on creating low-calorie foods and zero sugar beverages that do not compromise on taste. The market for sugar-free beverages, including whey protein drinks in flavors like vanilla, chocolate, mint chip, and strawberry, is growing. Health consciousness and specific diets, such as low-sugar and sugar-free concepts, have led to the popularity of sugar-free products. The market for sugar-free and low-calorie products is expected to grow as consumers seek nutritious foods to manage their health conditions and maintain a healthy lifestyle. The demand for sugar-free alternatives to processed food and fast food sales is also increasing due to sugar taxes and the availability of sugar-free options in specialty stores, online retail, and convenience stores.
Exclusive Customer Landscape
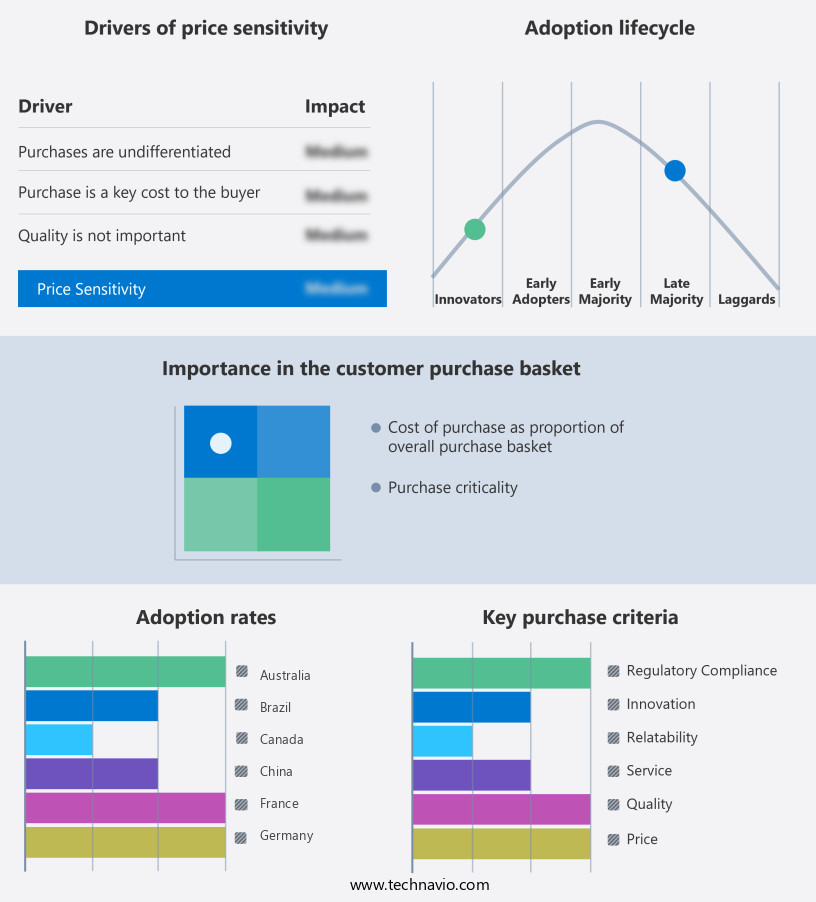
The sugar-free food and beverage market forecasting report includes the adoption lifecycle of the market, covering from the innovator's stage to the laggard's stage. It focuses on adoption rates in different regions based on penetration. Furthermore, the sugar-free food and beverage market report also includes key purchase criteria and drivers of price sensitivity to help companies evaluate and develop their market growth analysis strategies.

Customer Landscape
Key Companies & Market Insights
Companies are implementing various strategies, such as strategic alliances, sugar-free food and beverage market forecast, partnerships, mergers and acquisitions, geographical expansion, and product/service launches, to enhance their presence In the industry.
Atkinson Candy Co. - The company offers sugar-free food and beverages that include candies, gums, chocolates, and various other sweeteners.
The industry research and growth report includes detailed analyses of the competitive landscape of the market and information about key companies, including:
- Britvic plc
- Chocoladefabriken Lindt and Sprungli AG
- Flowers Foods Inc.
- General Mills Inc.
- Gujarat Cooperative Milk Marketing Federation Ltd.
- Jones Soda Co.
- Kellogg Co.
- Keurig Dr Pepper Inc.
- Monster Energy Co.
- Nestle SA
- PepsiCo Inc.
- Russell Stover Chocolates
- Suntory Beverage and Food Ltd.
- The Coca Cola Co.
- The Hershey Co.
- The Kraft Heinz Co.
- Turkey Hill Dairy
- Vadilal Industries Ltd.
- Wells Enterprises Inc.
Qualitative and quantitative analysis of companies has been conducted to help clients understand the wider business environment as well as the strengths and weaknesses of key industry players. Data is qualitatively analyzed to categorize companies as pure play, category-focused, industry-focused, and diversified; it is quantitatively analyzed to categorize companies as dominant, leading, strong, tentative, and weak.
Research Analyst Overview
The market is witnessing significant growth due to the increasing health consciousness among consumers. This trend is driven by the rising prevalence of disorders such as diabetes, obesity, and gastrointestinal conditions like irritable bowel disease and Crohn's disease. The demand for sugar substitutes in food and beverages is on the rise as consumers seek low-calorie alternatives to refined sugar. The shift towards veganism, gluten-free, raw, and organic diets is also fueling the growth of the sugar-free market. Consumers are increasingly opting for sugar-free and low-calorie beverages, biscuits, cookies, muffins, and other baked goods. The market for sugar-free and low-carb beverages is particularly strong, as these products cater to consumers in a metabolic state seeking to manage their blood sugar levels.
In addition, product formulators are responding to this trend by developing a wide range of sugar-free and low-calorie products. These include sugar-free concept snacks, dairy-free and lactose-free milk alternatives, and sugar-free and zero sugar beverages. The taste and calorie count of these products are crucial factors In their success, as consumers demand products that are not only healthier but also delicious. The sugar-free market is diverse, with a range of sweetening types available, including natural and artificial sugar substitutes. Maltitol, a common sugar substitute, is derived from corn and has a sweet taste similar to sugar. Other sugar alternatives include sucrose, glucose, and various types of sugar alcohols.
Furthermore, the sugar-free and low-calorie food and beverage market is also influenced by health-conscious consumers who are seeking nutritious foods and avoiding processed foods and fast food sales. The market for sugar-free and low-calorie products is expanding, with specialty stores, online retail, and convenience stores offering a wide range of options. The demand for sugar-free and low-calorie products is driven by the increasing number of health disorders related to sugar intake. According to the World Health Organization, non-communicable diseases, including cardiovascular disease and diabetes, accounted for 71% of all global deaths in 2016. The prevalence of these diseases is increasing, and many are linked to high sugar intake.
Market Scope
|
Report Coverage
|
Details
|
Page number
|
255
|
Base year
|
2024
|
Historic period
|
2019-2023 |
Forecast period
|
2025-2029
|
Growth momentum & CAGR
|
Accelerate at a CAGR of 11.3%
|
Market growth 2025-2029
|
USD 58.9 billion
|
Market structure
|
Fragmented
|
YoY growth 2024-2025(%)
|
9.9
|
Key countries
|
US, China, Germany, Canada, Italy, UK, France, India, Brazil, and Australia
|
Competitive landscape
|
Leading Companies, market growth and forecasting , Market Positioning of Companies, Competitive Strategies, and Industry Risks
|
Request Free Sample
What are the Key Data Covered in this Sugar-Free Food And Beverage Market Research and Growth Report?
- CAGR of the Sugar-Free Food And Beverage industry during the forecast period
- Detailed information on factors that will drive the growth and forecasting between 2025 and 2029
- Precise estimation of the size of the market and its contribution of the industry in focus to the parent market
- Accurate predictions about upcoming growth and trends and changes in consumer behaviour
- Growth of the market across North America, Europe, APAC, South America, and Middle East and Africa
- Thorough analysis of the market's competitive landscape and detailed information about companies
- Comprehensive analysis of factors that will challenge the sugar-free food and beverage market growth of industry companies
We can help! Our analysts can customize this sugar-free food and beverage market research report to meet your requirements.
Get in touch
1 Executive Summary
- 1.1 Market overview
- Executive Summary - Chart on Market Overview
- Executive Summary - Data Table on Market Overview
- Executive Summary - Chart on Global Market Characteristics
- Executive Summary - Chart on Market by Geography
- Executive Summary - Chart on Market Segmentation by End-user
- Executive Summary - Chart on Market Segmentation by Product
- Executive Summary - Chart on Market Segmentation by Product Type
- Executive Summary - Chart on Market Segmentation by Packaging
- Executive Summary - Chart on Incremental Growth
- Executive Summary - Data Table on Incremental Growth
- Executive Summary - Chart on Company Market Positioning
2 Technavio Analysis
- 2.1 Analysis of price sensitivity, lifecycle, customer purchase basket, adoption rates, and purchase criteria
- Analysis of price sensitivity, lifecycle, customer purchase basket, adoption rates, and purchase criteria
- 2.2 Criticality of inputs and Factors of differentiation
- Overview on criticality of inputs and factors of differentiation
- 2.3 Factors of disruption
- Overview on factors of disruption
- 2.4 Impact of drivers and challenges
- Impact of drivers and challenges in 2024 and 2029
3 Market Landscape
- 3.1 Market ecosystem
- Parent Market
- Data Table on - Parent Market
- 3.2 Market characteristics
- Market characteristics analysis
4 Market Sizing
- 4.1 Market definition
- Offerings of companies included in the market definition
- 4.2 Market segment analysis
- 4.4 Market outlook: Forecast for 2024-2029
- Chart on Global - Market size and forecast 2024-2029 ($ billion)
- Data Table on Global - Market size and forecast 2024-2029 ($ billion)
- Chart on Global Market: Year-over-year growth 2024-2029 (%)
- Data Table on Global Market: Year-over-year growth 2024-2029 (%)
5 Historic Market Size
- 5.1 Global Sugar-Free Food And Beverage Market 2019 - 2023
- Historic Market Size - Data Table on Global Sugar-Free Food And Beverage Market 2019 - 2023 ($ billion)
- 5.2 End-user segment analysis 2019 - 2023
- Historic Market Size - End-user Segment 2019 - 2023 ($ billion)
- 5.3 Product segment analysis 2019 - 2023
- Historic Market Size - Product Segment 2019 - 2023 ($ billion)
- 5.4 Product Type segment analysis 2019 - 2023
- Historic Market Size - Product Type Segment 2019 - 2023 ($ billion)
- 5.5 Packaging segment analysis 2019 - 2023
- Historic Market Size - Packaging Segment 2019 - 2023 ($ billion)
- 5.6 Geography segment analysis 2019 - 2023
- Historic Market Size - Geography Segment 2019 - 2023 ($ billion)
- 5.7 Country segment analysis 2019 - 2023
- Historic Market Size - Country Segment 2019 - 2023 ($ billion)
6 Qualitative Analysis
- 6.1 The AI impact on Global Sugar-Free Food and Beverage Market
7 Five Forces Analysis
- 7.1 Five forces summary
- Five forces analysis - Comparison between 2024 and 2029
- 7.2 Bargaining power of buyers
- Bargaining power of buyers - Impact of key factors 2024 and 2029
- 7.3 Bargaining power of suppliers
- Bargaining power of suppliers - Impact of key factors in 2024 and 2029
- 7.4 Threat of new entrants
- Threat of new entrants - Impact of key factors in 2024 and 2029
- 7.5 Threat of substitutes
- Threat of substitutes - Impact of key factors in 2024 and 2029
- 7.6 Threat of rivalry
- Threat of rivalry - Impact of key factors in 2024 and 2029
- 7.7 Market condition
- Chart on Market condition - Five forces 2024 and 2029
8 Market Segmentation by End-user
- 8.1 Market segments
- Chart on End-user - Market share 2024-2029 (%)
- Data Table on End-user - Market share 2024-2029 (%)
- 8.2 Comparison by End-user
- Chart on Comparison by End-user
- Data Table on Comparison by End-user
- 8.3 Supermarkets or hypermarkets - Market size and forecast 2024-2029
- Chart on Supermarkets or hypermarkets - Market size and forecast 2024-2029 ($ billion)
- Data Table on Supermarkets or hypermarkets - Market size and forecast 2024-2029 ($ billion)
- Chart on Supermarkets or hypermarkets - Year-over-year growth 2024-2029 (%)
- Data Table on Supermarkets or hypermarkets - Year-over-year growth 2024-2029 (%)
- 8.4 Convenience stores - Market size and forecast 2024-2029
- Chart on Convenience stores - Market size and forecast 2024-2029 ($ billion)
- Data Table on Convenience stores - Market size and forecast 2024-2029 ($ billion)
- Chart on Convenience stores - Year-over-year growth 2024-2029 (%)
- Data Table on Convenience stores - Year-over-year growth 2024-2029 (%)
- 8.5 Online stores - Market size and forecast 2024-2029
- Chart on Online stores - Market size and forecast 2024-2029 ($ billion)
- Data Table on Online stores - Market size and forecast 2024-2029 ($ billion)
- Chart on Online stores - Year-over-year growth 2024-2029 (%)
- Data Table on Online stores - Year-over-year growth 2024-2029 (%)
- 8.6 Specialty stores - Market size and forecast 2024-2029
- Chart on Specialty stores - Market size and forecast 2024-2029 ($ billion)
- Data Table on Specialty stores - Market size and forecast 2024-2029 ($ billion)
- Chart on Specialty stores - Year-over-year growth 2024-2029 (%)
- Data Table on Specialty stores - Year-over-year growth 2024-2029 (%)
- 8.7 Market opportunity by End-user
- Market opportunity by End-user ($ billion)
- Data Table on Market opportunity by End-user ($ billion)
9 Market Segmentation by Product
- 9.1 Market segments
- Chart on Product - Market share 2024-2029 (%)
- Data Table on Product - Market share 2024-2029 (%)
- 9.2 Comparison by Product
- Chart on Comparison by Product
- Data Table on Comparison by Product
- 9.3 Sugar-free beverages - Market size and forecast 2024-2029
- Chart on Sugar-free beverages - Market size and forecast 2024-2029 ($ billion)
- Data Table on Sugar-free beverages - Market size and forecast 2024-2029 ($ billion)
- Chart on Sugar-free beverages - Year-over-year growth 2024-2029 (%)
- Data Table on Sugar-free beverages - Year-over-year growth 2024-2029 (%)
- 9.4 Sugar-free dairy products - Market size and forecast 2024-2029
- Chart on Sugar-free dairy products - Market size and forecast 2024-2029 ($ billion)
- Data Table on Sugar-free dairy products - Market size and forecast 2024-2029 ($ billion)
- Chart on Sugar-free dairy products - Year-over-year growth 2024-2029 (%)
- Data Table on Sugar-free dairy products - Year-over-year growth 2024-2029 (%)
- 9.5 Sugar-free confectionery - Market size and forecast 2024-2029
- Chart on Sugar-free confectionery - Market size and forecast 2024-2029 ($ billion)
- Data Table on Sugar-free confectionery - Market size and forecast 2024-2029 ($ billion)
- Chart on Sugar-free confectionery - Year-over-year growth 2024-2029 (%)
- Data Table on Sugar-free confectionery - Year-over-year growth 2024-2029 (%)
- 9.6 Sugar-free bakery - Market size and forecast 2024-2029
- Chart on Sugar-free bakery - Market size and forecast 2024-2029 ($ billion)
- Data Table on Sugar-free bakery - Market size and forecast 2024-2029 ($ billion)
- Chart on Sugar-free bakery - Year-over-year growth 2024-2029 (%)
- Data Table on Sugar-free bakery - Year-over-year growth 2024-2029 (%)
- 9.7 Sugar-free ice-creams - Market size and forecast 2024-2029
- Chart on Sugar-free ice-creams - Market size and forecast 2024-2029 ($ billion)
- Data Table on Sugar-free ice-creams - Market size and forecast 2024-2029 ($ billion)
- Chart on Sugar-free ice-creams - Year-over-year growth 2024-2029 (%)
- Data Table on Sugar-free ice-creams - Year-over-year growth 2024-2029 (%)
- 9.8 Market opportunity by Product
- Market opportunity by Product ($ billion)
- Data Table on Market opportunity by Product ($ billion)
10 Market Segmentation by Product Type
- 10.1 Market segments
- Chart on Product Type - Market share 2024-2029 (%)
- Data Table on Product Type - Market share 2024-2029 (%)
- 10.2 Comparison by Product Type
- Chart on Comparison by Product Type
- Data Table on Comparison by Product Type
- 10.3 Artificial sweeteners - Market size and forecast 2024-2029
- Chart on Artificial sweeteners - Market size and forecast 2024-2029 ($ billion)
- Data Table on Artificial sweeteners - Market size and forecast 2024-2029 ($ billion)
- Chart on Artificial sweeteners - Year-over-year growth 2024-2029 (%)
- Data Table on Artificial sweeteners - Year-over-year growth 2024-2029 (%)
- 10.4 Natural sweeteners - Market size and forecast 2024-2029
- Chart on Natural sweeteners - Market size and forecast 2024-2029 ($ billion)
- Data Table on Natural sweeteners - Market size and forecast 2024-2029 ($ billion)
- Chart on Natural sweeteners - Year-over-year growth 2024-2029 (%)
- Data Table on Natural sweeteners - Year-over-year growth 2024-2029 (%)
- 10.5 Sugar alcohols - Market size and forecast 2024-2029
- Chart on Sugar alcohols - Market size and forecast 2024-2029 ($ billion)
- Data Table on Sugar alcohols - Market size and forecast 2024-2029 ($ billion)
- Chart on Sugar alcohols - Year-over-year growth 2024-2029 (%)
- Data Table on Sugar alcohols - Year-over-year growth 2024-2029 (%)
- 10.6 Market opportunity by Product Type
- Market opportunity by Product Type ($ billion)
- Data Table on Market opportunity by Product Type ($ billion)
11 Market Segmentation by Packaging
- 11.1 Market segments
- Chart on Packaging - Market share 2024-2029 (%)
- Data Table on Packaging - Market share 2024-2029 (%)
- 11.2 Comparison by Packaging
- Chart on Comparison by Packaging
- Data Table on Comparison by Packaging
- 11.3 Bottles and cans - Market size and forecast 2024-2029
- Chart on Bottles and cans - Market size and forecast 2024-2029 ($ billion)
- Data Table on Bottles and cans - Market size and forecast 2024-2029 ($ billion)
- Chart on Bottles and cans - Year-over-year growth 2024-2029 (%)
- Data Table on Bottles and cans - Year-over-year growth 2024-2029 (%)
- 11.4 Pouches and sachets - Market size and forecast 2024-2029
- Chart on Pouches and sachets - Market size and forecast 2024-2029 ($ billion)
- Data Table on Pouches and sachets - Market size and forecast 2024-2029 ($ billion)
- Chart on Pouches and sachets - Year-over-year growth 2024-2029 (%)
- Data Table on Pouches and sachets - Year-over-year growth 2024-2029 (%)
- 11.5 Boxes and cartons - Market size and forecast 2024-2029
- Chart on Boxes and cartons - Market size and forecast 2024-2029 ($ billion)
- Data Table on Boxes and cartons - Market size and forecast 2024-2029 ($ billion)
- Chart on Boxes and cartons - Year-over-year growth 2024-2029 (%)
- Data Table on Boxes and cartons - Year-over-year growth 2024-2029 (%)
- 11.6 Market opportunity by Packaging
- Market opportunity by Packaging ($ billion)
- Data Table on Market opportunity by Packaging ($ billion)
12 Customer Landscape
- 12.1 Customer landscape overview
- Analysis of price sensitivity, lifecycle, customer purchase basket, adoption rates, and purchase criteria
13 Geographic Landscape
- 13.1 Geographic segmentation
- Chart on Market share by geography 2024-2029 (%)
- Data Table on Market share by geography 2024-2029 (%)
- 13.2 Geographic comparison
- Chart on Geographic comparison
- Data Table on Geographic comparison
- 13.3 North America - Market size and forecast 2024-2029
- Chart on North America - Market size and forecast 2024-2029 ($ billion)
- Data Table on North America - Market size and forecast 2024-2029 ($ billion)
- Chart on North America - Year-over-year growth 2024-2029 (%)
- Data Table on North America - Year-over-year growth 2024-2029 (%)
- 13.4 Europe - Market size and forecast 2024-2029
- Chart on Europe - Market size and forecast 2024-2029 ($ billion)
- Data Table on Europe - Market size and forecast 2024-2029 ($ billion)
- Chart on Europe - Year-over-year growth 2024-2029 (%)
- Data Table on Europe - Year-over-year growth 2024-2029 (%)
- 13.5 APAC - Market size and forecast 2024-2029
- Chart on APAC - Market size and forecast 2024-2029 ($ billion)
- Data Table on APAC - Market size and forecast 2024-2029 ($ billion)
- Chart on APAC - Year-over-year growth 2024-2029 (%)
- Data Table on APAC - Year-over-year growth 2024-2029 (%)
- 13.6 South America - Market size and forecast 2024-2029
- Chart on South America - Market size and forecast 2024-2029 ($ billion)
- Data Table on South America - Market size and forecast 2024-2029 ($ billion)
- Chart on South America - Year-over-year growth 2024-2029 (%)
- Data Table on South America - Year-over-year growth 2024-2029 (%)
- 13.7 Middle East and Africa - Market size and forecast 2024-2029
- Chart on Middle East and Africa - Market size and forecast 2024-2029 ($ billion)
- Data Table on Middle East and Africa - Market size and forecast 2024-2029 ($ billion)
- Chart on Middle East and Africa - Year-over-year growth 2024-2029 (%)
- Data Table on Middle East and Africa - Year-over-year growth 2024-2029 (%)
- 13.8 US - Market size and forecast 2024-2029
- Chart on US - Market size and forecast 2024-2029 ($ billion)
- Data Table on US - Market size and forecast 2024-2029 ($ billion)
- Chart on US - Year-over-year growth 2024-2029 (%)
- Data Table on US - Year-over-year growth 2024-2029 (%)
- 13.9 China - Market size and forecast 2024-2029
- Chart on China - Market size and forecast 2024-2029 ($ billion)
- Data Table on China - Market size and forecast 2024-2029 ($ billion)
- Chart on China - Year-over-year growth 2024-2029 (%)
- Data Table on China - Year-over-year growth 2024-2029 (%)
- 13.10 Canada - Market size and forecast 2024-2029
- Chart on Canada - Market size and forecast 2024-2029 ($ billion)
- Data Table on Canada - Market size and forecast 2024-2029 ($ billion)
- Chart on Canada - Year-over-year growth 2024-2029 (%)
- Data Table on Canada - Year-over-year growth 2024-2029 (%)
- 13.11 Germany - Market size and forecast 2024-2029
- Chart on Germany - Market size and forecast 2024-2029 ($ billion)
- Data Table on Germany - Market size and forecast 2024-2029 ($ billion)
- Chart on Germany - Year-over-year growth 2024-2029 (%)
- Data Table on Germany - Year-over-year growth 2024-2029 (%)
- 13.12 Italy - Market size and forecast 2024-2029
- Chart on Italy - Market size and forecast 2024-2029 ($ billion)
- Data Table on Italy - Market size and forecast 2024-2029 ($ billion)
- Chart on Italy - Year-over-year growth 2024-2029 (%)
- Data Table on Italy - Year-over-year growth 2024-2029 (%)
- 13.13 UK - Market size and forecast 2024-2029
- Chart on UK - Market size and forecast 2024-2029 ($ billion)
- Data Table on UK - Market size and forecast 2024-2029 ($ billion)
- Chart on UK - Year-over-year growth 2024-2029 (%)
- Data Table on UK - Year-over-year growth 2024-2029 (%)
- 13.14 France - Market size and forecast 2024-2029
- Chart on France - Market size and forecast 2024-2029 ($ billion)
- Data Table on France - Market size and forecast 2024-2029 ($ billion)
- Chart on France - Year-over-year growth 2024-2029 (%)
- Data Table on France - Year-over-year growth 2024-2029 (%)
- 13.15 Brazil - Market size and forecast 2024-2029
- Chart on Brazil - Market size and forecast 2024-2029 ($ billion)
- Data Table on Brazil - Market size and forecast 2024-2029 ($ billion)
- Chart on Brazil - Year-over-year growth 2024-2029 (%)
- Data Table on Brazil - Year-over-year growth 2024-2029 (%)
- 13.16 India - Market size and forecast 2024-2029
- Chart on India - Market size and forecast 2024-2029 ($ billion)
- Data Table on India - Market size and forecast 2024-2029 ($ billion)
- Chart on India - Year-over-year growth 2024-2029 (%)
- Data Table on India - Year-over-year growth 2024-2029 (%)
- 13.17 Australia - Market size and forecast 2024-2029
- Chart on Australia - Market size and forecast 2024-2029 ($ billion)
- Data Table on Australia - Market size and forecast 2024-2029 ($ billion)
- Chart on Australia - Year-over-year growth 2024-2029 (%)
- Data Table on Australia - Year-over-year growth 2024-2029 (%)
- 13.18 Market opportunity by geography
- Market opportunity by geography ($ billion)
- Data Tables on Market opportunity by geography ($ billion)
14 Drivers, Challenges, and Opportunity/Restraints
- 14.3 Impact of drivers and challenges
- Impact of drivers and challenges in 2024 and 2029
- 14.4 Market opportunities/restraints
15 Competitive Landscape
- 15.2 Competitive Landscape
- Overview on criticality of inputs and factors of differentiation
- 15.3 Landscape disruption
- Overview on factors of disruption
- 15.4 Industry risks
- Impact of key risks on business
16 Competitive Analysis
- 16.2 Company ranking index
- 16.3 Market positioning of companies
- Matrix on companies position and classification
- 16.4 Atkinson Candy Co.
- Atkinson Candy Co. - Overview
- Atkinson Candy Co. - Product / Service
- Atkinson Candy Co. - Key offerings
- SWOT
- 16.5 Chocoladefabriken Lindt and Sprungli AG
- Chocoladefabriken Lindt and Sprungli AG - Overview
- Chocoladefabriken Lindt and Sprungli AG - Business segments
- Chocoladefabriken Lindt and Sprungli AG - Key news
- Chocoladefabriken Lindt and Sprungli AG - Key offerings
- Chocoladefabriken Lindt and Sprungli AG - Segment focus
- SWOT
- 16.6 Flowers Foods Inc.
- Flowers Foods Inc. - Overview
- Flowers Foods Inc. - Product / Service
- Flowers Foods Inc. - Key news
- Flowers Foods Inc. - Key offerings
- SWOT
- 16.7 General Mills Inc.
- General Mills Inc. - Overview
- General Mills Inc. - Business segments
- General Mills Inc. - Key news
- General Mills Inc. - Key offerings
- General Mills Inc. - Segment focus
- SWOT
- 16.8 Gujarat Cooperative Milk Marketing Federation Ltd.
- Gujarat Cooperative Milk Marketing Federation Ltd. - Overview
- Gujarat Cooperative Milk Marketing Federation Ltd. - Product / Service
- Gujarat Cooperative Milk Marketing Federation Ltd. - Key offerings
- SWOT
- 16.9 Jones Soda Co.
- Jones Soda Co. - Overview
- Jones Soda Co. - Product / Service
- Jones Soda Co. - Key offerings
- SWOT
- 16.10 Kellogg Co.
- Kellogg Co. - Overview
- Kellogg Co. - Business segments
- Kellogg Co. - Key offerings
- Kellogg Co. - Segment focus
- SWOT
- 16.11 Keurig Dr Pepper Inc.
- Keurig Dr Pepper Inc. - Overview
- Keurig Dr Pepper Inc. - Business segments
- Keurig Dr Pepper Inc. - Key news
- Keurig Dr Pepper Inc. - Key offerings
- Keurig Dr Pepper Inc. - Segment focus
- SWOT
- 16.12 Monster Energy Co.
- Monster Energy Co. - Overview
- Monster Energy Co. - Product / Service
- Monster Energy Co. - Key offerings
- SWOT
- 16.13 Nestle SA
- Nestle SA - Overview
- Nestle SA - Business segments
- Nestle SA - Key news
- Nestle SA - Key offerings
- Nestle SA - Segment focus
- SWOT
- 16.14 PepsiCo Inc.
- PepsiCo Inc. - Overview
- PepsiCo Inc. - Business segments
- PepsiCo Inc. - Key news
- PepsiCo Inc. - Key offerings
- PepsiCo Inc. - Segment focus
- SWOT
- 16.15 Russell Stover Chocolates
- Russell Stover Chocolates - Overview
- Russell Stover Chocolates - Product / Service
- Russell Stover Chocolates - Key offerings
- SWOT
- 16.16 The Coca Cola Co.
- The Coca Cola Co. - Overview
- The Coca Cola Co. - Business segments
- The Coca Cola Co. - Key news
- The Coca Cola Co. - Key offerings
- The Coca Cola Co. - Segment focus
- SWOT
- 16.17 The Hershey Co.
- The Hershey Co. - Overview
- The Hershey Co. - Business segments
- The Hershey Co. - Key news
- The Hershey Co. - Key offerings
- The Hershey Co. - Segment focus
- SWOT
- 16.18 The Kraft Heinz Co.
- The Kraft Heinz Co. - Overview
- The Kraft Heinz Co. - Business segments
- The Kraft Heinz Co. - Key news
- The Kraft Heinz Co. - Key offerings
- The Kraft Heinz Co. - Segment focus
- SWOT
17 Appendix
- 17.2 Inclusions and exclusions checklist
- Inclusions checklist
- Exclusions checklist
- 17.3 Currency conversion rates for US$
- Currency conversion rates for US$
- 17.4 Research methodology
- 17.7 Validation techniques employed for market sizing
- Validation techniques employed for market sizing
- 17.9 360 degree market analysis
- 360 degree market analysis
- 17.10 List of abbreviations