Commercial Food Scales Market Analysis APAC, North America, Europe, South America, Middle East and Africa - US, Canada, China, Japan, India - Size and Forecast 2024-2028

Commercial Food Scales Market Analysis APAC, North America, Europe, South America, Middle East and Africa - US, Canada, China, Japan, India - Size and Forecast 2024-2028

Published: Nov 2023 146 Pages SKU: IRTNTR76735

Market Overview at a Glance

$129.26 Mn
Market Opportunity
3.82%
CAGR
3.33
YoY growth 2023-2024(%)

Commercial Food Scales Market Size 2024-2028 

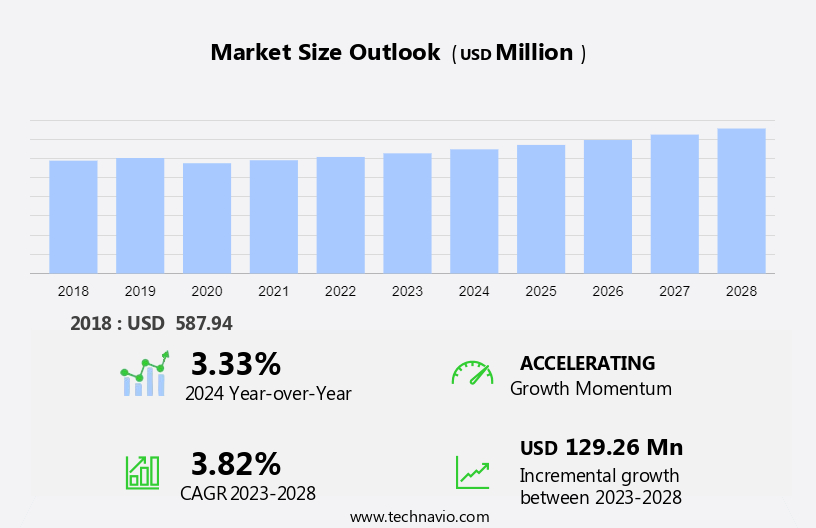
The commercial food scales market size is forecast to increase by USD 129.26 million at a CAGR of 3.82% between 2024 and 2028. The market is seeing steady growth due to several key factors. One of the main drivers is the affordability and practicality of food scales, which are helping consumers focus on healthier eating habits and managing their weight. The increasing number of commercial food establishments, including restaurants and food processing businesses, is also creating a need for accurate and efficient food measurement tools. As awareness of the importance of proper portion control grows for both health and business reasons demand for commercial food scales continues to increase, supporting the market's ongoing development.

Market Analysis

Commercial Food Scales Market Size

 Request Free Sample

Commercial food scales are vital tools in both home and professional kitchens for accurately measuring ingredients. Advances in technology have led to the rise of digital scales, which are increasingly replacing mechanical scales in various commercial settings. These digital scales can measure in ounces and grams, providing versatility for a wide range of recipes and volume measurements. The North American market for food scales has seen significant growth in output and shipments, driven by the rising demand for food service across multiple sectors.

Formal agreements between third-party food scale manufacturers and commercial kitchens help ensure a steady supply of high-quality scales for various processes, including preparation, serving, cleanup, consumption, and distribution. The storage and use of food ingredients are essential components of the food industry, and commercial food scales are critical for maintaining accuracy and efficiency in these operations. Digital scales provide several benefits, such as easy-to-read displays, quick tare functions, and calibration options, making them the preferred choice for many businesses in the commercial sector.

Market Segmentation

The market research report provides comprehensive data (region-wise segment analysis), with forecasts and estimates in "USD million" for the period 2024-2028, as well as historical data from 2018 - 2022 for the following segments.

  • Type
    • Mechanical
    • Digital
  • Distribution Channel
    • Offline
    • Online
  • Geography
    • APAC
      • China
      • India
      • Japan
    • North America
      • Canada
      • US
    • Europe
    • South America
    • Middle East and Africa

By Type Insights

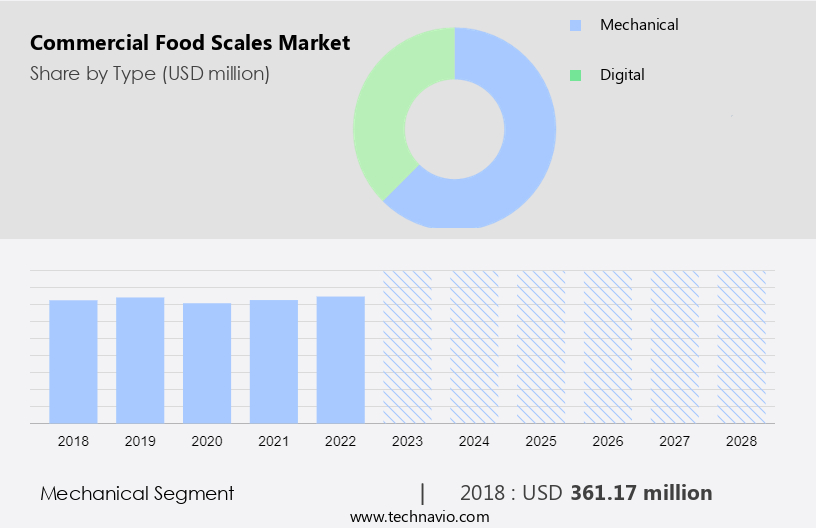
The mechanical segment is estimated to witness significant growth during the forecast period. Commercial Food Scales are essential tools in the food industry, with both Mechanical and Digital scales holding significant market shares. Mechanical scales, also known as analog scales, operate without power and are widely used in the Domestic Kitchen and Commercial Kitchen for measuring food ingredients in Ounces and Grams. These scales employ a spring and pointer mechanism, with each unit of weight causing the pointer to move a specific distance. In addition, a beam with counterweights is utilized in the Commercial sector to maintain balance during measurements. Technological developments have led to the emergence of Digital scales, which offer increased accuracy and ease of use.

These scales are prevalent in Food service establishments, including formal contract catering, third-party food providers, and food distribution companies. Digital scales facilitate seamless customer experiences by providing precise Volume measurements for recipes and food preparations, servings, cleanup, and consumption. The North American market for Commercial Food Scales has shown substantial Output/shipments, driven by Food Scale manufacturers catering to the needs of various industries, such as child care centers, restaurants, hotels, cafés, and online delivery options. Worldwide strategic partnerships and alliances between these manufacturers and key players in the food industry have contributed to the growth of the market. In the commercial sector, food scales are indispensable for measuring ingredients in food production, ensuring consistency and accuracy in recipes.

For instance, in the production of Chicken McNuggets, precise measurements are crucial to maintain the desired texture and taste. Quick-service restaurants and full-service restaurants alike rely on these scales for efficient food preparation and serving.

Commercial Food Scales Market Size

Get a glance at the market share of various segments Request Free Sample

The mechanical segment was valued at USD 361.17 million in 2018 and showed a gradual increase during the forecast period.

Regional Insights

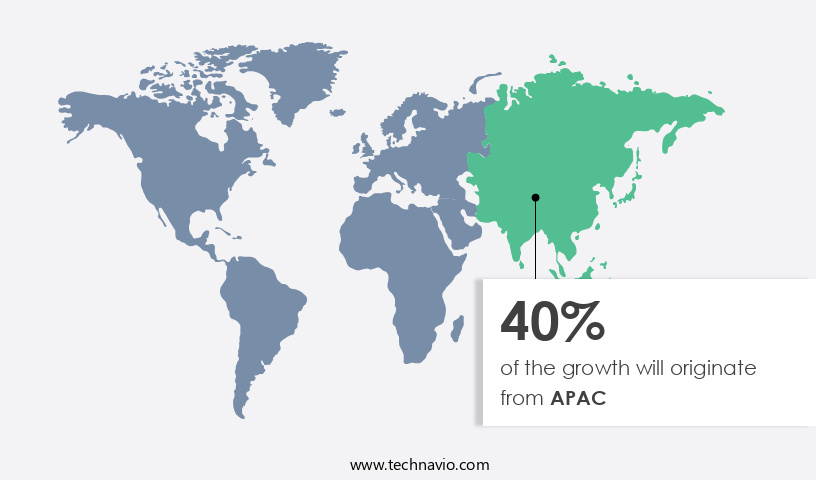
APAC is estimated to contribute 40% to the growth of the global market during the forecast period. Technavio's analysts have elaborately explained the regional trends and drivers that shape the market during the forecast period.

Commercial Food Scales Market Share by Geography

For more insights on the market share of various regions Request Free Sample

Commercial food scales play a pivotal role in various sectors of the food industry, from street sellers to fast food chains, specialty coffee shops, hotels and resorts, amusement parks, pubs, staff catering, health care, custodial services, welfare organizations, and more. These scales ensure consistency in recipes, adherence to legal requirements, nutrition labeling, and proper packaging. In the bustling world of street food, scales help companies maintain accurate measurements for their ingredients, ensuring a uniform taste and quality for their customers. Fast food chains and specialty coffee shops prioritize precision and efficiency, utilizing commercial food scales to maintain consistency in their offerings.

Hotels and resorts, amusement parks, and pubs rely on these scales to serve large quantities of food and beverages, ensuring portion control and maintaining high standards of service. In the realm of health care, custodial services, welfare organizations, and lunch and dinner services, commercial food scales are essential for maintaining nutritional accuracy and adherence to regulations. Furthermore, the integration of technology in the food industry, including computers and science and technology, has led to the development of advanced commercial food scales, enhancing their functionality and ease of use.

Market Dynamics

Our researchers analyzed the data with 2023 as the base year, along with the key drivers, trends, and challenges. A holistic analysis of drivers will help companies refine their marketing strategies to gain a competitive advantage.

Market Driver

Cost-effectiveness is a primary driver of the food scales market. Commercial food scales are indispensable tools in the food manufacturing and service industries, playing a crucial role in ensuring consistency in food quality and portion sizes. Recent technological advancements have led to the development of both mechanical and digital scales, which enhance precision and accuracy in kitchens, whether domestic or commercial. These scales enable the proper measurement of food ingredients in recipes, facilitating consistent preparation, serving, and cleanup.

In commercial settings, precise weighing is vital for output and shipments, as well as for fulfilling formal contracts with third parties. Commercial food scales come in various capacities, ranging from small kitchen scales to large industrial models, accommodating measurements in both ounces and grams.

These scales help minimize food waste and reduce financial losses, particularly in commercial food stores and childcare centers. The North American market for commercial food scales is substantial, driven by high demand from restaurants, hotels, cafés, and online delivery services. Global strategic partnerships between food scale manufacturers and food service establishments further enhance the customer experience.

Commercial scales are widely used throughout the food industry, from the preparation of Chicken McNuggets in quick-service restaurants to the complexities of formal contract catering in full-service establishments. In summary, commercial food scales are vital to the food industry, enabling precise measurements, consistent portion sizes, and reduced waste. Technological innovations have produced both mechanical and digital scales tailored to various industries and applications, from domestic kitchens to commercial enterprises.

Market Trends

The growing demand for innovative appliances in the food sector is an emerging trend in the market. Continuous advancements are being driven by technological developments and changing consumer preferences. Both mechanical and digital scales serve a variety of sectors, including domestic and commercial kitchens. These food scales are essential for accurately measuring ingredients, ensuring adherence to recipes and volume specifications.

In the North American market, the output and shipments of food scales have been on the rise, spurred by innovation from food scale manufacturers. Consumers are increasingly looking for eco-friendly and user-friendly appliances that operate efficiently and provide valuable insights. Commercial food scales play a crucial role in food service operations, from managing formal contracts with third parties to facilitating self-preparation, serving, cleanup, and the distribution of prepared foods.

These scales are vital in settings such as childcare centers, restaurants, hotels, cafés, and online delivery services. Strategic partnerships between food scale manufacturers and industry players globally ensure a seamless customer experience. Both full-service and quick-service restaurants depend on commercial food scales to maintain consistency and efficiency in their operations. For example, these scales are essential for the mass preparation and serving of items like Chicken McNuggets. Additionally, the rise of online food ordering is driving the demand for accurate and efficient food measurement solutions.

Market Challenge

The risk of counterfeiting in the commercial food scales market is a significant challenge impacting market growth. Recent technological advancements have resulted in the production of both mechanical and digital scales, serving various sectors, including domestic and commercial kitchens, as well as broader commercial enterprises. These scales, which measure in both ounces and grams, are crucial for food preparation, serving, and cleanup in diverse settings, including kitchens, food service establishments, childcare centers, restaurants, hotels, cafés, and online delivery options. They ensure accurate volume measurements for ingredients, adhering to recipes, and maintaining consistency in food production.

In the North American market, the output and shipments of food scales have experienced considerable growth, facilitated by formal contracts between food scale manufacturers and commercial entities. Additionally, third-party storage and distribution channels play a vital role in the market's expansion. The global food scales market covers a wide range of applications, from food service establishments to prepared foods and quick-service restaurants. Manufacturers prioritize seamless customer experiences, which has led to strategic partnerships and alliances worldwide to offer comprehensive solutions.

However, the presence of counterfeit food scales poses a serious risk to the market. Fraudsters often lure end-users with attractive prices for these fake products, which may not meet original specifications. This can result in inaccurate measurements and raise food safety concerns. Therefore, it is crucial for consumers and commercial enterprises to purchase food scales from reputable manufacturers to safeguard the integrity of their food preparation processes.

Exclusive Customer Landscape

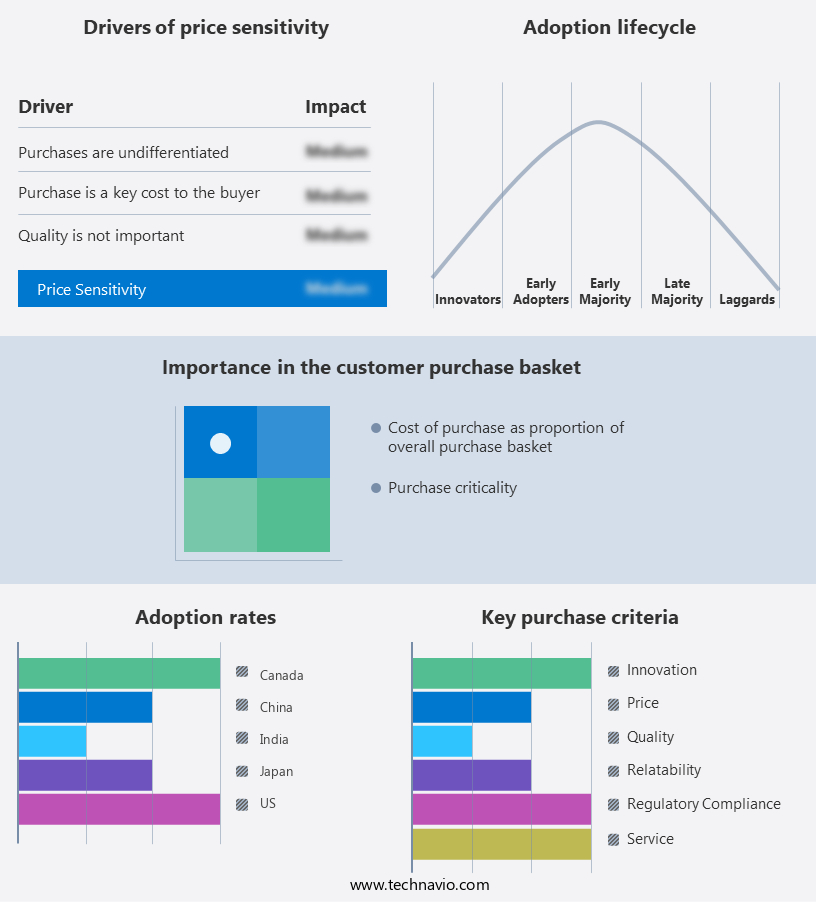
The market forecasting report includes the adoption lifecycle of the market, covering from the innovator's stage to the laggard's stage. It focuses on adoption rates in different regions based on penetration. Furthermore, the report also includes key purchase criteria and drivers of price sensitivity to help companies evaluate and develop their market growth analysis strategies.

Commercial Food Scales Market Share by Geography

 Customer Landscape

Key Companies & Market Insights

Companies are implementing various strategies, such as strategic alliances, partnerships, mergers and acquisitions, geographical expansion, and product/service launches, to enhance their presence in the market.

A and D HOLON Holdings Co. Ltd. - A diverse range of precision measuring devices is available. These scales cater to various industries and applications, ensuring accuracy and reliability. Among the offerings are dust and waterproof digital scales, designed for use in harsh environments.

The market research and growth report includes detailed analyses of the competitive landscape of the market and information about key companies, including:

  • Ali Group S.r.l. a Socio Unico
  • American Chemical Society
  • AMETEK Inc.
  • Bizerba SE and Co. KG
  • Cardinal Scale
  • Doran Scales Inc
  • Essae Teraoka Pvt. Ltd.
  • Globe Food Equipment Co.
  • Hobart Corp.
  • Ishida Co. Ltd.
  • OXO International Ltd.
  • Precision Electronic Instruments Co.
  • Thermor Ltd.
  • Vetta Macchi srl
  • W. W. Wedderburn Pty Ltd.
  • Yamato Scale GmbH
  • Camry Scale Store
  • Lifetime Brands Inc.
  • TScale Electronics Mfg Co. Ltd.

Qualitative and quantitative analysis of companies has been conducted to help clients understand the wider business environment as well as the strengths and weaknesses of key market players. Data is qualitatively analyzed to categorize companies as pure play, category-focused, industry-focused, and diversified; it is quantitatively analyzed to categorize companies as dominant, leading, strong, tentative, and weak.

Research Analyst Overview

The market is a significant sector in the food industry, catering to the demand for accurate and efficient weight measurement solutions. Commercial food scales are essential tools for food processing, packaging, and retail industries to ensure consistent product quality and portion control. These scales come in various types, including bench scales, floor scales, and counting scales, each designed to meet specific industry requirements. The market for commercial food scales is driven by the increasing demand for automation and technology integration in food processing and packaging industries. The need for precise weight measurement to maintain product consistency and ensure regulatory compliance is another key factor fueling market growth.

Additionally, the growing trend towards ready-to-eat and convenience food products is expected to boost the demand for commercial food scales in the retail sector. Manufacturers are focusing on developing advanced features such as wireless connectivity, data logging, and integration with other food processing equipment to enhance the functionality and convenience of commercial food scales. The market is also witnessing intense competition, with several players offering a wide range of products to cater to diverse industry needs. Overall, the market is expected to grow steadily in the coming years, driven by the increasing demand for automation and precision in the food industry.

Market Scope

Report Coverage

Details

Page number

146

Base year

2023

Historic period

2018-2022

Forecast period

2024-2028

Growth momentum & CAGR

Accelerate at a CAGR of 3.82%

Market growth 2024-2028

USD 129.26 million

Market structure

Fragmented

YoY growth 2023-2024(%)

3.33

Regional analysis

APAC, North America, Europe, South America, and Middle East and Africa

Performing market contribution

APAC at 40%

Key countries

US, Canada, China, Japan, and India

Competitive landscape

Leading Companies, Market Positioning of Companies, Competitive Strategies, and Industry Risks

Key companies profiled

A and D HOLON Holdings Co. Ltd., Ali Group S.r.l. a Socio Unico, American Chemical Society, AMETEK Inc., Bizerba SE and Co. KG, Cardinal Scale, Doran Scales Inc, Essae Teraoka Pvt. Ltd., Globe Food Equipment Co., Hobart Corp., Ishida Co. Ltd., OXO International Ltd., Precision Electronic Instruments Co., Thermor Ltd., Vetta Macchi srl, W. W. Wedderburn Pty Ltd., Yamato Scale GmbH, Camry Scale Store, Lifetime Brands Inc., and TScale Electronics Mfg Co. Ltd.

Market dynamics

Parent market analysis, market growth inducers and obstacles, market forecast, fast-growing and slow-growing segment analysis, COVID-19 impact and recovery analysis and future consumer dynamics, market condition analysis for the forecast period

Customization purview

If our market report has not included the data that you are looking for, you can reach out to our analysts and get segments customized.

Request Free Sample

What are the Key Data Covered in this Market Research and Growth Report?

  • CAGR of the market during the forecast period
  • Detailed information on factors that will drive the market growth and forecasting between 2024 and 2028
  • Precise estimation of the size of the market  and its contribution of the market in focus to the parent market
  • Accurate predictions about upcoming market growth and trends and changes in consumer behaviour
  • Growth of the market across APAC, North America, Europe, South America, and Middle East and Africa
  • Thorough analysis of the market's competitive landscape and detailed information about companies
  • Comprehensive analysis of factors that will challenge the growth of market companies

We can help! Our analysts can customize this market research report to meet your requirements. Get in touch

1 Executive Summary

  • 1.1 Market overview
    • Exhibit 01: Executive Summary – Chart on Market Overview
    • Exhibit 02: Executive Summary – Data Table on Market Overview
    • Exhibit 03: Executive Summary – Chart on Global Market Characteristics
    • Exhibit 04: Executive Summary – Chart on Market by Geography
    • Exhibit 05: Executive Summary – Chart on Market Segmentation by Type
    • Exhibit 06: Executive Summary – Chart on Market Segmentation by Distribution Channel
    • Exhibit 07: Executive Summary – Chart on Incremental Growth
    • Exhibit 08: Executive Summary – Data Table on Incremental Growth
    • Exhibit 09: Executive Summary – Chart on Vendor Market Positioning

2 Market Landscape

  • 2.1 Market ecosystem
    • Exhibit 10: Parent market
    • Exhibit 11: Market Characteristics

3 Market Sizing

  • 3.1 Market definition
    • Exhibit 12: Offerings of vendors included in the market definition
  • 3.2 Market segment analysis
    • Exhibit 13: Market segments
  • 3.3 Market size 2023
    • 3.4 Market outlook: Forecast for 2023-2028
      • Exhibit 14: Chart on Global - Market size and forecast 2023-2028 ($ million)
      • Exhibit 15: Data Table on Global - Market size and forecast 2023-2028 ($ million)
      • Exhibit 16: Chart on Global Market: Year-over-year growth 2023-2028 (%)
      • Exhibit 17: Data Table on Global Market: Year-over-year growth 2023-2028 (%)

    4 Historic Market Size

    • 4.1 Global commercial food scales market 2018 - 2022
      • Exhibit 18: Historic Market Size – Data Table on global commercial food scales market 2018 - 2022 ($ million)
    • 4.2 Type Segment Analysis 2018 - 2022
      • Exhibit 19: Historic Market Size – Type Segment 2018 - 2022 ($ million)
    • 4.3 Distribution Channel Segment Analysis 2018 - 2022
      • Exhibit 20: Historic Market Size – Distribution Channel Segment 2018 - 2022 ($ million)
    • 4.4 Geography Segment Analysis 2018 - 2022
      • Exhibit 21: Historic Market Size – Geography Segment 2018 - 2022 ($ million)
    • 4.5 Country Segment Analysis 2018 - 2022
      • Exhibit 22: Historic Market Size – Country Segment 2018 - 2022 ($ million)

    5 Five Forces Analysis

    • 5.1 Five forces summary
      • Exhibit 23: Five forces analysis - Comparison between 2023 and 2028
    • 5.2 Bargaining power of buyers
      • Exhibit 24: Chart on Bargaining power of buyers – Impact of key factors 2023 and 2028
    • 5.3 Bargaining power of suppliers
      • Exhibit 25: Bargaining power of suppliers – Impact of key factors in 2023 and 2028
    • 5.4 Threat of new entrants
      • Exhibit 26: Threat of new entrants – Impact of key factors in 2023 and 2028
    • 5.5 Threat of substitutes
      • Exhibit 27: Threat of substitutes – Impact of key factors in 2023 and 2028
    • 5.6 Threat of rivalry
      • Exhibit 28: Threat of rivalry – Impact of key factors in 2023 and 2028
    • 5.7 Market condition
      • Exhibit 29: Chart on Market condition - Five forces 2023 and 2028

    6 Market Segmentation by Type

    • 6.1 Market segments
      • Exhibit 30: Chart on Type - Market share 2023-2028 (%)
      • Exhibit 31: Data Table on Type - Market share 2023-2028 (%)
    • 6.2 Comparison by Type
      • Exhibit 32: Chart on Comparison by Type
      • Exhibit 33: Data Table on Comparison by Type
    • 6.3 Mechanical - Market size and forecast 2023-2028
      • Exhibit 34: Chart on Mechanical - Market size and forecast 2023-2028 ($ million)
      • Exhibit 35: Data Table on Mechanical - Market size and forecast 2023-2028 ($ million)
      • Exhibit 36: Chart on Mechanical - Year-over-year growth 2023-2028 (%)
      • Exhibit 37: Data Table on Mechanical - Year-over-year growth 2023-2028 (%)
    • 6.4 Digital - Market size and forecast 2023-2028
      • Exhibit 38: Chart on Digital - Market size and forecast 2023-2028 ($ million)
      • Exhibit 39: Data Table on Digital - Market size and forecast 2023-2028 ($ million)
      • Exhibit 40: Chart on Digital - Year-over-year growth 2023-2028 (%)
      • Exhibit 41: Data Table on Digital - Year-over-year growth 2023-2028 (%)
    • 6.5 Market opportunity by Type
      • Exhibit 42: Market opportunity by Type ($ million)
      • Exhibit 43: Data Table on Market opportunity by Type ($ million)

    7 Market Segmentation by Distribution Channel

    • 7.1 Market segments
      • Exhibit 44: Chart on Distribution Channel - Market share 2023-2028 (%)
      • Exhibit 45: Data Table on Distribution Channel - Market share 2023-2028 (%)
    • 7.2 Comparison by Distribution Channel
      • Exhibit 46: Chart on Comparison by Distribution Channel
      • Exhibit 47: Data Table on Comparison by Distribution Channel
    • 7.3 Offline - Market size and forecast 2023-2028
      • Exhibit 48: Chart on Offline - Market size and forecast 2023-2028 ($ million)
      • Exhibit 49: Data Table on Offline - Market size and forecast 2023-2028 ($ million)
      • Exhibit 50: Chart on Offline - Year-over-year growth 2023-2028 (%)
      • Exhibit 51: Data Table on Offline - Year-over-year growth 2023-2028 (%)
    • 7.4 Online - Market size and forecast 2023-2028
      • Exhibit 52: Chart on Online - Market size and forecast 2023-2028 ($ million)
      • Exhibit 53: Data Table on Online - Market size and forecast 2023-2028 ($ million)
      • Exhibit 54: Chart on Online - Year-over-year growth 2023-2028 (%)
      • Exhibit 55: Data Table on Online - Year-over-year growth 2023-2028 (%)
    • 7.5 Market opportunity by Distribution Channel
      • Exhibit 56: Market opportunity by Distribution Channel ($ million)
      • Exhibit 57: Data Table on Market opportunity by Distribution Channel ($ million)

    8 Customer Landscape

    • 8.1 Customer landscape overview
      • Exhibit 58: Analysis of price sensitivity, lifecycle, customer purchase basket, adoption rates, and purchase criteria

    9 Geographic Landscape

    • 9.1 Geographic segmentation
      • Exhibit 59: Chart on Market share by geography 2023-2028 (%)
      • Exhibit 60: Data Table on Market share by geography 2023-2028 (%)
    • 9.2 Geographic comparison
      • Exhibit 61: Chart on Geographic comparison
      • Exhibit 62: Data Table on Geographic comparison
    • 9.3 APAC - Market size and forecast 2023-2028
      • Exhibit 63: Chart on APAC - Market size and forecast 2023-2028 ($ million)
      • Exhibit 64: Data Table on APAC - Market size and forecast 2023-2028 ($ million)
      • Exhibit 65: Chart on APAC - Year-over-year growth 2023-2028 (%)
      • Exhibit 66: Data Table on APAC - Year-over-year growth 2023-2028 (%)
    • 9.4 North America - Market size and forecast 2023-2028
      • Exhibit 67: Chart on North America - Market size and forecast 2023-2028 ($ million)
      • Exhibit 68: Data Table on North America - Market size and forecast 2023-2028 ($ million)
      • Exhibit 69: Chart on North America - Year-over-year growth 2023-2028 (%)
      • Exhibit 70: Data Table on North America - Year-over-year growth 2023-2028 (%)
    • 9.5 Europe - Market size and forecast 2023-2028
      • Exhibit 71: Chart on Europe - Market size and forecast 2023-2028 ($ million)
      • Exhibit 72: Data Table on Europe - Market size and forecast 2023-2028 ($ million)
      • Exhibit 73: Chart on Europe - Year-over-year growth 2023-2028 (%)
      • Exhibit 74: Data Table on Europe - Year-over-year growth 2023-2028 (%)
    • 9.6 South America - Market size and forecast 2023-2028
      • Exhibit 75: Chart on South America - Market size and forecast 2023-2028 ($ million)
      • Exhibit 76: Data Table on South America - Market size and forecast 2023-2028 ($ million)
      • Exhibit 77: Chart on South America - Year-over-year growth 2023-2028 (%)
      • Exhibit 78: Data Table on South America - Year-over-year growth 2023-2028 (%)
    • 9.7 Middle East and Africa - Market size and forecast 2023-2028
      • Exhibit 79: Chart on Middle East and Africa - Market size and forecast 2023-2028 ($ million)
      • Exhibit 80: Data Table on Middle East and Africa - Market size and forecast 2023-2028 ($ million)
      • Exhibit 81: Chart on Middle East and Africa - Year-over-year growth 2023-2028 (%)
      • Exhibit 82: Data Table on Middle East and Africa - Year-over-year growth 2023-2028 (%)
    • 9.8 US - Market size and forecast 2023-2028
      • Exhibit 83: Chart on US - Market size and forecast 2023-2028 ($ million)
      • Exhibit 84: Data Table on US - Market size and forecast 2023-2028 ($ million)
      • Exhibit 85: Chart on US - Year-over-year growth 2023-2028 (%)
      • Exhibit 86: Data Table on US - Year-over-year growth 2023-2028 (%)
    • 9.9 China - Market size and forecast 2023-2028
      • Exhibit 87: Chart on China - Market size and forecast 2023-2028 ($ million)
      • Exhibit 88: Data Table on China - Market size and forecast 2023-2028 ($ million)
      • Exhibit 89: Chart on China - Year-over-year growth 2023-2028 (%)
      • Exhibit 90: Data Table on China - Year-over-year growth 2023-2028 (%)
    • 9.10 Japan - Market size and forecast 2023-2028
      • Exhibit 91: Chart on Japan - Market size and forecast 2023-2028 ($ million)
      • Exhibit 92: Data Table on Japan - Market size and forecast 2023-2028 ($ million)
      • Exhibit 93: Chart on Japan - Year-over-year growth 2023-2028 (%)
      • Exhibit 94: Data Table on Japan - Year-over-year growth 2023-2028 (%)
    • 9.11 India - Market size and forecast 2023-2028
      • Exhibit 95: Chart on India - Market size and forecast 2023-2028 ($ million)
      • Exhibit 96: Data Table on India - Market size and forecast 2023-2028 ($ million)
      • Exhibit 97: Chart on India - Year-over-year growth 2023-2028 (%)
      • Exhibit 98: Data Table on India - Year-over-year growth 2023-2028 (%)
    • 9.12 Canada - Market size and forecast 2023-2028
      • Exhibit 99: Chart on Canada - Market size and forecast 2023-2028 ($ million)
      • Exhibit 100: Data Table on Canada - Market size and forecast 2023-2028 ($ million)
      • Exhibit 101: Chart on Canada - Year-over-year growth 2023-2028 (%)
      • Exhibit 102: Data Table on Canada - Year-over-year growth 2023-2028 (%)
    • 9.13 Market opportunity by geography
      • Exhibit 103: Market opportunity by geography ($ million)
      • Exhibit 104: Data Tables on Market opportunity by geography ($ million)

    10 Drivers, Challenges, and Trends

    • 10.1 Market drivers
      • 10.2 Market challenges
        • 10.3 Impact of drivers and challenges
          • Exhibit 105: Impact of drivers and challenges in 2023 and 2028
        • 10.4 Market trends

          11 Vendor Landscape

          • 11.1 Overview
            • 11.2 Vendor landscape
              • Exhibit 106: Overview on Criticality of inputs and Factors of differentiation
            • 11.3 Landscape disruption
              • Exhibit 107: Overview on factors of disruption
            • 11.4 Industry risks
              • Exhibit 108: Impact of key risks on business

            12 Vendor Analysis

            • 12.1 Vendors covered
              • Exhibit 109: Vendors covered
            • 12.2 Market positioning of vendors
              • Exhibit 110: Matrix on vendor position and classification
            • 12.3 A and D HOLON Holdings Co. Ltd.
              • Exhibit 111: A and D HOLON Holdings Co. Ltd. - Overview
              • Exhibit 112: A and D HOLON Holdings Co. Ltd. - Business segments
              • Exhibit 113: A and D HOLON Holdings Co. Ltd. - Key offerings
              • Exhibit 114: A and D HOLON Holdings Co. Ltd. - Segment focus
            • 12.4 Ali Group S.r.l. a Socio Unico
              • Exhibit 115: Ali Group S.r.l. a Socio Unico - Overview
              • Exhibit 116: Ali Group S.r.l. a Socio Unico - Product / Service
              • Exhibit 117: Ali Group S.r.l. a Socio Unico - Key news
              • Exhibit 118: Ali Group S.r.l. a Socio Unico - Key offerings
            • 12.5 American Chemical Society
              • Exhibit 119: American Chemical Society - Overview
              • Exhibit 120: American Chemical Society - Product / Service
              • Exhibit 121: American Chemical Society - Key offerings
            • 12.6 AMETEK Inc.
              • Exhibit 122: AMETEK Inc. - Overview
              • Exhibit 123: AMETEK Inc. - Business segments
              • Exhibit 124: AMETEK Inc. - Key offerings
              • Exhibit 125: AMETEK Inc. - Segment focus
            • 12.7 Bizerba SE and Co. KG
              • Exhibit 126: Bizerba SE and Co. KG - Overview
              • Exhibit 127: Bizerba SE and Co. KG - Product / Service
              • Exhibit 128: Bizerba SE and Co. KG - Key offerings
            • 12.8 Camry Scale Store
              • Exhibit 129: Camry Scale Store - Overview
              • Exhibit 130: Camry Scale Store - Product / Service
              • Exhibit 131: Camry Scale Store - Key offerings
            • 12.9 Cardinal Scale
              • Exhibit 132: Cardinal Scale - Overview
              • Exhibit 133: Cardinal Scale - Product / Service
              • Exhibit 134: Cardinal Scale - Key offerings
            • 12.10 Doran Scales Inc
              • Exhibit 135: Doran Scales Inc - Overview
              • Exhibit 136: Doran Scales Inc - Product / Service
              • Exhibit 137: Doran Scales Inc - Key offerings
            • 12.11 Essae Teraoka Pvt. Ltd.
              • Exhibit 138: Essae Teraoka Pvt. Ltd. - Overview
              • Exhibit 139: Essae Teraoka Pvt. Ltd. - Product / Service
              • Exhibit 140: Essae Teraoka Pvt. Ltd. - Key offerings
            • 12.12 Globe Food Equipment Co.
              • Exhibit 141: Globe Food Equipment Co. - Overview
              • Exhibit 142: Globe Food Equipment Co. - Product / Service
              • Exhibit 143: Globe Food Equipment Co. - Key offerings
            • 12.13 Hobart Corp.
              • Exhibit 144: Hobart Corp. - Overview
              • Exhibit 145: Hobart Corp. - Product / Service
              • Exhibit 146: Hobart Corp. - Key offerings
            • 12.14 OXO International Ltd.
              • Exhibit 147: OXO International Ltd. - Overview
              • Exhibit 148: OXO International Ltd. - Product / Service
              • Exhibit 149: OXO International Ltd. - Key offerings
            • 12.15 Precision Electronic Instruments Co.
              • Exhibit 150: Precision Electronic Instruments Co. - Overview
              • Exhibit 151: Precision Electronic Instruments Co. - Product / Service
              • Exhibit 152: Precision Electronic Instruments Co. - Key offerings
            • 12.16 Thermor Ltd.
              • Exhibit 153: Thermor Ltd. - Overview
              • Exhibit 154: Thermor Ltd. - Product / Service
              • Exhibit 155: Thermor Ltd. - Key offerings
            • 12.17 TScale Electronics Mfg Co. Ltd.
              • Exhibit 156: TScale Electronics Mfg Co. Ltd. - Overview
              • Exhibit 157: TScale Electronics Mfg Co. Ltd. - Product / Service
              • Exhibit 158: TScale Electronics Mfg Co. Ltd. - Key offerings

            13 Appendix

            • 13.1 Scope of the report
              • 13.2 Inclusions and exclusions checklist
                • Exhibit 159: Inclusions checklist
                • Exhibit 160: Exclusions checklist
              • 13.3 Currency conversion rates for US$
                • Exhibit 161: Currency conversion rates for US$
              • 13.4 Research methodology
                • Exhibit 162: Research methodology
                • Exhibit 163: Validation techniques employed for market sizing
                • Exhibit 164: Information sources
              • 13.5 List of abbreviations
                • Exhibit 165: List of abbreviations

              Research Methodology

              Technavio presents a detailed picture of the market by way of study, synthesis, and summation of data from multiple sources. The analysts have presented the various facets of the market with a particular focus on identifying the key industry influencers. The data thus presented is comprehensive, reliable, and the result of extensive research, both primary and secondary.

              INFORMATION SOURCES

              Primary sources

              • Manufacturers and suppliers
              • Channel partners
              • Industry experts
              • Strategic decision makers

              Secondary sources

              • Industry journals and periodicals
              • Government data
              • Financial reports of key industry players
              • Historical data
              • Press releases

              DATA ANALYSIS

              Data Synthesis

              • Collation of data
              • Estimation of key figures
              • Analysis of derived insights

              Data Validation

              • Triangulation with data models
              • Reference against proprietary databases
              • Corroboration with industry experts

              REPORT WRITING

              Qualitative

              • Market drivers
              • Market challenges
              • Market trends
              • Five forces analysis

              Quantitative

              • Market size and forecast
              • Market segmentation
              • Geographical insights
              • Competitive landscape

              Interested in this report?

              Get your sample now to see our research methodology and insights!

              Download Now

              Frequently Asked Questions

              Commercial Food Scales market growth will increase by $ 129.26 mn during 2024-2028 .

              The Commercial Food Scales market is expected to grow at a CAGR of 3.82% during 2024-2028 .

              Commercial Food Scales market is segmented by Type( Mechanical, Digital) Distribution Channel( Offline, Online)

              A and D HOLON Holdings Co. Ltd., Ali Group S.r.l. a Socio Unico, American Chemical Society, AMETEK Inc., Bizerba SE and Co. KG, Cardinal Scale, Doran Scales Inc, Essae Teraoka Pvt. Ltd., Globe Food Equipment Co., Hobart Corp., Ishida Co. Ltd., OXO International Ltd., Precision Electronic Instruments Co., Thermor Ltd., Vetta Macchi srl, W. W. Wedderburn Pty Ltd., Yamato Scale GmbH, Camry Scale Store, Lifetime Brands Inc., TScale Electronics Mfg Co. Ltd. are a few of the key vendors in the Commercial Food Scales market.

              APAC will register the highest growth rate of 40% among the other regions. Therefore, the Commercial Food Scales market in APAC is expected to garner significant business opportunities for the vendors during the forecast period.

              US, Canada, China, Japan, India

              • Cost-effectiveness of food scalesSuccess in any industry requires consistency is the driving factor this market.
              • particularly in the food manufacturing industry. High-quality food products must be produced consistently in order to gain credibility. The food quality will be significantly impacted by the weight of the ingredients used. In addition to guaranteeing consistency in the flavor and quality of products is the driving factor this market.
              • scaling assists in controlling portion sizes for a fair distribution of food or meals and prevents waste. Also is the driving factor this market.
              • commercial scales are far more accurate than measuring with cups and jugs in commercial establishments such as restaurants. Scales for weighing can aid in minimizing food waste. There may be significant waste or financial losses if commercial food stores do not employ precise weighing scales. Commercial food scales will help the commercial food sector to keep within budget and guarantee that they are packaging or serving the right amount of food. It feasible to serve or package more food than they want to without weighing scales is the driving factor this market.
              • which would raise overall expenses and have an effect on revenues. Thus is the driving factor this market.
              • the cost-effectiveness of food scales is expected to fuel the growth of the global commercial food scales market during the forecast period. is the driving factor this market.

              The Commercial Food Scales market vendors should focus on grabbing business opportunities from the Mechanical segment as it accounted for the largest market share in the base year.