Commercial Griddle Market Size 2025-2029
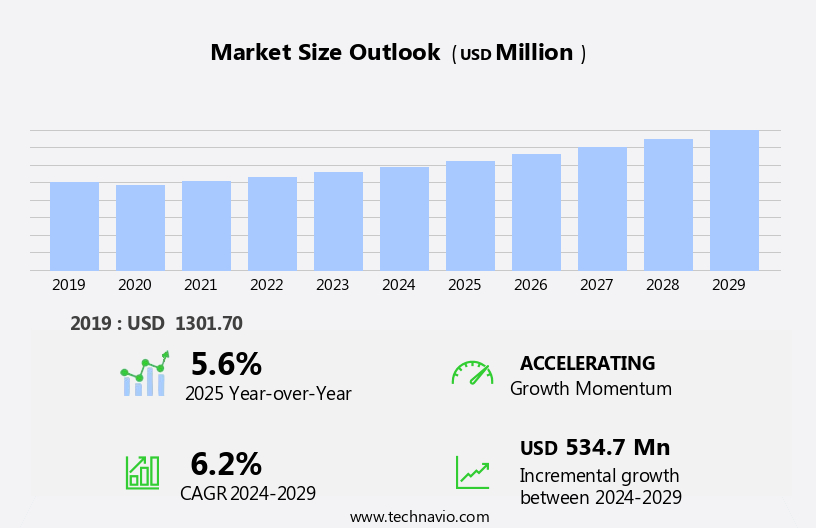
The commercial griddle market size is forecast to increase by USD 534.7 million at a CAGR of 6.2% between 2024 and 2029.
- The market is witnessing significant growth due to the increasing focus on enhancing production efficiency in commercial kitchens. This trend is driving the demand for advanced commercial griddles that offer faster cooking times and improved temperature control. Another key trend is the growing preference for ENERGY STAR-certified commercial griddles, which help kitchens reduce energy consumption and save on operational costs. Automation in commercial griddle processes also includes machine learning algorithms for data evaluation and artificial intelligence for data integration. Additionally, the demand for pre-used commercial griddles is on the rise due to their affordability and availability in the market. These trends are shaping the growth of the market and are expected to continue influencing market dynamics in the coming years.
What will be the Size of the Commercial Griddle Market During the Forecast Period?
- In the dynamic and evolving landscape of the markets, automated technologies have emerged as a game-changer, revolutionizing processes and streamlining repetitive tasks. These advanced systems are particularly valuable in laboratory settings, where complex workflows and intricate processes are essential for sample preparation, library construction, and liquid handling. Automation benefits lab technicians and scientists by reducing manual intervention, increasing throughput, and enhancing efficiency and quality. Automated processes enable the handling of large volumes of samples with minimal human intervention, ensuring reproducibility, data accuracy, traceability, and safety. However, the implementation of automated technologies also presents challenges, such as handler-induced variability, contamination, and experimental data capture.
- Moreover, to mitigate these issues, machine learning algorithms and data evaluation techniques are increasingly being employed to optimize automated processes and improve overall performance. Clinical laboratories are at the forefront of adopting automated systems, recognizing the need for increased efficiency, accuracy, and safety in their operations. Despite the initial investment, the long-term benefits of automation far outweigh the costs, enabling labs to meet the growing demands of their clients and stay competitive in the market. In conclusion, the integration of automated technologies in the markets offers numerous advantages, including increased throughput, enhanced efficiency, and improved data accuracy and traceability.
How is this market segmented and which is the largest segment?
The market research report provides comprehensive data (region-wise segment analysis), with forecasts and estimates in "USD million" for the period 2025-2029, as well as historical data from 2019-2023 for the following segments.
- Product
- Gas griddle
- Electric griddle
- Type
- Countertop griddle
- Floor-standing griddle
- Geography
- North America
- Canada
- US
- Europe
- Germany
- UK
- France
- Italy
- Spain
- APAC
- China
- India
- Japan
- South America
- Middle East and Africa
- North America
By Product Insights
- The gas griddle segment is estimated to witness significant growth during the forecast period.
Commercial electric griddles feature a heating element located beneath the griddle plate, enabling food to be cooked evenly through heat transfer from the plate. Thicker griddle plates offer increased durability, as they can withstand continuous heating and cooling cycles. This durability results in even heating and the ability to maintain food temperature for extended periods, allowing for higher food production capacity compared to thinner griddle plates. Ensuring quality and consistency, these griddles prioritize resources and manpower efficiency while maintaining sample preparation, reproducibility, data accuracy, traceability, and safety standards.
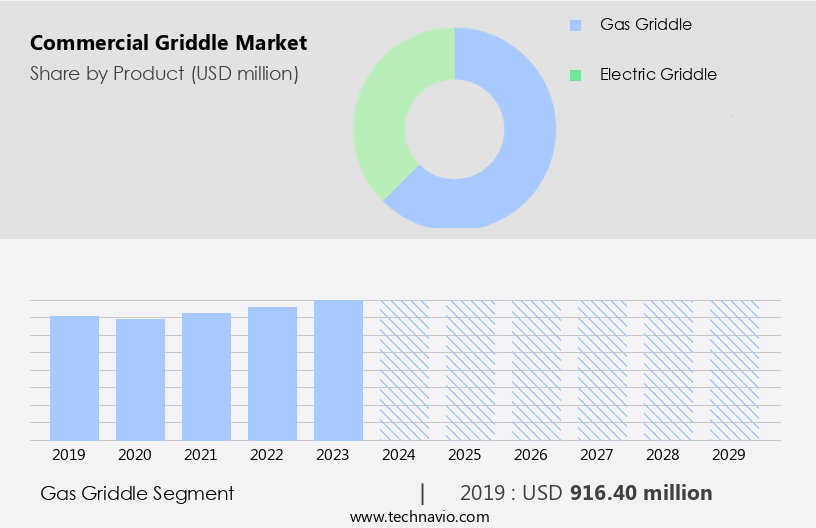
Get a glance at the market report of share of various segments Request Free Sample
The gas griddle segment was valued at USD 916.40 million in 2019 and showed a gradual increase during the forecast period.
Regional Analysis
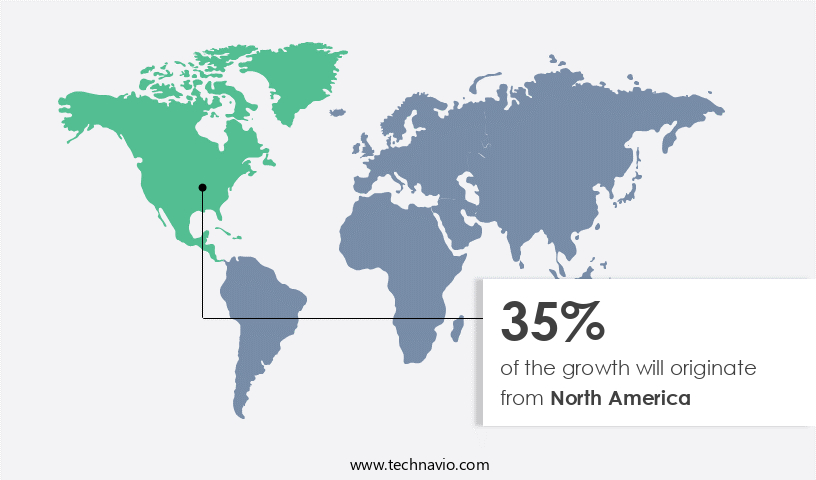
- North America is estimated to contribute 35% to the growth of the global market during the forecast period.
Technavio's analysts have elaborately explained the regional trends and drivers that shape the market during the forecast period.
For more insights on the market share of various regions, Request Free Sample
The market in North America is experiencing growth due to the availability of advanced technology in commercial griddles and the increasing demand for quick food production. ENERGY STAR-certified griddles and technologically advanced models with pre-programmed menu options, digital controls, and touchscreens are gaining popularity among food service establishments. These features enable operators to speed up production and save time, leading to increased consumer capacity. Additionally, dual-sided floor-standing griddles offer a 50% reduction in cooking times, further enhancing production capabilities. companies in the region are focusing on improving control options to meet the demands of food service establishments.
Market Dynamics
Our commercial griddle market researchers analyzed the data with 2024 as the base year, along with the key drivers, trends, and challenges. A holistic analysis of drivers will help companies refine their marketing strategies to gain a competitive advantage.
What are the key market drivers leading to the rise in adoption of Commercial Griddle Market?
Growing focus on enhancing production efficiency in commercial kitchens is the key driver of the market.
- Commercial griddles are essential equipment for food service establishments seeking high-volume food production with consistent quality. These griddles offer even heating across their surface, ensuring uniform cooking of various food products. Commercial griddles come in various capacities, catering to the needs of both small and large food establishments. For instance, heavy-duty commercial griddles, such as those offered by Garland Group, can prepare up to 300 hamburgers per hour. The cooking surface of these griddles is typically made of cast iron or stainless steel, which retains heat and quickly reheats, ensuring efficient food preparation. Automated technologies are increasingly being integrated into commercial griddle processes to enhance efficiency, quality, and throughput.
- In addition, automated library preparation, liquid handling, and sample preparation workflows help reduce manpower requirements, repetitive strain injury risks, and handler-induced variability. Automation benefits include improved data accuracy, traceability, safety, and data provenance. Automated processes also reduce contamination risks, enabling laboratories to maintain metrological traceability and chain of custody. These advanced automation solutions enable laboratories to operate efficiently, run reports, and increase productivity with less staff. Individualized solutions offer modular and connectivity options, enabling small and mega labs to enhance optimization while maintaining intense pressure to operate efficiently.
What are the market trends shaping the Commercial Griddle Market?
Growing preference for ENERGY STAR-certified commercial griddles is the upcoming trend in the market.
- Commercial griddles are essential equipment in foodservice establishments, providing increased production efficiency with minimal operating costs. Manufacturers cater to this demand by offering energy-saving features on their commercial griddles to boost profitability. Brands like Vulcan (Illinois Tool Works Inc.), Garland Group (Illinois Tool Works Inc.), and MagiKitchn (The Middleby Corp.) provide ENERGY STAR-certified commercial griddles. AccuTemp Products offers EGF series commercial electric griddles and GGF and PGF series commercial gas griddles, all ENERGY STAR certified. Garland Group supplies both single-sided and double-sided commercial griddles with ENERGY STAR certification. Automated technologies play a significant role in enhancing the functionality and efficiency of commercial griddles.
- Moreover, automated processes, such as library preparation, liquid handling, and sample preparation, ensure reproducibility, data accuracy, traceability, and safety. These benefits reduce manpower requirements, minimize human work, and decrease the risk of contamination and mislabelling. Advanced automation, including machine learning, data evaluation, and data integration, streamlines workflows, reduces turnaround time, and increases throughput. Laboratory robotics and centrifugation further optimize laboratory processes, allowing for 24/7 operation and handling dangerous chemicals with minimal risk. Small and mega labs alike benefit from commercial griddle automation, as it enhances optimization, connectivity options, and productivity. Partial and workflow automation enable individualized solutions for diagnostics, while advanced automation offers modular options for customization.
What challenges does Commercial Griddle Market face during the growth?
Growing demand for pre-used commercial griddles is a key challenge affecting the market growth.
- Commercial griddles are essential equipment in the foodservice industry, and both new and pre-used models are popular among restaurant owners. Pre-used commercial griddles offer a cost-effective solution for small and medium foodservice establishments, particularly in developing countries, allowing them to minimize initial investments. For instance, a pre-used commercial electric griddle from Garland Group can be purchased for approximately USD 2,200, compared to the new unit's price of around USD 6,200. Similarly, a pre-used Vulcan MSA series commercial gas griddle can be obtained for around USD 2,500. Automated technologies have significantly impacted commercial griddle processes, improving throughput, efficiency, and quality. Automated library preparation, liquid handling, and sample preparation workflows help reduce manpower requirements, handler-induced variability, contamination risks, and repetitive strain injuries.
- Moreover, these automated processes also ensure data accuracy, traceability, safety, and data provenance, which are crucial in clinical laboratories. Automation benefits include increased productivity, less staff requirements, and enhanced optimization. Modular options and connectivity options enable advanced automation, integrating various systems and processes. Commercial griddles with laboratory robotics and data integration capabilities offer machine learning and artificial intelligence features for improved experimental data capture and data evaluation. Larger laboratories, or mega labs, require intense pressure to operate efficiently, processing high volumes of samples and generating reports. Automated processes and workflow automation help manage turnaround time, dispensing precision, and laboratory opening hours.
Exclusive Customer Landscape
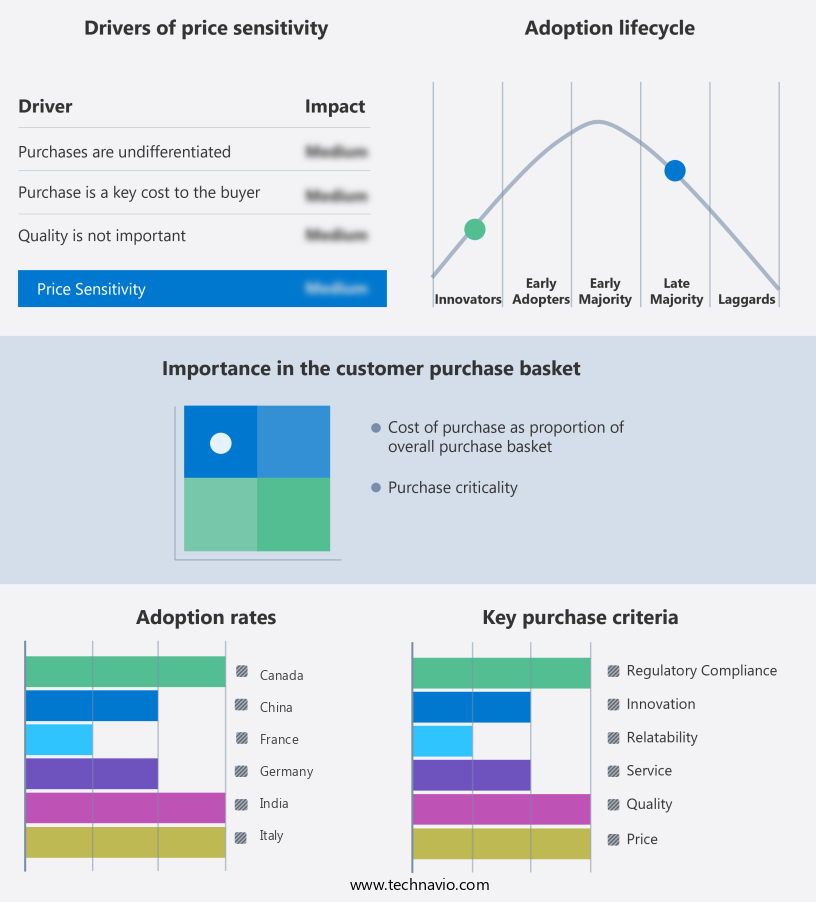
The commercial griddle market forecasting report includes the adoption lifecycle of the market, covering from the innovator's stage to the laggard's stage. It focuses on adoption rates in different regions based on penetration. Furthermore, the market report also includes key purchase criteria and drivers of price sensitivity to help companies evaluate and develop their market growth analysis strategies.
Customer Landscape
Key Companies & Market Insights
Companies are implementing various strategies, such as strategic alliances, market forecast, partnerships, mergers and acquisitions, geographical expansion, and product/service launches, to enhance their presence in the market.
AB Electrolux - The company offers commercial griddle products such as Electrolux Professional 0C9059 Grid Iron Kit, Electrolux Professional 0CA631 Grid for free standing gas grill.
The commercial griddle market research and growth report includes detailed analyses of the competitive landscape of the market and information about key companies, including:
- AccuTemp Products Inc.
- Adventys
- Ali Group Srl
- ANVIL WORLD
- Avantco Equipment
- Blaze Grills
- Conair Corp.
- ELAG Products GmbH
- Equipex LLC
- Hatco Corp.
- Illinois Tool Works Inc.
- The Clark Associates Co.
- The Middleby Corp.
- The Vollrath Co. LLC
Qualitative and quantitative analysis of companies has been conducted to help clients understand the wider business environment as well as the strengths and weaknesses of key market players. Data is qualitatively analyzed to categorize companies as pure play, category-focused, industry-focused, and diversified; it is quantitatively analyzed to categorize companies as dominant, leading, strong, tentative, and weak.
Research Analyst Overview
The market is witnessing significant growth as laboratories seek to improve their processes and enhance operational efficiency. Automated technologies are revolutionizing various aspects of laboratory workflows, from sample preparation to data evaluation. One of the primary drivers of this market trend is the increasing demand for throughput and efficiency. Automated processes in commercial griddle systems enable scientists to process larger sample volumes and reduce turnaround time. This is particularly important in clinical laboratories, where accurate and timely results are essential. Automation also brings about improvements in quality and data accuracy.
Moreover, by minimizing human intervention, automated systems help reduce handler-induced variability and contamination risks. Furthermore, they offer enhanced metrological traceability and data provenance, ensuring the chain of custody and maintaining data accuracy. Safety is another critical factor driving the adoption of automated commercial griddle systems. These systems help mitigate risks associated with dangerous chemicals and repetitive strain injuries, ensuring a safer working environment for laboratory personnel. Automation benefits extend beyond process efficiency and safety. Advanced automation, including machine learning and artificial intelligence, can help laboratories optimize their workflows and enhance productivity. Small labs can benefit from partial automation, while mega labs can implement integrated systems for advanced optimization.
Furthermore, centrifugation and laboratory robotics are integral components of automated commercial griddle systems. Data integration and connectivity options enable seamless communication between different systems, improving overall workflow efficiency. Despite the numerous benefits, the implementation of automated commercial griddle systems comes with challenges. These include the initial investment required, the need for manpower to manage and maintain the systems, and the potential for mislabelling and data provenance issues. In conclusion, the market is undergoing a transformation as laboratories seek to automate their processes to improve efficiency, quality, and safety. Automated systems offer numerous benefits, including increased throughput, enhanced data accuracy, and a safer working environment. However, careful consideration must be given to the challenges associated with implementation, such as initial investment and manpower requirements. Ultimately, the adoption of automated commercial griddle systems represents an investment in the future of laboratory science.
|
Commercial Griddle Market Scope |
|
|
Report Coverage |
Details |
|
Page number |
195 |
|
Base year |
2024 |
|
Historic period |
2019-2023 |
|
Forecast period |
2025-2029 |
|
Growth momentum & CAGR |
Accelerate at a CAGR of 6.2% |
|
Market growth 2025-2029 |
USD 534.7 million |
|
Market structure |
Fragmented |
|
YoY growth 2024-2025(%) |
5.6 |
|
Key countries |
US, Canada, China, Germany, UK, Japan, India, France, Spain, and Italy |
|
Competitive landscape |
Leading Companies, Market Positioning of Companies, Competitive Strategies, and Industry Risks |
What are the Key Data Covered in this Market Research and Growth Report?
- CAGR of the market during the forecast period
- Detailed information on factors that will drive the market growth and forecasting between 2025 and 2029
- Precise estimation of the size of the market and its contribution of the market in focus to the parent market
- Accurate predictions about upcoming market growth and trends and changes in consumer behaviour
- Growth of the market across North America, Europe, APAC, South America, and Middle East and Africa
- Thorough analysis of the market's competitive landscape and detailed information about companies
- Comprehensive analysis of factors that will challenge the growth of market companies
We can help! Our analysts can customize this market research report to meet your requirements. Get in touch
 RIA -
RIA - 
