Commercial Refrigeration Equipment Market Size 2026-2030
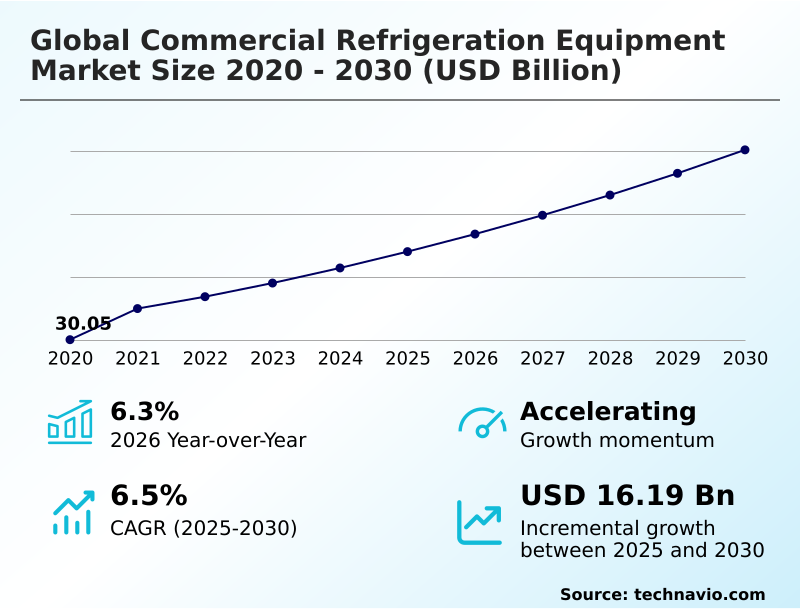
The commercial refrigeration equipment market size is valued to increase by USD 16.19 billion, at a CAGR of 6.5% from 2025 to 2030. Expansion of food retail, foodservice, and cold chain infrastructure will drive the commercial refrigeration equipment market.
Major Market Trends & Insights
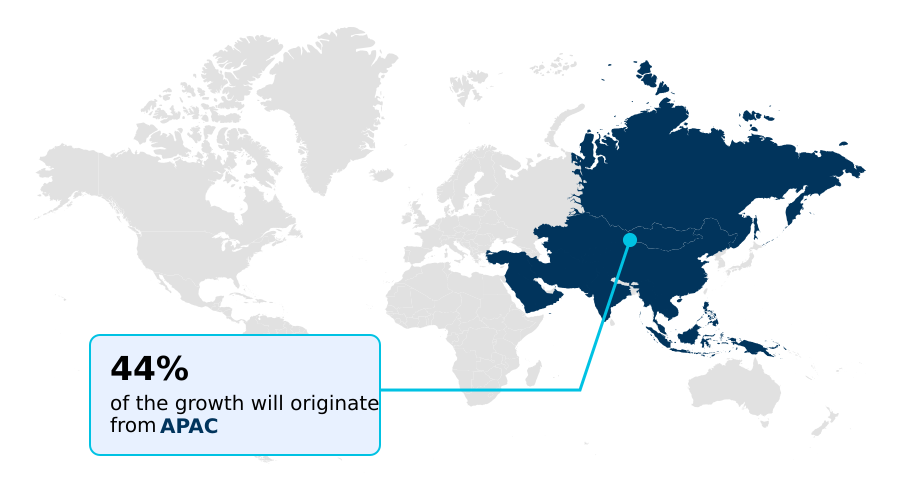
- APAC dominated the market and accounted for a 43.5% growth during the forecast period.
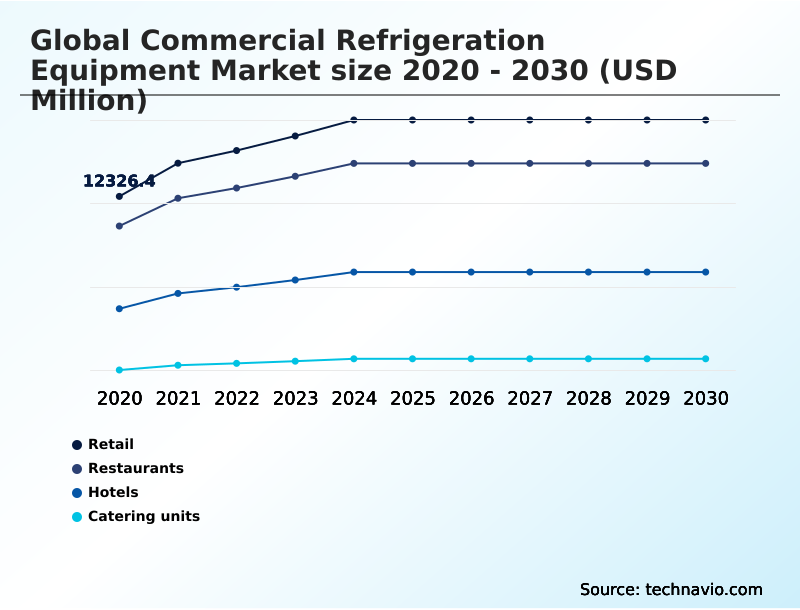
- By End-user - Retail segment was valued at USD 16.99 billion in 2024
- By Product - Walk-in coolers segment accounted for the largest market revenue share in 2024
Market Size & Forecast
- Market Opportunities: USD 30.20 billion
- Market Future Opportunities: USD 16.19 billion
- CAGR from 2025 to 2030 : 6.5%
Market Summary
- The commercial refrigeration equipment market is undergoing a significant transformation, driven by the dual imperatives of environmental sustainability and operational efficiency. A key dynamic is the industry-wide shift toward natural refrigerants and low-GWP refrigerants to comply with evolving regulations, compelling manufacturers to re-engineer systems with components like advanced scroll compressors and condensing units.
- Concurrently, the integration of smart refrigeration solutions is becoming standard, enabling enhanced remote temperature monitoring and predictive maintenance. For instance, a national supermarket chain can leverage these IoT-enabled systems to ensure food safety compliance across hundreds of stores, analyzing real-time data to prevent spoilage, optimize energy consumption, and reduce downtime.
- This convergence of regulatory pressure and technological innovation is reshaping equipment design, focusing on lifecycle costs rather than just initial purchase price. The expansion of cold chain infrastructure, particularly for food distribution networks and pharmaceuticals, further fuels demand for reliable, high-performance industrial refrigeration and HVAC systems, making system durability and operational reliability critical.
What will be the Size of the Commercial Refrigeration Equipment Market during the forecast period?
Get Key Insights on Market Forecast (PDF) Get Free Sample
How is the Commercial Refrigeration Equipment Market Segmented?
The commercial refrigeration equipment industry research report provides comprehensive data (region-wise segment analysis), with forecasts and estimates in "USD million" for the period 2026-2030, as well as historical data from 2020-2024 for the following segments.
- End-user
- Retail
- Restaurants
- Hotels
- Catering units
- Product
- Walk-in coolers
- Display cases
- Refrigerator for drinks
- Ice-making machines
- Others
- Type
- Self-contained
- Remotely operated
- Capacity
- Between 50 and 100 cubic feet
- Less than 50 cubic feet
- More than 100 cubic feet
- Material
- Synthetic refrigerants
- Natural refrigerants
- Others
- Geography
- APAC
- China
- Japan
- India
- Europe
- UK
- Germany
- France
- North America
- US
- Canada
- Mexico
- Middle East and Africa
- UAE
- Saudi Arabia
- South Africa
- South America
- Brazil
- Argentina
- Colombia
- Rest of World (ROW)
- APAC
By End-user Insights
The retail segment is estimated to witness significant growth during the forecast period.
The retail segment is pivotal, driven by hypermarkets, supermarkets, and convenience stores investing in advanced cooling solutions to meet consumer demand for fresh and frozen products.
This sector is rapidly adopting energy efficiency standards and integrating natural refrigerants to align with stringent environmental regulations and reduce operational expenses. Modular refrigeration solutions are gaining traction, allowing for flexible store layouts and better space optimization.
The integration of the internet of things enables real-time monitoring, crucial for food safety compliance and preventing inventory loss.
As organized retail expands, particularly in developing regions that account for 43.5% of incremental growth, the demand for high-performance walk-in coolers and sustainable cooling for the hospitality sector is set to increase, prioritizing thermal insulation materials for better performance.
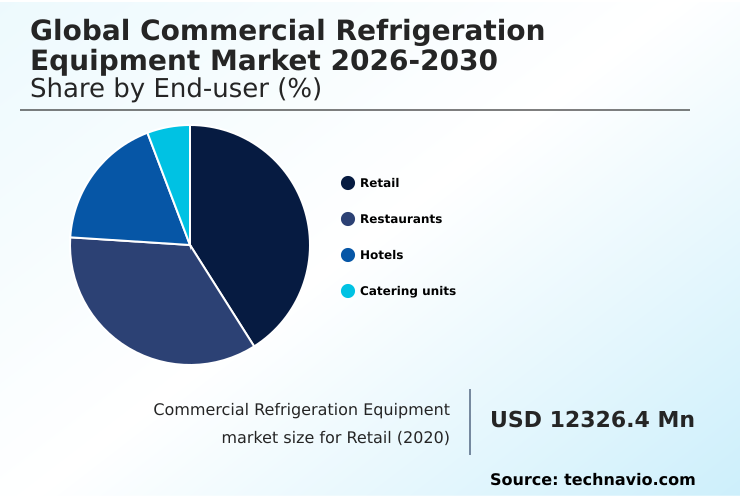
The Retail segment was valued at USD 16.99 billion in 2024 and showed a gradual increase during the forecast period.
Regional Analysis
APAC is estimated to contribute 43.5% to the growth of the global market during the forecast period.Technavio’s analysts have elaborately explained the regional trends and drivers that shape the market during the forecast period.
See How Commercial Refrigeration Equipment Market Demand is Rising in APAC Get Free Sample
The geographic landscape is characterized by diverse regional growth patterns, with APAC emerging as the primary contributor to market expansion, accounting for 43.5% of incremental growth.
This region's market is projected to expand at a rate of 6.9%, outpacing Europe's 6.0% growth, fueled by the rapid development of cold chain logistics and food retail solutions.
In mature markets like North America and Europe, the focus is on retrofitting existing remotely operated systems with high-efficiency components like variable speed compressors and transcritical CO2 systems to meet stringent environmental compliance standards.
This involves significant aftermarket vehicle service and clean energy and fueling initiatives.
Developing economies, in contrast, are focused on greenfield projects, expanding cold storage products and packaged air conditioning systems to build out their food distribution networks from the ground up.
Market Dynamics
Our researchers analyzed the data with 2025 as the base year, along with the key drivers, trends, and challenges. A holistic analysis of drivers will help companies refine their marketing strategies to gain a competitive advantage.
- Strategic decision-making in the commercial refrigeration equipment market increasingly revolves around balancing upfront investment with long-term operational returns. Businesses evaluating CO2 refrigeration systems for supermarkets must weigh enhanced sustainability against initial implementation complexity. Similarly, the choice between centralized vs decentralized refrigeration systems impacts maintenance protocols and energy consumption profiles.
- The adoption of smart refrigeration for food service not only improves food safety but also offers predictive maintenance for refrigeration assets, significantly reducing downtime. When considering low-GWP refrigerants in retail, organizations must account for new compliance with food safety regulations and technician training. The benefits of modular walk-in cooler installation include scalability and reduced initial outlay.
- For operators, improving thermal efficiency in display cases through advanced insulation for refrigeration units offers direct energy savings. Key performance indicators now include variable speed compressor energy savings and the total cost of ownership of refrigeration. Furthermore, firms are exploring hydrocarbon refrigerants in self-contained units and the advantages of natural refrigerant conversion benefits.
- Managing refrigerated transport for the cold chain is critical, as is reducing refrigerant leakage in systems. Blast chiller performance standards and the integration of HVAC integration with refrigeration are also key considerations for ensuring sustainable cooling for the hospitality sector.
What are the key market drivers leading to the rise in the adoption of Commercial Refrigeration Equipment Industry?
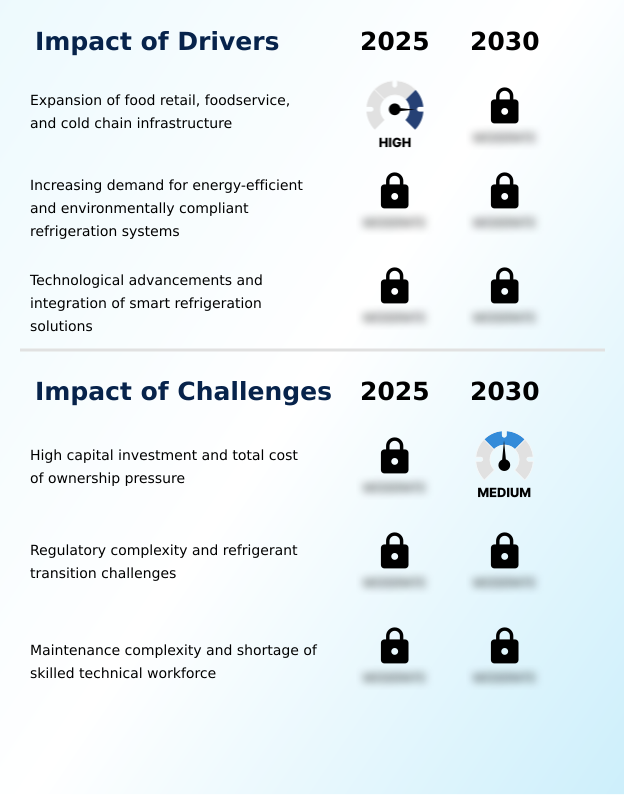
- The expansion of food retail, foodservice establishments, and cold chain infrastructure serves as a key driver for the commercial refrigeration equipment market.
- Market growth is significantly driven by the expansion of cold chain infrastructure and the rising demand for energy-efficient equipment.
- As food distribution networks become more globalized, the need for reliable temperature integrity and food safety compliance intensifies, spurring investment in modern industrial refrigeration.
- Technological advancements are a key driver, with next-generation variable speed compressors and scroll compressors delivering substantial performance improvements. For instance, certain models achieve an 8% increase in efficiency for medium-temperature applications and over 20% for low-temperature settings.
- This focus on efficiency is reinforced by stringent energy efficiency standards, pushing businesses to adopt advanced cooling components and packaged air conditioning systems. The integration of vapor injection technology further enhances system durability and performance in demanding electro-mechanical projects.
What are the market trends shaping the Commercial Refrigeration Equipment Industry?
- The increasing adoption of smart and connected refrigeration systems represents a significant upcoming trend. This shift is driven by the need for enhanced monitoring, control, and operational efficiency.
- A primary market trend is the increasing integration of smart and connected technologies, which transforms refrigeration equipment into intelligent assets. The adoption of IoT-based platforms for predictive maintenance is enabling businesses to reduce unplanned downtime by up to 30%, ensuring operational reliability. These systems utilize advanced electronic controls and high-efficiency fans to optimize performance in real time.
- Another key trend is the shift toward sustainable technologies, including heat recovery systems that capture and reuse waste energy, lowering a facility's overall energy consumption by over 15%.
- This aligns with the growing use of R290 propane in self-contained refrigeration units and the expansion of hydrocarbon-based systems, reflecting a broader commitment to environmental compliance and data-driven decision making across food processing equipment.
What challenges does the Commercial Refrigeration Equipment Industry face during its growth?
- High capital investment requirements and pressures from the total cost of ownership present a key challenge affecting industry growth.
- High upfront capital investment for equipment procurement and system integration remains a significant market challenge, particularly for small and medium-sized enterprises. The total cost of ownership, elevated by rising energy prices and complex maintenance requirements, can deter the adoption of advanced technologies, where ongoing operational expenses can exceed initial costs by a factor of three over the equipment's lifespan.
- Furthermore, a persistent shortage of skilled technical workforce complicates the servicing of modern systems featuring sophisticated controls, with some regions reporting a 15% gap between demand for certified technicians and availability. This challenge affects everything from professional kitchen systems to large-scale cold storage products, impacting operational reliability and asset utilization.
- Navigating complex regulatory compliance for refrigerants adds another layer of cost and uncertainty.
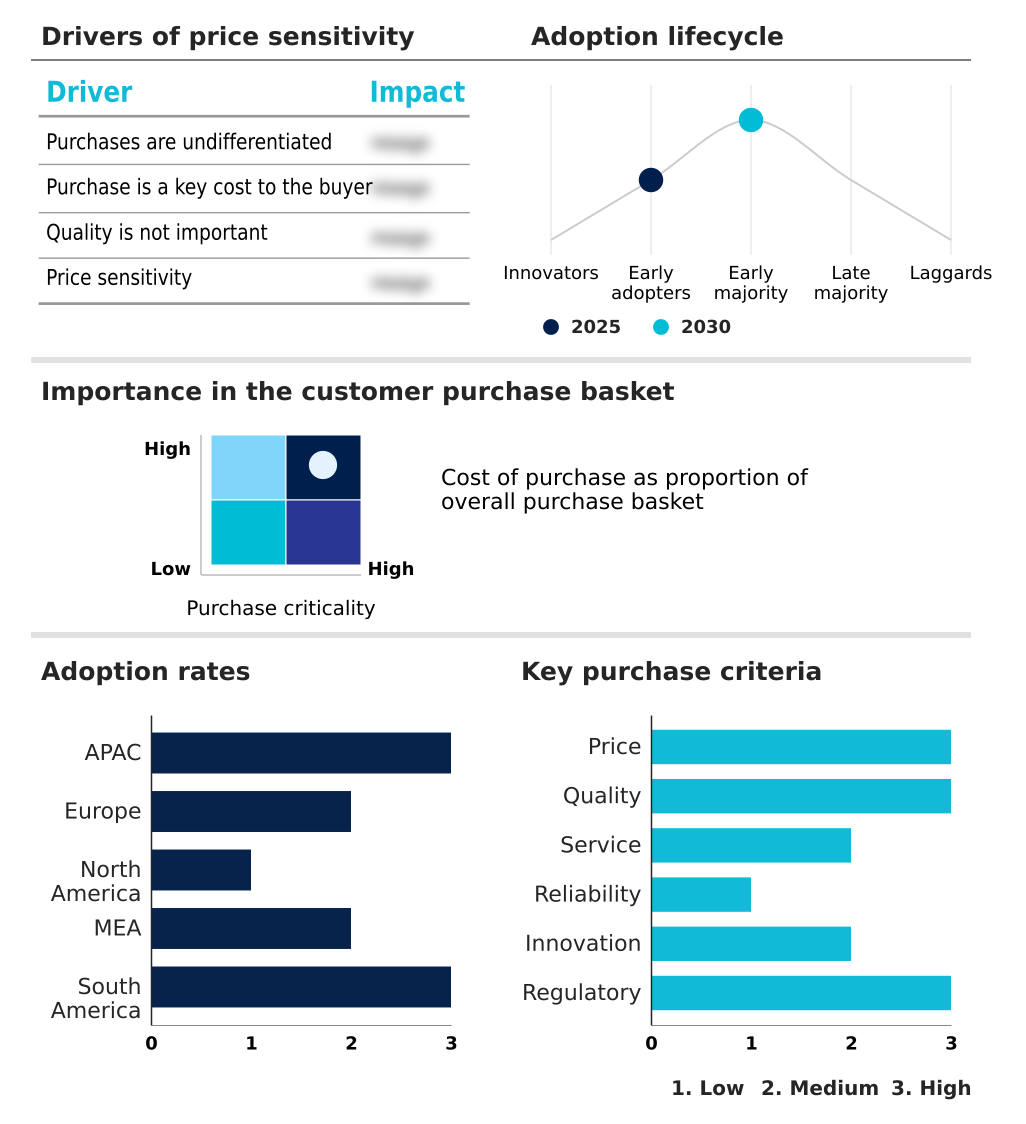
Exclusive Technavio Analysis on Customer Landscape
The commercial refrigeration equipment market forecasting report includes the adoption lifecycle of the market, covering from the innovator’s stage to the laggard’s stage. It focuses on adoption rates in different regions based on penetration. Furthermore, the commercial refrigeration equipment market report also includes key purchase criteria and drivers of price sensitivity to help companies evaluate and develop their market growth analysis strategies.
Customer Landscape of Commercial Refrigeration Equipment Industry
Competitive Landscape
Companies are implementing various strategies, such as strategic alliances, commercial refrigeration equipment market forecast, partnerships, mergers and acquisitions, geographical expansion, and product/service launches, to enhance their presence in the industry.
Ali Group Srl - A diversified portfolio of commercial refrigeration equipment includes prep tables, undercounter units, merchandisers, and cold-storage solutions designed for varied foodservice applications.
The industry research and growth report includes detailed analyses of the competitive landscape of the market and information about key companies, including:
- Ali Group Srl
- Blue Star Ltd.
- Daikin Industries Ltd.
- Dover Corp.
- Electrolux Group
- Felix Storch Inc.
- FREOR LT UAB
- FUJIMAK Corp.
- Haier Smart Home Co. Ltd.
- HOSHIZAKI Corp.
- Illinois Tool Works Inc.
- Imbera
- Lennox International Inc.
- Panasonic Holdings Corp.
- Tecumseh Products Co. LLC
- TEFCOLD AS
- The Middleby Corp.
- Turbo Air Inc.
Qualitative and quantitative analysis of companies has been conducted to help clients understand the wider business environment as well as the strengths and weaknesses of key industry players. Data is qualitatively analyzed to categorize companies as pure play, category-focused, industry-focused, and diversified; it is quantitatively analyzed to categorize companies as dominant, leading, strong, tentative, and weak.
Recent Development and News in Commercial refrigeration equipment market
- In September 2024, Copeland formed a partnership with Hitachi to introduce the airCenter Scroll R-32 chiller solution in Brazil, focusing on high-efficiency cooling with lower global warming potential refrigerants.
- In October 2024, Haier Smart Home finalized the acquisition of Carrier Global Corp.'s commercial refrigeration business for approximately $775 million, significantly expanding its product portfolio and global footprint.
- In November 2024, Copeland launched a new series of high-efficiency scroll compressors, including the ZB and ZFI models, which are engineered to improve energy efficiency by more than 20% in certain cold chain applications.
- In December 2024, Daikin India established a joint venture with Rechi Precision to manufacture HVAC compressors locally, aiming to strengthen its supply chain and support the 'Make in India' initiative.
Dive into Technavio’s robust research methodology, blending expert interviews, extensive data synthesis, and validated models for unparalleled Commercial Refrigeration Equipment Market insights. See full methodology.
| Market Scope | |
|---|---|
| Page number | 341 |
| Base year | 2025 |
| Historic period | 2020-2024 |
| Forecast period | 2026-2030 |
| Growth momentum & CAGR | Accelerate at a CAGR of 6.5% |
| Market growth 2026-2030 | USD 16186.6 million |
| Market structure | Fragmented |
| YoY growth 2025-2026(%) | 6.3% |
| Key countries | China, Japan, India, South Korea, Australia, Indonesia, UK, Germany, France, Italy, Spain, The Netherlands, US, Canada, Mexico, UAE, Saudi Arabia, South Africa, Egypt, Turkey, Brazil, Argentina and Colombia |
| Competitive landscape | Leading Companies, Market Positioning of Companies, Competitive Strategies, and Industry Risks |
Research Analyst Overview
- The commercial refrigeration equipment market is advancing beyond basic cooling to become a nexus of sustainable and intelligent technologies. Core to this evolution is the mandated transition to natural refrigerants and low-GWP refrigerants, driving innovation in transcritical CO2 systems and hydrocarbon-based systems, which often feature advanced hermetic compressors and vapor injection technology.
- Boardroom decisions are now heavily influenced by the need for regulatory compliance, pushing investment toward modular refrigeration solutions and self-contained refrigeration units using R290 propane. The integration of smart refrigeration solutions, enabling remote temperature monitoring and predictive maintenance, has become a competitive differentiator.
- These systems, built with high-efficiency fans, electronic controls, and scroll compressors, deliver tangible ROI, with some achieving more than 20% gains in energy efficiency. This shift impacts everything from industrial refrigeration and HVAC systems to individual display cases with anti-fog coatings and triple-pane glass.
- The focus on temperature integrity, supported by polyurethane foam insulation and advanced air-cooled condensers, is critical for maintaining food safety compliance across the entire cold chain infrastructure, from walk-in coolers to remotely operated systems, while minimizing refrigerant leakage and improving temperature control accuracy.
What are the Key Data Covered in this Commercial Refrigeration Equipment Market Research and Growth Report?
-
What is the expected growth of the Commercial Refrigeration Equipment Market between 2026 and 2030?
-
USD 16.19 billion, at a CAGR of 6.5%
-
-
What segmentation does the market report cover?
-
The report is segmented by End-user (Retail, Restaurants, Hotels, and Catering units), Product (Walk-in coolers, Display cases, Refrigerator for drinks, Ice-making machines, and Others), Type (Self-contained, and Remotely operated), Capacity (Between 50 and 100 cubic feet, Less than 50 cubic feet, and More than 100 cubic feet), Material (Synthetic refrigerants, Natural refrigerants, and Others) and Geography (APAC, Europe, North America, Middle East and Africa, South America)
-
-
Which regions are analyzed in the report?
-
APAC, Europe, North America, Middle East and Africa and South America
-
-
What are the key growth drivers and market challenges?
-
Expansion of food retail, foodservice, and cold chain infrastructure, High capital investment and total cost of ownership pressure
-
-
Who are the major players in the Commercial Refrigeration Equipment Market?
-
Ali Group Srl, Blue Star Ltd., Daikin Industries Ltd., Dover Corp., Electrolux Group, Felix Storch Inc., FREOR LT UAB, FUJIMAK Corp., Haier Smart Home Co. Ltd., HOSHIZAKI Corp., Illinois Tool Works Inc., Imbera, Lennox International Inc., Panasonic Holdings Corp., Tecumseh Products Co. LLC, TEFCOLD AS, The Middleby Corp. and Turbo Air Inc.
-
Market Research Insights
- Market dynamics are shaped by a strategic focus on asset management and supply chain efficiency, with businesses prioritizing solutions that lower total cost of ownership. The adoption of advanced cooling components is delivering measurable performance gains, with certain high-efficiency compressor models achieving an 8% improvement in medium-temperature applications and over 20% gains in low-temperature environments.
- This emphasis on energy performance directly impacts operational expenses. Furthermore, the integration of predictive maintenance capabilities within professional kitchen systems is reducing equipment downtime, enhancing operational reliability for food service equipment. These data-driven decision-making tools help businesses optimize asset utilization and align equipment procurement with long-term sustainability and regulatory compliance goals.
We can help! Our analysts can customize this commercial refrigeration equipment market research report to meet your requirements.
 RIA -
RIA - 
