Commercial Satellite Imaging Market Analysis North America, APAC, Europe, South America, Middle East and Africa - US, China, Russia, France, Japan - Size and Forecast 2024-2028

Commercial Satellite Imaging Market Analysis North America, APAC, Europe, South America, Middle East and Africa - US, China, Russia, France, Japan - Size and Forecast 2024-2028

Published: Jul 2024 172 Pages SKU: IRTNTR70766

Market Overview at a Glance

$2.33 B
Market Opportunity
7.66%
CAGR
7.24
YoY growth 2023-2024(%)

Commercial Satellite Imaging Market Size 2024-2028

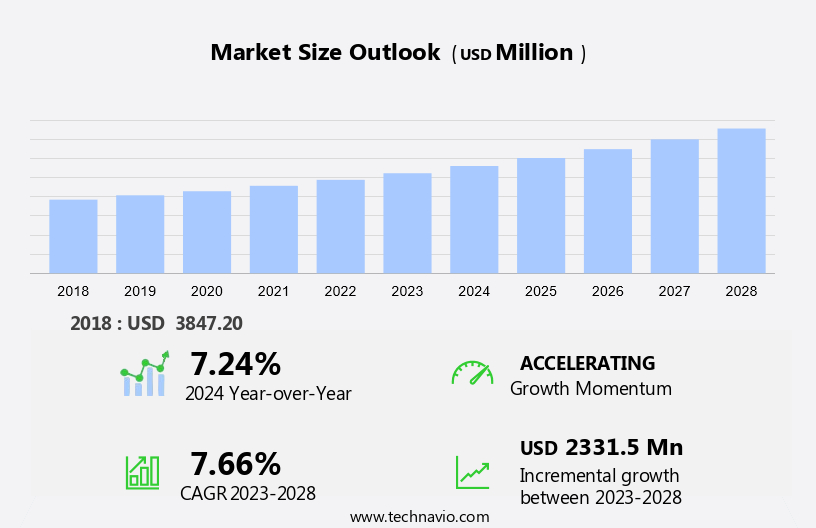
The commercial satellite imaging market size is forecast to increase by USD 2.33 billion at a CAGR of 7.66% between 2023 and 2028.

  • The market is experiencing significant growth due to advancements in satellite technology and the increasing demand for high-resolution imagery. Additionally, the cost of launching satellites is decreasing, making it more accessible to businesses. However, challenges remain, including regulatory issues and data security and privacy concerns. The key players address these challenges through advanced image-processing techniques, AI-powered analytics, and partnerships with governments and private organizations. Artificial intelligence plays a pivotal role in enhancing image clarity, improving data interpretation, and automating the analysis process. This market analysis report delves into these trends and challenges, providing insights into the future growth prospects of the commercial satellite imaging industry.

What will be the Size of the Commercial Satellite Imaging Market During the Forecast Period?

Commercial Satellite Imaging Market Size

 Request Free Sample

  • The market encompasses the use of imagery obtained from optically equipped satellites for various applications, including meteorology, oceanography, fisheries, agriculture, biodiversity protection, forestry, geology, cartography, regional planning, intelligence, warfare, aeronautical imaging, terrestrial imaging, and smart cities. These images play a crucial role in providing valuable insights and data for numerous industries and sectors. Meteorology and oceanography applications utilize satellite imagery to monitor weather patterns, ocean currents, and climate trends. This data is essential for forecasting severe weather events, predicting storms, and understanding climate change. In the field of fisheries, satellite imagery is used to monitor fish populations, track migration patterns, and ensure sustainable fishing practices.
  • Agriculture is another significant sector that benefits from satellite imagery. Farmers and agricultural organizations use this data to optimize crop yields, monitor crop health, and manage irrigation systems. Biodiversity protection and forestry applications rely on satellite imagery for monitoring deforestation, identifying endangered species, and managing forest resources. Geology and cartography applications use satellite imagery for mapping and analyzing geological features, while regional planning and intelligence applications utilize this data for infrastructure development, urban planning, and security purposes. In the field of warfare, satellite imagery is used for reconnaissance, target identification, and battlefield analysis. Aeronautical and terrestrial imaging applications use satellite imagery for mapping and surveying terrain, monitoring infrastructure, and ensuring safety in aviation and transportation.

How is this Commercial Satellite Imaging Industry segmented and which is the largest segment?

The commercial satellite imaging industry research report provides comprehensive data (region-wise segment analysis), with forecasts and estimates in "USD million" for the period 2024-2028, as well as historical data from 2018-2022 for the following segments.

  • End-user
    • Government
    • Military and defense
    • Transportation
    • Agriculture
    • Others
  • Technology
    • Optical
    • Radar
  • Geography
    • North America
      • US
    • APAC
      • China
      • Japan
    • Europe
      • France
    • South America
    • Middle East and Africa

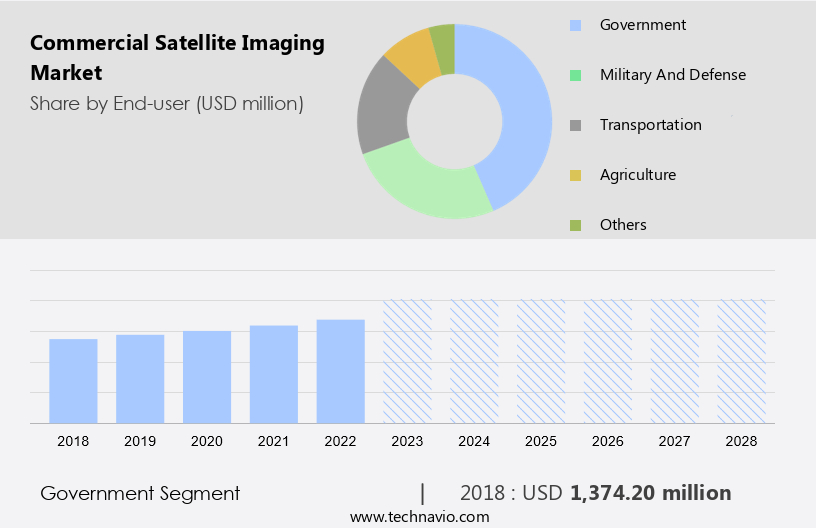
By End-user Insights

  • The government segment is estimated to witness significant growth during the forecast period.

Satellite imaging, specifically through platforms such as Google Earth, has become a crucial tool for various sectors, particularly the government. This technology aids in civil protection and humanitarian efforts by enabling the analysis and management of disaster causation factors. By assessing risks and planning prevention measures, satellite imagery facilitates more effective disaster response and relief efforts. Furthermore, high-resolution satellite imagery contributes to the restoration and enhancement of facilities, livelihoods, and living conditions in affected communities. In addition, it plays a vital role in protecting natural resources and the environment, including wildlife habitats. High-resolution satellite imagery is also indispensable for engineering and urban planning projects.  Location-Based Services (LBS) integrated with satellite imagery can further enhance the utility of this technology in various sectors, including defense and energy.

Commercial Satellite Imaging Market Size

Get a glance at the  Commercial Satellite Imaging Industry report of share of various segments Request Free Sample

The government segment was valued at USD 1.37 billion in 2018 and showed a gradual increase during the forecast period.

Regional Analysis

  • APAC is estimated to contribute 31% to the growth of the global market during the forecast period.

Technavio's analysts have elaborately explained the regional trends and drivers that shape the market during the forecast period.

Commercial Satellite Imaging Market Share by Geography

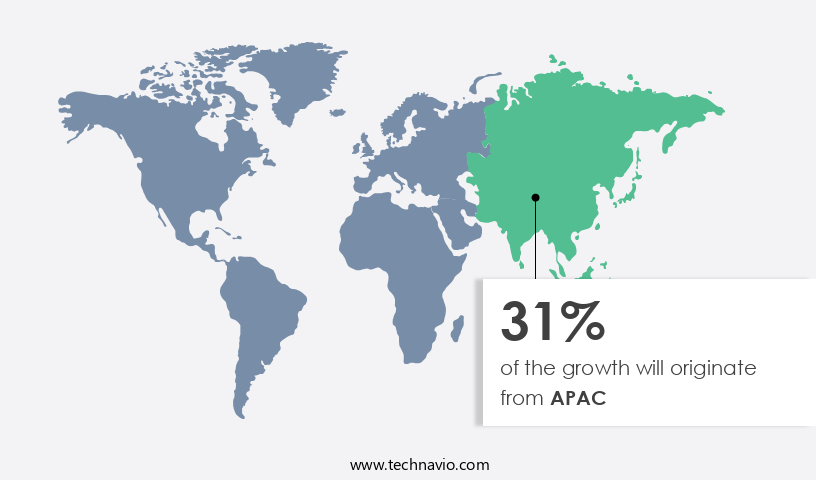
For more insights on the market share of various regions, Request Free Sample

Commercial satellite imaging is a significant sector in North America, with the United States, Canada, and Mexico being key markets. These countries possess advanced infrastructure and are actively engaged in space programs. In the US, organizations such as NASA and private enterprises are innovating new satellite systems to cater to the expanding commercial demand. This demand is primarily driven by applications like environmental management, energy resource security, border surveillance, and construction project mapping. The US civilian space program, managed by NASA, encompasses four primary activities: aeronautics research, exploration systems, science, and space operations. The market is predominantly utilized in meteorology for weather forecasting, oceanography for marine research, fisheries management, agriculture, biodiversity protection, forestry, and geology. These industries rely on Earth observation imagery for efficient resource management, risk assessment, and infrastructure development.

Market Dynamics

Our researchers analyzed the data with 2023 as the base year, along with the key drivers, trends, and challenges. A holistic analysis of drivers will help companies refine their marketing strategies to gain a competitive advantage.

What are the key market drivers leading to the rise In the adoption of Commercial Satellite Imaging Industry?

Advances in satellite imaging technologies is the key driver of the market.

  • Satellite imaging plays a crucial role in gathering valuable data and information for various sectors, including defense, natural resources, and meteorology. Advanced imaging satellites equipped with high-resolution cameras and sophisticated remote-sensing technology provide clear and detailed images for cartography, regional planning, and intelligence gathering. These images are extensively used in defense applications, such as warfare and border security. In addition, they are essential for aeronautical and terrestrial imaging, providing insights for industries like oil and gas, mining, and agriculture. The demand for superior image quality continues to rise, with end-users seeking more clarity for applications like weather forecasting, precision farming, and forestry management.
  • The evolution of satellite technology has enabled the capture of increasingly detailed and accurate images, enhancing their utility and value.

What are the market trends shaping the Commercial Satellite Imaging Industry?

Advanced satellite imaging applications is the upcoming market trend.

  • In the realm of satellite imaging, new-age, economical interactive services are spearheading a groundbreaking transformation. Advanced satellite technologies, coupled with the rapid advancement of information technology, have facilitated Google Earth Engine to introduce a video service. This innovative offering, named Timelapse, merges satellite images with sophisticated software to trace geological alterations worldwide over the past three decades. Beyond this, there are numerous advanced applications, such as assessing soil moisture levels using active and passive sensors from orbit, devising agricultural plans by mapping soil types, and uncovering archaeological sites like the Mayans and ancient Egypt.

What challenges does the Commercial Satellite Imaging Industry face during its growth?

Costs associated with satellite launches is a key challenge affecting the industry growth.

  • The market encompasses the production and deployment of satellites for various applications, including smart cities, military and defense, and meteorological monitoring. Companies such as Pixxel and Shakuntala are at the forefront of this industry, utilizing advanced technologies to capture high-resolution images from space. The launch of these satellites is a complex process, necessitating significant investment and expertise.
  • The cost of satellite manufacturing and deployment ranges from USD 50 million to over USD 1 billion, depending on the satellite's functionality. For instance, a weather monitoring satellite may cost around USD290 million, while a military communication satellite can exceed USD 1 billion. The European Commission and SpaceX's Falcon-9 are among the key players In the satellite launch market. The Asia-Pacific region is expected to dominate the market due to its rapid industrialization and increasing demand for advanced technologies.

Exclusive Customer Landscape

The commercial satellite imaging market forecasting report includes the adoption lifecycle of the market, covering from the innovator's stage to the laggard's stage. It focuses on adoption rates in different regions based on penetration. Furthermore, the commercial satellite imaging market report also includes key purchase criteria and drivers of price sensitivity to help companies evaluate and develop their market growth analysis strategies.
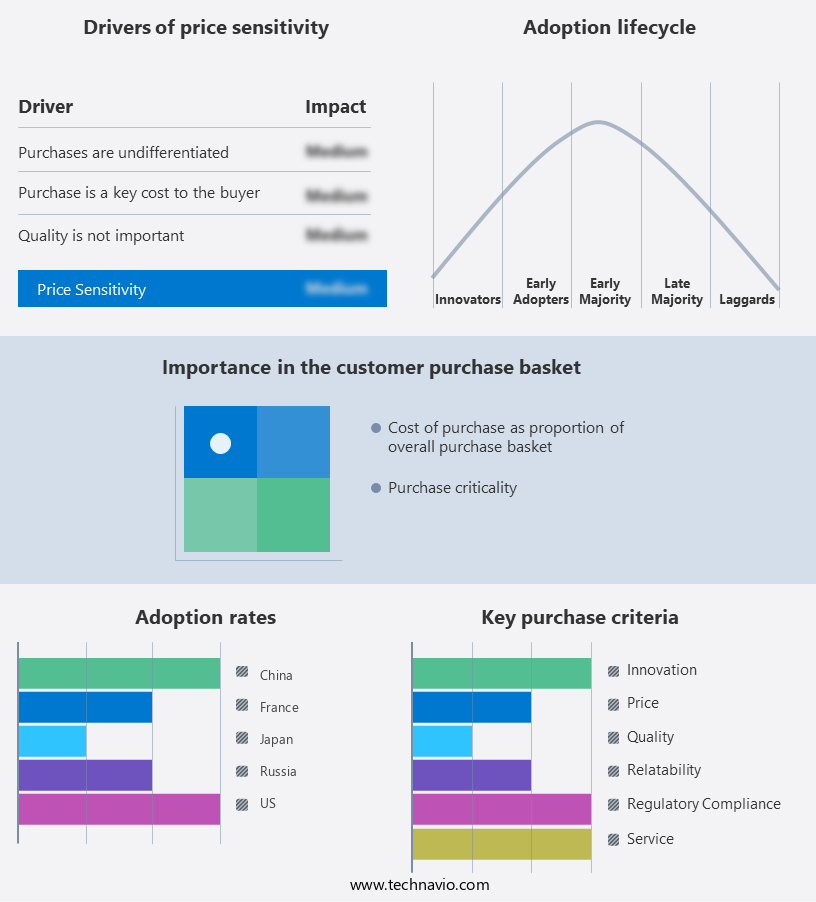
Commercial Satellite Imaging Market Share by Geography

 Customer Landscape

Key Companies & Market Insights

Companies are implementing various strategies, such as strategic alliances, commercial satellite imaging market forecast, partnerships, mergers and acquisitions, geographical expansion, and product/service launches, to enhance their presence In the industry.

The industry research and growth report includes detailed analyses of the competitive landscape of the market and information about key companies, including:

  • Airbus SE
  • BlackSky Global LLC
  • European Space Imaging GmbH
  • ICEYE Oy
  • Imagesat International I.S.I Ltd.
  • L3Harris Technologies Inc.
  • MapTiler AG
  • Maxar Technologies Inc.
  • Planet Labs PBC
  • Satellogic SA
  • SkyWatch Space Applications Inc.
  • SpaceKnow Inc.
  • Thales Group

Qualitative and quantitative analysis of companies has been conducted to help clients understand the wider business environment as well as the strengths and weaknesses of key industry players. Data is qualitatively analyzed to categorize companies as pure play, category-focused, industry-focused, and diversified; it is quantitatively analyzed to categorize companies as dominant, leading, strong, tentative, and weak.

Research Analyst Overview

The market is witnessing significant growth due to the increasing demand for earth observation imagery in various sectors. The market finds applications in meteorology, oceanography, fisheries, agriculture, biodiversity protection, forestry, geology, cartography, regional planning, intelligence, warfare, and more. Imaging satellites equipped with optically equipped sensors capture high-resolution satellite imagery, which is utilized for various purposes such as meteorological forecasting, ocean current monitoring, crop yield analysis, and disaster management. Satellite imagery plays a crucial role in industries like mining, energy, infrastructure, and maritime. It aids in resource exploration, infrastructure planning, and asset monitoring. In addition, the integration of satellite imagery with digital maps and location-based services (LBS) enhances the efficiency of various industries.

In addition, the military and defense sector is a significant consumer of satellite imagery for intelligence gathering and reconnaissance. The European Commission and the Asia-Pacific market are major contributors to the market's growth. Remote sensing technology, electric propulsion technology, and LIDAR technology are the key technologies driving the growth of the market. Companies like DigitalGlobe Inc, Planet Labs Inc, Spaceknow Inc, Skylab Analytics, L3Harris Technologies, GeoEye, and others are pioneers In the commercial satellite imaging industry. Cloud-based technology is a growing trend In the commercial satellite imagery market, enabling easy access to satellite imagery and analysis tools for various industries.

Market Scope

Report Coverage

Details

Page number

172

Base year

2023

Historic period

2018-2022

Forecast period

2024-2028

Growth momentum & CAGR

Accelerate at a CAGR of 7.66%

Market Growth 2024-2028

USD 2.33 billion

Market structure

Concentrated

YoY growth 2023-2024(%)

7.24

Key countries

US, China, Russia, France, and Japan

Competitive landscape

Leading Companies, Market Positioning of Companies, Competitive Strategies, and Industry Risks

Request Free Sample

What are the Key Data Covered in this Commercial Satellite Imaging Market Research and Growth Report?

  • CAGR of the Commercial Satellite Imaging industry during the forecast period
  • Detailed information on factors that will drive the market growth and forecasting between 2024 and 2028
  • Precise estimation of the size of the market and its contribution of the industry in focus to the parent market
  • Accurate predictions about upcoming growth and trends and changes in consumer behaviour
  • Growth of the market across North America, APAC, Europe, South America, and Middle East and Africa
  • Thorough analysis of the market's competitive landscape and detailed information about companies
  • Comprehensive analysis of factors that will challenge the commercial satellite imaging market growth of industry companies

We can help! Our analysts can customize this commercial satellite imaging market research report to meet your requirements.

Get in touch

1 Executive Summary

  • 1.1 Market overview
    • Executive Summary - Chart on Market Overview
    • Executive Summary - Data Table on Market Overview
    • Executive Summary - Chart on Global Market Characteristics
    • Executive Summary - Chart on Market by Geography
    • Executive Summary - Chart on Market Segmentation by End-user
    • Executive Summary - Chart on Market Segmentation by Technology
    • Executive Summary - Chart on Incremental Growth
    • Executive Summary - Data Table on Incremental Growth
    • Executive Summary - Chart on Company Market Positioning

2 Market Landscape

  • 2.1 Market ecosystem
    • Parent Market
    • Data Table on - Parent Market
  • 2.2 Market characteristics
    • Market characteristics analysis
  • 2.3 Value chain analysis
    • Value Chain Analysis

3 Market Sizing

  • 3.1 Market definition
    • Offerings of companies included in the market definition
  • 3.2 Market segment analysis
    • Market segments
  • 3.3 Market size 2023
    • 3.4 Market outlook: Forecast for 2023-2028
      • Chart on Global - Market size and forecast 2023-2028 ($ million)
      • Data Table on Global - Market size and forecast 2023-2028 ($ million)
      • Chart on Global Market: Year-over-year growth 2023-2028 (%)
      • Data Table on Global Market: Year-over-year growth 2023-2028 (%)

    4 Historic Market Size

    • 4.1 Global Commercial Satellite Imaging Market 2018 - 2022
      • Historic Market Size - Data Table on Global Commercial Satellite Imaging Market 2018 - 2022 ($ million)
    • 4.2 End-user segment analysis 2018 - 2022
      • Historic Market Size - End-user Segment 2018 - 2022 ($ million)
    • 4.3 Technology segment analysis 2018 - 2022
      • Historic Market Size - Technology Segment 2018 - 2022 ($ million)
    • 4.4 Geography segment analysis 2018 - 2022
      • Historic Market Size - Geography Segment 2018 - 2022 ($ million)
    • 4.5 Country segment analysis 2018 - 2022
      • Historic Market Size - Country Segment 2018 - 2022 ($ million)

    5 Five Forces Analysis

    • 5.1 Five forces summary
      • Five forces analysis - Comparison between 2023 and 2028
    • 5.2 Bargaining power of buyers
      • Bargaining power of buyers - Impact of key factors 2023 and 2028
    • 5.3 Bargaining power of suppliers
      • Bargaining power of suppliers - Impact of key factors in 2023 and 2028
    • 5.4 Threat of new entrants
      • Threat of new entrants - Impact of key factors in 2023 and 2028
    • 5.5 Threat of substitutes
      • Threat of substitutes - Impact of key factors in 2023 and 2028
    • 5.6 Threat of rivalry
      • Threat of rivalry - Impact of key factors in 2023 and 2028
    • 5.7 Market condition
      • Chart on Market condition - Five forces 2023 and 2028

    6 Market Segmentation by End-user

    • 6.1 Market segments
      • Chart on End-user - Market share 2023-2028 (%)
      • Data Table on End-user - Market share 2023-2028 (%)
    • 6.2 Comparison by End-user
      • Chart on Comparison by End-user
      • Data Table on Comparison by End-user
    • 6.3 Government - Market size and forecast 2023-2028
      • Chart on Government - Market size and forecast 2023-2028 ($ million)
      • Data Table on Government - Market size and forecast 2023-2028 ($ million)
      • Chart on Government - Year-over-year growth 2023-2028 (%)
      • Data Table on Government - Year-over-year growth 2023-2028 (%)
    • 6.4 Military and defense - Market size and forecast 2023-2028
      • Chart on Military and defense - Market size and forecast 2023-2028 ($ million)
      • Data Table on Military and defense - Market size and forecast 2023-2028 ($ million)
      • Chart on Military and defense - Year-over-year growth 2023-2028 (%)
      • Data Table on Military and defense - Year-over-year growth 2023-2028 (%)
    • 6.5 Transportation - Market size and forecast 2023-2028
      • Chart on Transportation - Market size and forecast 2023-2028 ($ million)
      • Data Table on Transportation - Market size and forecast 2023-2028 ($ million)
      • Chart on Transportation - Year-over-year growth 2023-2028 (%)
      • Data Table on Transportation - Year-over-year growth 2023-2028 (%)
    • 6.6 Agriculture - Market size and forecast 2023-2028
      • Chart on Agriculture - Market size and forecast 2023-2028 ($ million)
      • Data Table on Agriculture - Market size and forecast 2023-2028 ($ million)
      • Chart on Agriculture - Year-over-year growth 2023-2028 (%)
      • Data Table on Agriculture - Year-over-year growth 2023-2028 (%)
    • 6.7 Others - Market size and forecast 2023-2028
      • Chart on Others - Market size and forecast 2023-2028 ($ million)
      • Data Table on Others - Market size and forecast 2023-2028 ($ million)
      • Chart on Others - Year-over-year growth 2023-2028 (%)
      • Data Table on Others - Year-over-year growth 2023-2028 (%)
    • 6.8 Market opportunity by End-user
      • Market opportunity by End-user ($ million)
      • Data Table on Market opportunity by End-user ($ million)

    7 Market Segmentation by Technology

    • 7.1 Market segments
      • Chart on Technology - Market share 2023-2028 (%)
      • Data Table on Technology - Market share 2023-2028 (%)
    • 7.2 Comparison by Technology
      • Chart on Comparison by Technology
      • Data Table on Comparison by Technology
    • 7.3 Optical - Market size and forecast 2023-2028
      • Chart on Optical - Market size and forecast 2023-2028 ($ million)
      • Data Table on Optical - Market size and forecast 2023-2028 ($ million)
      • Chart on Optical - Year-over-year growth 2023-2028 (%)
      • Data Table on Optical - Year-over-year growth 2023-2028 (%)
    • 7.4 Radar - Market size and forecast 2023-2028
      • Chart on Radar - Market size and forecast 2023-2028 ($ million)
      • Data Table on Radar - Market size and forecast 2023-2028 ($ million)
      • Chart on Radar - Year-over-year growth 2023-2028 (%)
      • Data Table on Radar - Year-over-year growth 2023-2028 (%)
    • 7.5 Market opportunity by Technology
      • Market opportunity by Technology ($ million)
      • Data Table on Market opportunity by Technology ($ million)

    8 Customer Landscape

    • 8.1 Customer landscape overview
      • Analysis of price sensitivity, lifecycle, customer purchase basket, adoption rates, and purchase criteria

    9 Geographic Landscape

    • 9.1 Geographic segmentation
      • Chart on Market share by geography 2023-2028 (%)
      • Data Table on Market share by geography 2023-2028 (%)
    • 9.2 Geographic comparison
      • Chart on Geographic comparison
      • Data Table on Geographic comparison
    • 9.3 North America - Market size and forecast 2023-2028
      • Chart on North America - Market size and forecast 2023-2028 ($ million)
      • Data Table on North America - Market size and forecast 2023-2028 ($ million)
      • Chart on North America - Year-over-year growth 2023-2028 (%)
      • Data Table on North America - Year-over-year growth 2023-2028 (%)
    • 9.4 APAC - Market size and forecast 2023-2028
      • Chart on APAC - Market size and forecast 2023-2028 ($ million)
      • Data Table on APAC - Market size and forecast 2023-2028 ($ million)
      • Chart on APAC - Year-over-year growth 2023-2028 (%)
      • Data Table on APAC - Year-over-year growth 2023-2028 (%)
    • 9.5 Europe - Market size and forecast 2023-2028
      • Chart on Europe - Market size and forecast 2023-2028 ($ million)
      • Data Table on Europe - Market size and forecast 2023-2028 ($ million)
      • Chart on Europe - Year-over-year growth 2023-2028 (%)
      • Data Table on Europe - Year-over-year growth 2023-2028 (%)
    • 9.6 South America - Market size and forecast 2023-2028
      • Chart on South America - Market size and forecast 2023-2028 ($ million)
      • Data Table on South America - Market size and forecast 2023-2028 ($ million)
      • Chart on South America - Year-over-year growth 2023-2028 (%)
      • Data Table on South America - Year-over-year growth 2023-2028 (%)
    • 9.7 Middle East and Africa - Market size and forecast 2023-2028
      • Chart on Middle East and Africa - Market size and forecast 2023-2028 ($ million)
      • Data Table on Middle East and Africa - Market size and forecast 2023-2028 ($ million)
      • Chart on Middle East and Africa - Year-over-year growth 2023-2028 (%)
      • Data Table on Middle East and Africa - Year-over-year growth 2023-2028 (%)
    • 9.8 US - Market size and forecast 2023-2028
      • Chart on US - Market size and forecast 2023-2028 ($ million)
      • Data Table on US - Market size and forecast 2023-2028 ($ million)
      • Chart on US - Year-over-year growth 2023-2028 (%)
      • Data Table on US - Year-over-year growth 2023-2028 (%)
    • 9.9 China - Market size and forecast 2023-2028
      • Chart on China - Market size and forecast 2023-2028 ($ million)
      • Data Table on China - Market size and forecast 2023-2028 ($ million)
      • Chart on China - Year-over-year growth 2023-2028 (%)
      • Data Table on China - Year-over-year growth 2023-2028 (%)
    • 9.10 Russia - Market size and forecast 2023-2028
      • Chart on Russia - Market size and forecast 2023-2028 ($ million)
      • Data Table on Russia - Market size and forecast 2023-2028 ($ million)
      • Chart on Russia - Year-over-year growth 2023-2028 (%)
      • Data Table on Russia - Year-over-year growth 2023-2028 (%)
    • 9.11 France - Market size and forecast 2023-2028
      • Chart on France - Market size and forecast 2023-2028 ($ million)
      • Data Table on France - Market size and forecast 2023-2028 ($ million)
      • Chart on France - Year-over-year growth 2023-2028 (%)
      • Data Table on France - Year-over-year growth 2023-2028 (%)
    • 9.12 Japan - Market size and forecast 2023-2028
      • Chart on Japan - Market size and forecast 2023-2028 ($ million)
      • Data Table on Japan - Market size and forecast 2023-2028 ($ million)
      • Chart on Japan - Year-over-year growth 2023-2028 (%)
      • Data Table on Japan - Year-over-year growth 2023-2028 (%)
    • 9.13 Market opportunity by geography
      • Market opportunity by geography ($ million)
      • Data Tables on Market opportunity by geography ($ million)

    10 Drivers, Challenges, and Opportunity/Restraints

    • 10.1 Market drivers
      • 10.2 Market challenges
        • 10.3 Impact of drivers and challenges
          • Impact of drivers and challenges in 2023 and 2028
        • 10.4 Market opportunities/restraints

          11 Competitive Landscape

          • 11.1 Overview
            • 11.2 Competitive Landscape
              • Overview on criticality of inputs and factors of differentiation
            • 11.3 Landscape disruption
              • Overview on factors of disruption
            • 11.4 Industry risks
              • Impact of key risks on business

            12 Competitive Analysis

            • 12.1 Companies profiled
              • Companies covered
            • 12.2 Market positioning of companies
              • Matrix on companies position and classification
            • 12.3 Airbus SE
              • Airbus SE - Overview
              • Airbus SE - Business segments
              • Airbus SE - Key news
              • Airbus SE - Key offerings
              • Airbus SE - Segment focus
            • 12.4 BlackSky Global LLC
              • BlackSky Global LLC - Overview
              • BlackSky Global LLC - Product / Service
              • BlackSky Global LLC - Key offerings
            • 12.5 European Space Imaging GmbH
              • European Space Imaging GmbH - Overview
              • European Space Imaging GmbH - Product / Service
              • European Space Imaging GmbH - Key offerings
            • 12.6 ICEYE Oy
              • ICEYE Oy - Overview
              • ICEYE Oy - Product / Service
              • ICEYE Oy - Key offerings
            • 12.7 Imagesat International I.S.I Ltd.
              • Imagesat International I.S.I Ltd. - Overview
              • Imagesat International I.S.I Ltd. - Product / Service
              • Imagesat International I.S.I Ltd. - Key offerings
            • 12.8 L3Harris Technologies Inc.
              • L3Harris Technologies Inc. - Overview
              • L3Harris Technologies Inc. - Business segments
              • L3Harris Technologies Inc. - Key news
              • L3Harris Technologies Inc. - Key offerings
              • L3Harris Technologies Inc. - Segment focus
            • 12.9 MapTiler AG
              • MapTiler AG - Overview
              • MapTiler AG - Product / Service
              • MapTiler AG - Key offerings
            • 12.10 Maxar Technologies Inc.
              • Maxar Technologies Inc. - Overview
              • Maxar Technologies Inc. - Product / Service
              • Maxar Technologies Inc. - Key news
              • Maxar Technologies Inc. - Key offerings
            • 12.11 Planet Labs PBC
              • Planet Labs PBC - Overview
              • Planet Labs PBC - Product / Service
              • Planet Labs PBC - Key offerings
            • 12.12 Satellogic SA
              • Satellogic SA - Overview
              • Satellogic SA - Product / Service
              • Satellogic SA - Key offerings
            • 12.13 SkyWatch Space Applications Inc.
              • SkyWatch Space Applications Inc. - Overview
              • SkyWatch Space Applications Inc. - Product / Service
              • SkyWatch Space Applications Inc. - Key offerings
            • 12.14 SpaceKnow Inc.
              • SpaceKnow Inc. - Overview
              • SpaceKnow Inc. - Product / Service
              • SpaceKnow Inc. - Key offerings
            • 12.15 Thales Group
              • Thales Group - Overview
              • Thales Group - Business segments
              • Thales Group - Key news
              • Thales Group - Key offerings
              • Thales Group - Segment focus

            13 Appendix

            • 13.1 Scope of the report
              • 13.2 Inclusions and exclusions checklist
                • Inclusions checklist
                • Exclusions checklist
              • 13.3 Currency conversion rates for US$
                • Currency conversion rates for US$
              • 13.4 Research methodology
                • Research methodology
              • 13.5 Data procurement
                • Information sources
              • 13.6 Data validation
                • Data validation
              • 13.7 Validation techniques employed for market sizing
                • Validation techniques employed for market sizing
              • 13.8 Data synthesis
                • Data synthesis
              • 13.9 360 degree market analysis
                • 360 degree market analysis
              • 13.10 List of abbreviations
                • List of abbreviations

              Research Methodology

              Technavio presents a detailed picture of the market by way of study, synthesis, and summation of data from multiple sources. The analysts have presented the various facets of the market with a particular focus on identifying the key industry influencers. The data thus presented is comprehensive, reliable, and the result of extensive research, both primary and secondary.

              INFORMATION SOURCES

              Primary sources

              • Manufacturers and suppliers
              • Channel partners
              • Industry experts
              • Strategic decision makers

              Secondary sources

              • Industry journals and periodicals
              • Government data
              • Financial reports of key industry players
              • Historical data
              • Press releases

              DATA ANALYSIS

              Data Synthesis

              • Collation of data
              • Estimation of key figures
              • Analysis of derived insights

              Data Validation

              • Triangulation with data models
              • Reference against proprietary databases
              • Corroboration with industry experts

              REPORT WRITING

              Qualitative

              • Market drivers
              • Market challenges
              • Market trends
              • Five forces analysis

              Quantitative

              • Market size and forecast
              • Market segmentation
              • Geographical insights
              • Competitive landscape

              Interested in this report?

              Get your sample now to see our research methodology and insights!

              Download Now

              Frequently Asked Questions

              Commercial Satellite Imaging market growth will increase by $ 2331.5 mn during 2024-2028.

              The Commercial Satellite Imaging market is expected to grow at a CAGR of 7.66% during 2024-2028.

              Commercial Satellite Imaging market is segmented by End-user( Government, Military and defense, Transportation, Agriculture, Others) Technology( Optical, Radar, Europe, South America, MEA)

              Airbus SE, BlackSky Global LLC, European Space Imaging GmbH, ICEYE Oy, Imagesat International I.S.I Ltd., L3Harris Technologies Inc., MapTiler AG, Maxar Technologies Inc., Planet Labs PBC, Satellogic SA, SkyWatch Space Applications Inc., SpaceKnow Inc., Thales Group are a few of the key vendors in the Commercial Satellite Imaging market.

              APAC will register the highest growth rate of 31% among the other regions. Therefore, the Commercial Satellite Imaging market in APAC is expected to garner significant business opportunities for the vendors during the forecast period.

              US, China, Russia, France, Japan

              • Advances in satellite imaging technologiesImages provided by satellites are interpreted to gather valuable data and information is the driving factor this market.
              • which are used by government organizations for sectors such as defense is the driving factor this market.
              • oil and natural gas is the driving factor this market.
              • mining is the driving factor this market.
              • meteorology is the driving factor this market.
              • and agriculture. Innovative image-enhancing equipment is the driving factor this market.
              • including high-resolution cameras and advanced remote-sensing technology is the driving factor this market.
              • has enhanced the quality of satellite-based EO images. These images are used extensively in the defense is the driving factor this market.
              • science is the driving factor this market.
              • and R and D domains. The technology used to capture satellite images has been improving over the years is the driving factor this market.
              • thereby raising the expectations of the end-users. For example is the driving factor this market.
              • users have started demanding more clarity in the images captured by EO satellites so that they can use these images effectively for applications such as weather information collection and forecasting is the driving factor this market.
              • farming is the driving factor this market.
              • and forestry. Vendors have strengthened their R and D efforts to develop innovative equipment such as superior lenses. They are also developing innovative remote sensing technologies and high-resolution cameras to improve the quality of images captured by satellites. In December 2020 is the driving factor this market.
              • Capella Space launched its highest resolution commercial SAR imagery available in the market at 50 cm x 50 cm resolution in the new Spotlight or Spot imaging mode. In April 2021 is the driving factor this market.
              • the company named Satellite Vu raised $5 million to launch its first thermal imaging satellites by 2022.   is the driving factor this market.

              The Commercial Satellite Imaging market vendors should focus on grabbing business opportunities from the Government segment as it accounted for the largest market share in the base year.