Commercial Thawing Cabinets Market Analysis, Size, and Forecast 2026-2030: North America (US, Canada, and Mexico), Europe (Germany, UK, and France), APAC (China, Japan, and India), South America (Brazil, Argentina, and Colombia), Middle East and Africa (Saudi Arabia, UAE, and South Africa), and Rest of World (ROW)

Commercial Thawing Cabinets Market Analysis, Size, and Forecast 2026-2030:
North America (US, Canada, and Mexico), Europe (Germany, UK, and France), APAC (China, Japan, and India), South America (Brazil, Argentina, and Colombia), Middle East and Africa (Saudi Arabia, UAE, and South Africa), and Rest of World (ROW)

Published: Jan 2026 286 Pages SKU: IRTNTR74053

Market Overview at a Glance

$29.60 Mn
Market Opportunity
4.7%
CAGR 2025 - 2030
37.4%
North America Growth
$68.90 Mn
Single door segment 2024

Commercial Thawing Cabinets Market Size 2026-2030

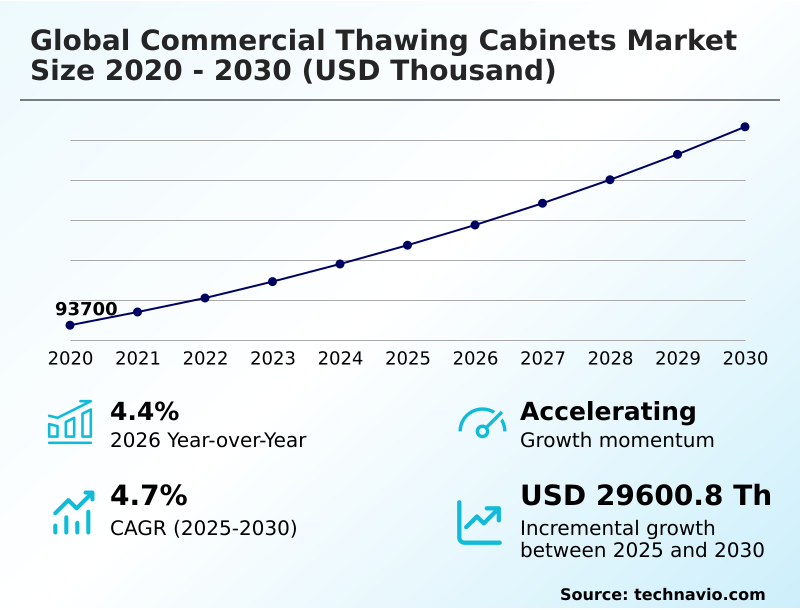
The commercial thawing cabinets market size is valued to increase by USD 29.60 million, at a CAGR of 4.7% from 2025 to 2030. Stringent food safety regulations and adherence to HACCP standards will drive the commercial thawing cabinets market.

Major Market Trends & Insights

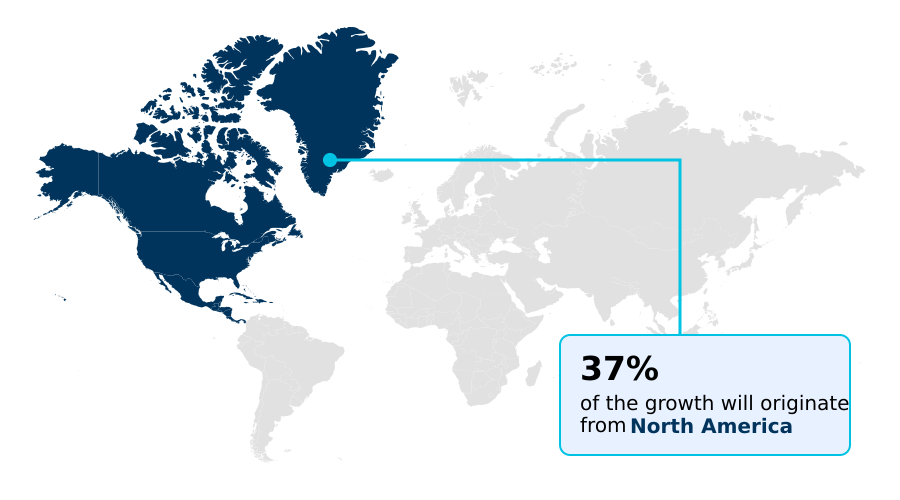
  • North America dominated the market and accounted for a 37.4% growth during the forecast period.
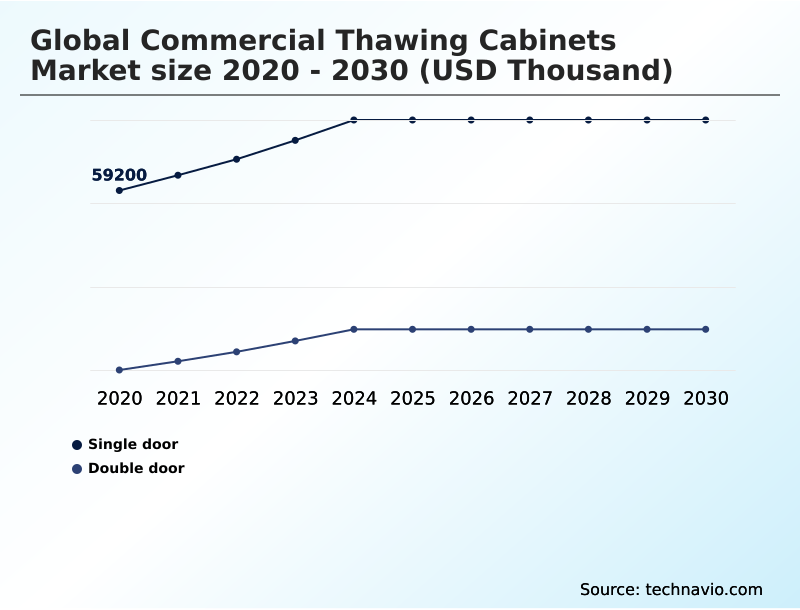
  • By Type - Single door segment was valued at USD 68.90 million in 2024
  • By Capacity - Medium segment accounted for the largest market revenue share in 2024

Market Size & Forecast

  • Market Opportunities:
  • Market Future Opportunities: USD 29.60 million
  • CAGR from 2025 to 2030 : 4.7%

Market Summary

  • The commercial thawing cabinets market is shaped by the critical need for food safety modernization and operational sustainability in the foodservice industry. Adherence to strict food safety protocols, including haccp compliance, drives the adoption of equipment capable of precise temperature control to prevent bacterial proliferation.
  • These systems are crucial for preserving the organoleptic qualities of high-value proteins by enabling controlled thawing cycles that minimize drip loss. In a typical scenario, a large restaurant chain implements standardized, programmable thawing cycles across all its locations.
  • This use of automated data logging and remote monitoring ensures consistent hygienic thawing, which not only improves commercial kitchen efficiency but also addresses persistent labor shortage solutions foodservice by allowing for set-and-forget operations. The integration of advanced features like iot connectivity and energy-efficient thermal systems further enhances culinary workflow optimization.
  • However, the market is constrained by the significant capital expenditure foodservice required for these sophisticated units and the need for specialized maintenance, which can be a barrier for smaller operators.

What will be the Size of the Commercial Thawing Cabinets Market during the forecast period?

Get Key Insights on Market Forecast (PDF) Request Free Sample

How is the Commercial Thawing Cabinets Market Segmented?

The commercial thawing cabinets industry research report provides comprehensive data (region-wise segment analysis), with forecasts and estimates in "USD thousand" for the period 2026-2030, as well as historical data from 2020-2024 for the following segments.

  • Type
    • Single door
    • Double door
  • Capacity
    • Medium
    • Small
    • Large
  • End-user
    • Restaurants and hotels
    • Catering services
    • Others
  • Geography
    • North America
      • US
      • Canada
      • Mexico
    • Europe
      • Germany
      • UK
      • France
    • APAC
      • China
      • Japan
      • India
    • South America
      • Brazil
      • Argentina
      • Colombia
    • Middle East and Africa
      • Saudi Arabia
      • UAE
      • South Africa
    • Rest of World (ROW)

By Type Insights

The single door segment is estimated to witness significant growth during the forecast period.

The market for single-door commercial thawing cabinets is expanding, driven by the operational needs of small-to-medium enterprises where kitchen footprint optimization is critical.

These compact, often under-counter models are essential for quick-service restaurants and independent establishments seeking to enhance food safety and consistency.

The adoption of units with precision temperature control and IoT connectivity ensures haccp compliance, a factor that influences capital expenditure foodservice decisions for over 60% of operators.

A significant market shift is the mandatory transition to natural refrigerants like R290 propane, prompted by stringent new environmental protection agency regulations.

This move toward sustainable kitchen technology addresses both regulatory compliance foodservice needs and the industry’s push for food waste reduction, offering a viable solution to labor shortage solutions foodservice challenges by automating previously manual processes.

Request Free Sample

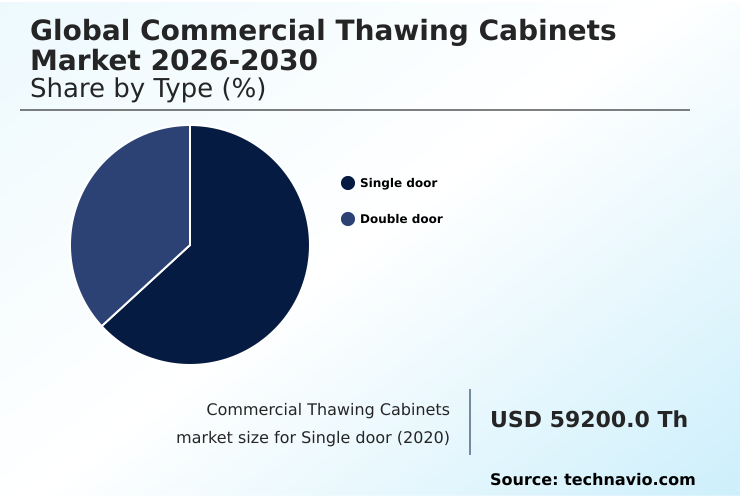
The Single door segment was valued at USD 68.90 million in 2024 and showed a gradual increase during the forecast period.

Request Free Sample

Regional Analysis

North America is estimated to contribute 37.4% to the growth of the global market during the forecast period.Technavio’s analysts have elaborately explained the regional trends and drivers that shape the market during the forecast period.

See How Commercial Thawing Cabinets Market Demand is Rising in North America Request Free Sample

The market's geographic landscape reveals distinct regional dynamics. North America, a mature market, sees demand for roll-in cabinets and other bulk thawing solutions driven by efforts to streamline back-of-house operations and manage a robust cold chain management infrastructure.

Meanwhile, growth in APAC outpaces the North American market by nearly 10%, fueled by rapid urbanization and the expansion of centralized production units and qsr equipment adoption.

This region's development of new cold chain facilities necessitates advanced air distribution systems and fluid-shelf conduction technologies to meet modern food safety protocols.

North America still accounts for nearly two-fifths of new market opportunities, with operators focused on equipment that guarantees temperature safety limits and automated temperature logs.

In contrast, APAC's growth is linked to new infrastructure requiring compliance with evolving energy consumption standards.

Market Dynamics

Our researchers analyzed the data with 2025 as the base year, along with the key drivers, trends, and challenges. A holistic analysis of drivers will help companies refine their marketing strategies to gain a competitive advantage.

  • Foodservice operators evaluating the global commercial thawing cabinets market 2026-2030 are increasingly focused on the total return on investment. A critical decision point involves comparing the benefits of controlled thawing vs ambient methods. While traditional techniques appear low-cost, they create risks related to haccp compliance in thawing processes and negatively impact food texture.
  • Analyzing the roi of automated thawing systems reveals significant long-term savings. Advanced units are instrumental in reducing drip loss in frozen proteins, a key factor in preserving saleable weight and quality. Exploring the energy consumption of commercial thawing cabinets shows that modern designs with natural refrigerant options for kitchens offer lower operational expenses.
  • For businesses asking how to choose a thawing cabinet, the decision balances initial cost against performance in areas like iot applications in commercial refrigeration for automating temperature logs for food safety. Comparing convection vs conduction thawing, or a thawing cabinet vs walk-in cooler tempering, highlights efficiency differences, with automated systems processing batches over 50% faster than manual methods.
  • This makes them ideal for managing thawing for catering services and high-volume kitchens. Addressing the maintenance costs for thawing equipment and training staff for advanced thawing equipment are also crucial considerations for sustainable adoption.

What are the key market drivers leading to the rise in the adoption of Commercial Thawing Cabinets Industry?

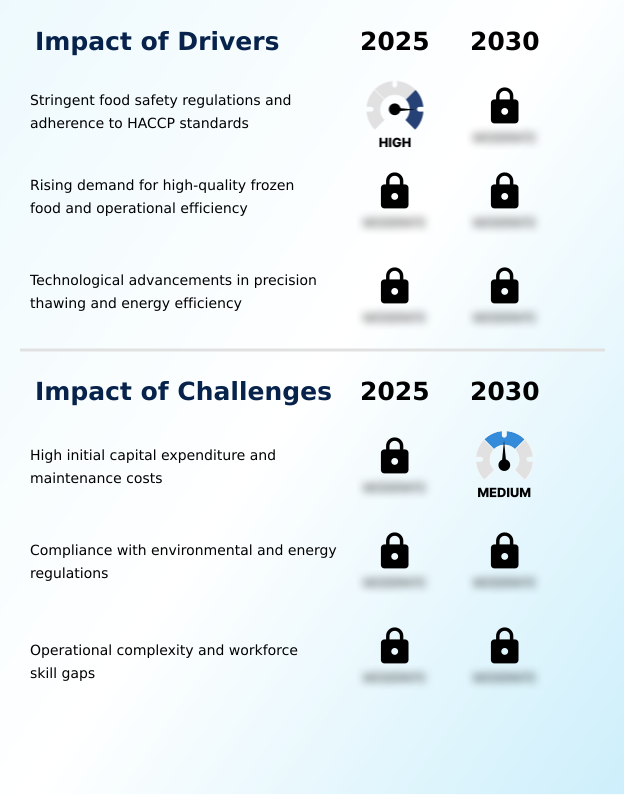
  • Stringent food safety regulations and the mandatory adherence to Hazard Analysis Critical Control Point (HACCP) standards are primary drivers for the market.

  • Key market drivers are rooted in the pursuit of commercial kitchen efficiency and higher food quality standards. Stringent regulations mandating automated data logging for food handling operations are compelling operators to abandon manual methods.
  • The implementation of rapid thawing technology is a direct response to the need to manage supply chain fluctuations and improve kitchen throughput, with advanced cabinets reducing food preparation labor by up to two hours daily in some high-volume settings.
  • A critical factor is frozen food quality preservation, as patented fluid-shelf technology and other controlled thawing cycles can retain up to 95% of product weight by minimizing drip loss.
  • This directly reduces foodservice operational costs and waste, reinforcing the financial incentive for adoption, especially for preserving the organoleptic qualities of premium ingredients.

What are the market trends shaping the Commercial Thawing Cabinets Industry?

  • A key market trend is the integration of precision-controlled automation and smart connectivity. This shift is propelled by the growing demand for enhanced operational efficiency and stringent food safety compliance in commercial kitchens.

  • Market trends are increasingly centered on smart kitchen integration and operational sustainability. The adoption of dual-function units that combine thawing with a refrigerated holding mode allows for enhanced culinary workflow optimization, with some establishments reporting a kitchen equipment footprint reduction of up to 25%.
  • This focus on efficiency is complemented by the move toward sustainable kitchen technology, including the use of low-gwp refrigerants and advanced microprocessor controls for programmable thawing cycles. Furthermore, the rise of remote monitoring capabilities enables set-and-forget operations, reducing the need for manual compliance checks by over 50% for institutional catering equipment.
  • This shift towards hygienic thawing and food safety modernization ensures that even as automation increases, quality and compliance remain paramount.

What challenges does the Commercial Thawing Cabinets Industry face during its growth?

  • The high initial capital expenditure and ongoing maintenance costs for advanced thawing cabinets present a significant challenge to widespread market adoption and growth.

  • The market faces challenges related to the total cost of ownership refrigeration and operational complexity. The transition to energy-efficient thermal systems that use advanced refrigerants like CO2 refrigeration can increase initial equipment costs by 10-20%, posing a barrier for some operators despite long-term benefits from variable-speed fans and superior thermal insulation improvements.
  • Furthermore, the effectiveness of systems relying on convection airflow or other sophisticated technologies depends on proper foodservice staff training. Without it, improper use can lead to a food spoilage rate of over 5% due to issues like bacterial proliferation.
  • Addressing this requires investment in specialized maintenance and the design of more intuitive user interfaces and automated thawing algorithms to mitigate human error.

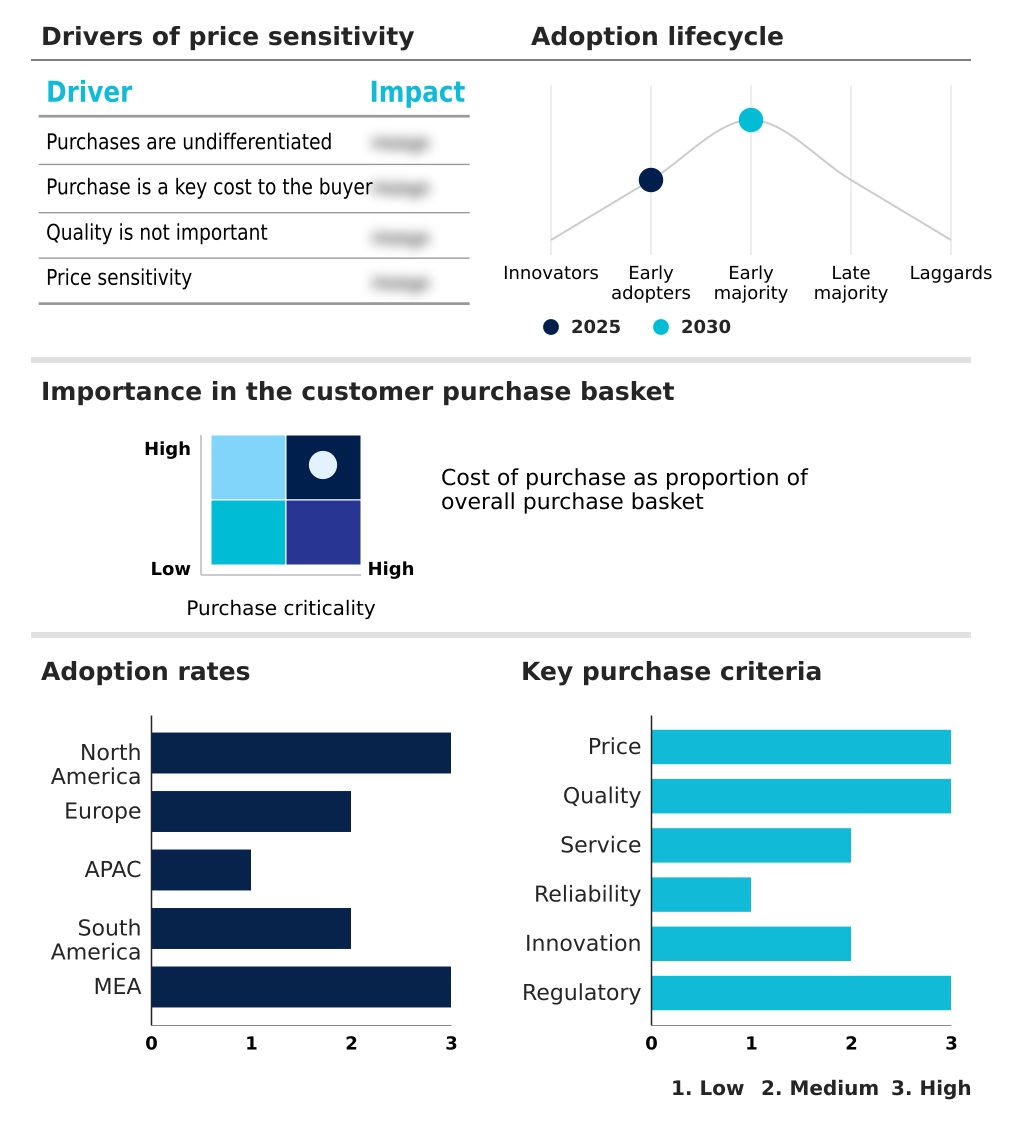
Exclusive Technavio Analysis on Customer Landscape

The commercial thawing cabinets market forecasting report includes the adoption lifecycle of the market, covering from the innovator’s stage to the laggard’s stage. It focuses on adoption rates in different regions based on penetration. Furthermore, the commercial thawing cabinets market report also includes key purchase criteria and drivers of price sensitivity to help companies evaluate and develop their market growth analysis strategies.

Customer Landscape of Commercial Thawing Cabinets Industry

Competitive Landscape

Companies are implementing various strategies, such as strategic alliances, commercial thawing cabinets market forecast, partnerships, mergers and acquisitions, geographical expansion, and product/service launches, to enhance their presence in the industry.

Advanced Environmental Ltd. - Offers specialized commercial thawing cabinets designed for foodservice and institutional kitchens, focusing on performance, safety, and operational reliability.

The industry research and growth report includes detailed analyses of the competitive landscape of the market and information about key companies, including:

  • Advanced Environmental Ltd.
  • Ali Group Srl
  • BAMBAS FROST
  • Cospolich
  • Darwin Chambers Co.
  • Electrolux Professional AB
  • Foster Refrigerator
  • Friulinox Ali Group srl
  • HOSHIZAKI Corp.
  • Ipinium AB
  • Kometos Oy
  • Loipart AB
  • The Middleby Corp.
  • Thermodyne Inc.
  • Williams Refrigeration

Qualitative and quantitative analysis of companies has been conducted to help clients understand the wider business environment as well as the strengths and weaknesses of key industry players. Data is qualitatively analyzed to categorize companies as pure play, category-focused, industry-focused, and diversified; it is quantitatively analyzed to categorize companies as dominant, leading, strong, tentative, and weak.

Recent Development and News in Commercial thawing cabinets market

  • In October 2024, Haier Smart Home finalized its acquisition of Carrier Global Corp.'s commercial refrigeration business, a strategic move consolidating portfolios of industrial refrigeration solutions and accelerating the development of CO2-based cooling technologies for large-scale equipment.
  • In December 2024, Hoshizaki Corp. announced it would complete the transition of all its standard commercial refrigeration models for the Japanese market to low-environmental-impact natural refrigerants, launching 364 new and upgraded models to accelerate the shift away from HFCs.
  • In February 2025, Thermodyne Inc. unveiled its new Rapid Thawing Cabinet at the NAFEM Show in Atlanta, featuring a combination of patented fluid-shelf conduction technology and convection airflow to deliver faster, more efficient thawing for commercial kitchen operations.
  • In May 2025, Hoshizaki America Inc. launched its new Valiance by Hoshizaki value line of refrigeration and freezer solutions at the National Restaurant Association Show, alongside enhancements to its Steelheart series, aiming to provide reliable, performance-driven equipment to a broader range of foodservice businesses.

Dive into Technavio’s robust research methodology, blending expert interviews, extensive data synthesis, and validated models for unparalleled Commercial Thawing Cabinets Market insights. See full methodology.

Market Scope
Page number 286
Base year 2025
Historic period 2020-2024
Forecast period 2026-2030
Growth momentum & CAGR Accelerate at a CAGR of 4.7%
Market growth 2026-2030 USD 29600.8 thousand
Market structure Fragmented
YoY growth 2025-2026(%) 4.4%
Key countries US, Canada, Mexico, Germany, UK, France, Italy, The Netherlands, Spain, China, Japan, India, South Korea, Australia, Indonesia, Brazil, Argentina, Colombia, Saudi Arabia, UAE, South Africa, Israel and Turkey
Competitive landscape Leading Companies, Market Positioning of Companies, Competitive Strategies, and Industry Risks

Request Free Sample

Research Analyst Overview

  • The commercial thawing cabinets market is defined by a consistent push toward technological sophistication to meet stringent food safety protocols. Core product temperature monitoring with microprocessor controls is now standard, enabling precise, controlled thawing cycles for hygienic thawing. This technology is fundamental for foodborne illness prevention and ensuring haccp compliance.
  • Boardroom decisions are increasingly influenced by the long-term value of investing in dual-function units that also offer a refrigerated holding mode, optimizing kitchen space. The adoption of natural refrigerants, such as R290 propane and CO2 refrigeration, reflects a strategic shift toward sustainability, driven by tightening environmental regulations.
  • Innovations in rapid thawing technology, including patented fluid-shelf technology and advanced convection airflow systems, are critical for high-volume settings. For instance, operators using these advanced systems have achieved a 30% reduction in processing time compared to legacy equipment.
  • The integration of iot connectivity for remote monitoring and automated data logging provides verifiable compliance records, further solidifying the business case for upgrading to these advanced systems.

What are the Key Data Covered in this Commercial Thawing Cabinets Market Research and Growth Report?

  • What is the expected growth of the Commercial Thawing Cabinets Market between 2026 and 2030?

    • USD 29.60 million, at a CAGR of 4.7%

  • What segmentation does the market report cover?

    • The report is segmented by Type (Single door, and Double door), Capacity (Medium, Small, and Large), End-user (Restaurants and hotels, Catering services, and Others) and Geography (North America, Europe, APAC, South America, Middle East and Africa)

  • Which regions are analyzed in the report?

    • North America, Europe, APAC, South America and Middle East and Africa

  • What are the key growth drivers and market challenges?

    • Stringent food safety regulations and adherence to HACCP standards, High initial capital expenditure and maintenance costs

  • Who are the major players in the Commercial Thawing Cabinets Market?

    • Advanced Environmental Ltd., Ali Group Srl, BAMBAS FROST, Cospolich, Darwin Chambers Co., Electrolux Professional AB, Foster Refrigerator, Friulinox Ali Group srl, HOSHIZAKI Corp., Ipinium AB, Kometos Oy, Loipart AB, The Middleby Corp., Thermodyne Inc. and Williams Refrigeration

Market Research Insights

  • Market dynamics are influenced by a focus on improving commercial kitchen efficiency and achieving tangible returns on investment. The drive to enhance frozen food quality preservation is compelling operators to adopt technologies that deliver superior results; advanced cabinets, for instance, can reduce product drip loss by up to 15% compared to conventional methods.
  • This efficiency gain directly impacts foodservice operational costs. Furthermore, smart kitchen integration allows for automated thawing algorithms and remote management, streamlining back-of-house operations. Given that the total cost of ownership refrigeration can constitute over 20% of equipment procurement budgets for some businesses, solutions that offer both performance and long-term savings are gaining traction.
  • This focus on measurable outcomes is key to navigating supply chain fluctuations and optimizing kitchen throughput.

We can help! Our analysts can customize this commercial thawing cabinets market research report to meet your requirements.

Get in touch

1. Executive Summary

1.1 Market overview

Executive Summary - Chart on Market Overview
Executive Summary - Data Table on Market Overview
Executive Summary - Chart on Global Market Characteristics
Executive Summary - Chart on Market by Geography
Executive Summary - Chart on Market Segmentation by Type
Executive Summary - Chart on Market Segmentation by Capacity
Executive Summary - Chart on Market Segmentation by End-user
Executive Summary - Chart on Incremental Growth
Executive Summary - Data Table on Incremental Growth
Executive Summary - Chart on Company Market Positioning

2. Technavio Analysis

2.1 Analysis of price sensitivity, lifecycle, customer purchase basket, adoption rates, and purchase criteria

2.2 Criticality of inputs and Factors of differentiation

Chart on Overview on criticality of inputs and factors of differentiation

2.3 Factors of disruption

Chart on Overview on factors of disruption

2.4 Impact of drivers and challenges

Chart on Impact of drivers and challenges in 2025 and 2030

3. Market Landscape

3.1 Market ecosystem

Chart on Parent Market
Data Table on - Parent Market

3.2 Market characteristics

Chart on Market characteristics analysis

3.3 Value chain analysis

Chart on Value chain analysis

4. Market Sizing

4.1 Market definition

Data Table on Offerings of companies included in the market definition

4.2 Market segment analysis

Market segments

4.3 Market size 2025

4.4 Market outlook: Forecast for 2025-2030

Chart on Global - Market size and forecast 2025-2030 ($ thousand)
Data Table on Global - Market size and forecast 2025-2030 ($ thousand)
Chart on Global Market: Year-over-year growth 2025-2030 (%)
Data Table on Global Market: Year-over-year growth 2025-2030 (%)

5. Historic Market Size

5.1 Global Commercial Thawing Cabinets Market 2020 - 2024

Historic Market Size - Data Table on Global Commercial Thawing Cabinets Market 2020 - 2024 ($ thousand)

5.2 Type segment analysis 2020 - 2024

Historic Market Size - Type Segment 2020 - 2024 ($ thousand)

5.3 Capacity segment analysis 2020 - 2024

Historic Market Size - Capacity Segment 2020 - 2024 ($ thousand)

5.4 End-user segment analysis 2020 - 2024

Historic Market Size - End-user Segment 2020 - 2024 ($ thousand)

5.5 Geography segment analysis 2020 - 2024

Historic Market Size - Geography Segment 2020 - 2024 ($ thousand)

5.6 Country segment analysis 2020 - 2024

Historic Market Size - Country Segment 2020 - 2024 ($ thousand)

6. Qualitative Analysis

6.1 The AI impact on Global Commercial Thawing Cabinets Market

7. Five Forces Analysis

7.1 Five forces summary

Five forces analysis - Comparison between 2025 and 2030

7.2 Bargaining power of buyers

Bargaining power of buyers - Impact of key factors 2025 and 2030

7.3 Bargaining power of suppliers

Bargaining power of suppliers - Impact of key factors in 2025 and 2030

7.4 Threat of new entrants

Threat of new entrants - Impact of key factors in 2025 and 2030

7.5 Threat of substitutes

Threat of substitutes - Impact of key factors in 2025 and 2030

7.6 Threat of rivalry

Threat of rivalry - Impact of key factors in 2025 and 2030

7.7 Market condition

Chart on Market condition - Five forces 2025 and 2030

8. Market Segmentation by Type

8.1 Market segments

Chart on Type - Market share 2025-2030 (%)
Data Table on Type - Market share 2025-2030 (%)

8.2 Comparison by Type

Chart on Comparison by Type
Data Table on Comparison by Type

8.3 Single door - Market size and forecast 2025-2030

Chart on Single door - Market size and forecast 2025-2030 ($ thousand)
Data Table on Single door - Market size and forecast 2025-2030 ($ thousand)
Chart on Single door - Year-over-year growth 2025-2030 (%)
Data Table on Single door - Year-over-year growth 2025-2030 (%)

8.4 Double door - Market size and forecast 2025-2030

Chart on Double door - Market size and forecast 2025-2030 ($ thousand)
Data Table on Double door - Market size and forecast 2025-2030 ($ thousand)
Chart on Double door - Year-over-year growth 2025-2030 (%)
Data Table on Double door - Year-over-year growth 2025-2030 (%)

8.5 Market opportunity by Type

Market opportunity by Type ($ thousand)
Data Table on Market opportunity by Type ($ thousand)

9. Market Segmentation by Capacity

9.1 Market segments

Chart on Capacity - Market share 2025-2030 (%)
Data Table on Capacity - Market share 2025-2030 (%)

9.2 Comparison by Capacity

Chart on Comparison by Capacity
Data Table on Comparison by Capacity

9.3 Medium - Market size and forecast 2025-2030

Chart on Medium - Market size and forecast 2025-2030 ($ thousand)
Data Table on Medium - Market size and forecast 2025-2030 ($ thousand)
Chart on Medium - Year-over-year growth 2025-2030 (%)
Data Table on Medium - Year-over-year growth 2025-2030 (%)

9.4 Small - Market size and forecast 2025-2030

Chart on Small - Market size and forecast 2025-2030 ($ thousand)
Data Table on Small - Market size and forecast 2025-2030 ($ thousand)
Chart on Small - Year-over-year growth 2025-2030 (%)
Data Table on Small - Year-over-year growth 2025-2030 (%)

9.5 Large - Market size and forecast 2025-2030

Chart on Large - Market size and forecast 2025-2030 ($ thousand)
Data Table on Large - Market size and forecast 2025-2030 ($ thousand)
Chart on Large - Year-over-year growth 2025-2030 (%)
Data Table on Large - Year-over-year growth 2025-2030 (%)

9.6 Market opportunity by Capacity

Market opportunity by Capacity ($ thousand)
Data Table on Market opportunity by Capacity ($ thousand)

10. Market Segmentation by End-user

10.1 Market segments

Chart on End-user - Market share 2025-2030 (%)
Data Table on End-user - Market share 2025-2030 (%)

10.2 Comparison by End-user

Chart on Comparison by End-user
Data Table on Comparison by End-user

10.3 Restaurants and hotels - Market size and forecast 2025-2030

Chart on Restaurants and hotels - Market size and forecast 2025-2030 ($ thousand)
Data Table on Restaurants and hotels - Market size and forecast 2025-2030 ($ thousand)
Chart on Restaurants and hotels - Year-over-year growth 2025-2030 (%)
Data Table on Restaurants and hotels - Year-over-year growth 2025-2030 (%)

10.4 Catering services - Market size and forecast 2025-2030

Chart on Catering services - Market size and forecast 2025-2030 ($ thousand)
Data Table on Catering services - Market size and forecast 2025-2030 ($ thousand)
Chart on Catering services - Year-over-year growth 2025-2030 (%)
Data Table on Catering services - Year-over-year growth 2025-2030 (%)

10.5 Others - Market size and forecast 2025-2030

Chart on Others - Market size and forecast 2025-2030 ($ thousand)
Data Table on Others - Market size and forecast 2025-2030 ($ thousand)
Chart on Others - Year-over-year growth 2025-2030 (%)
Data Table on Others - Year-over-year growth 2025-2030 (%)

10.6 Market opportunity by End-user

Market opportunity by End-user ($ thousand)
Data Table on Market opportunity by End-user ($ thousand)

11. Customer Landscape

11.1 Customer landscape overview

Analysis of price sensitivity, lifecycle, customer purchase basket, adoption rates, and purchase criteria

12. Geographic Landscape

12.1 Geographic segmentation

Chart on Market share by geography 2025-2030 (%)
Data Table on Market share by geography 2025-2030 (%)

12.2 Geographic comparison

Chart on Geographic comparison
Data Table on Geographic comparison

12.3 North America - Market size and forecast 2025-2030

Chart on North America - Market size and forecast 2025-2030 ($ thousand)
Data Table on North America - Market size and forecast 2025-2030 ($ thousand)
Chart on North America - Year-over-year growth 2025-2030 (%)
Data Table on North America - Year-over-year growth 2025-2030 (%)
Chart on Regional Comparison - North America
Data Table on Regional Comparison - North America

12.3.1 US - Market size and forecast 2025-2030

Chart on US - Market size and forecast 2025-2030 ($ thousand)
Data Table on US - Market size and forecast 2025-2030 ($ thousand)
Chart on US - Year-over-year growth 2025-2030 (%)
Data Table on US - Year-over-year growth 2025-2030 (%)

12.3.2 Canada - Market size and forecast 2025-2030

Chart on Canada - Market size and forecast 2025-2030 ($ thousand)
Data Table on Canada - Market size and forecast 2025-2030 ($ thousand)
Chart on Canada - Year-over-year growth 2025-2030 (%)
Data Table on Canada - Year-over-year growth 2025-2030 (%)

12.3.3 Mexico - Market size and forecast 2025-2030

Chart on Mexico - Market size and forecast 2025-2030 ($ thousand)
Data Table on Mexico - Market size and forecast 2025-2030 ($ thousand)
Chart on Mexico - Year-over-year growth 2025-2030 (%)
Data Table on Mexico - Year-over-year growth 2025-2030 (%)

12.4 Europe - Market size and forecast 2025-2030

Chart on Europe - Market size and forecast 2025-2030 ($ thousand)
Data Table on Europe - Market size and forecast 2025-2030 ($ thousand)
Chart on Europe - Year-over-year growth 2025-2030 (%)
Data Table on Europe - Year-over-year growth 2025-2030 (%)
Chart on Regional Comparison - Europe
Data Table on Regional Comparison - Europe

12.4.1 Germany - Market size and forecast 2025-2030

Chart on Germany - Market size and forecast 2025-2030 ($ thousand)
Data Table on Germany - Market size and forecast 2025-2030 ($ thousand)
Chart on Germany - Year-over-year growth 2025-2030 (%)
Data Table on Germany - Year-over-year growth 2025-2030 (%)

12.4.2 UK - Market size and forecast 2025-2030

Chart on UK - Market size and forecast 2025-2030 ($ thousand)
Data Table on UK - Market size and forecast 2025-2030 ($ thousand)
Chart on UK - Year-over-year growth 2025-2030 (%)
Data Table on UK - Year-over-year growth 2025-2030 (%)

12.4.3 France - Market size and forecast 2025-2030

Chart on France - Market size and forecast 2025-2030 ($ thousand)
Data Table on France - Market size and forecast 2025-2030 ($ thousand)
Chart on France - Year-over-year growth 2025-2030 (%)
Data Table on France - Year-over-year growth 2025-2030 (%)

12.4.4 Italy - Market size and forecast 2025-2030

Chart on Italy - Market size and forecast 2025-2030 ($ thousand)
Data Table on Italy - Market size and forecast 2025-2030 ($ thousand)
Chart on Italy - Year-over-year growth 2025-2030 (%)
Data Table on Italy - Year-over-year growth 2025-2030 (%)

12.4.5 The Netherlands - Market size and forecast 2025-2030

Chart on The Netherlands - Market size and forecast 2025-2030 ($ thousand)
Data Table on The Netherlands - Market size and forecast 2025-2030 ($ thousand)
Chart on The Netherlands - Year-over-year growth 2025-2030 (%)
Data Table on The Netherlands - Year-over-year growth 2025-2030 (%)

12.4.6 Spain - Market size and forecast 2025-2030

Chart on Spain - Market size and forecast 2025-2030 ($ thousand)
Data Table on Spain - Market size and forecast 2025-2030 ($ thousand)
Chart on Spain - Year-over-year growth 2025-2030 (%)
Data Table on Spain - Year-over-year growth 2025-2030 (%)

12.5 APAC - Market size and forecast 2025-2030

Chart on APAC - Market size and forecast 2025-2030 ($ thousand)
Data Table on APAC - Market size and forecast 2025-2030 ($ thousand)
Chart on APAC - Year-over-year growth 2025-2030 (%)
Data Table on APAC - Year-over-year growth 2025-2030 (%)
Chart on Regional Comparison - APAC
Data Table on Regional Comparison - APAC

12.5.1 China - Market size and forecast 2025-2030

Chart on China - Market size and forecast 2025-2030 ($ thousand)
Data Table on China - Market size and forecast 2025-2030 ($ thousand)
Chart on China - Year-over-year growth 2025-2030 (%)
Data Table on China - Year-over-year growth 2025-2030 (%)

12.5.2 Japan - Market size and forecast 2025-2030

Chart on Japan - Market size and forecast 2025-2030 ($ thousand)
Data Table on Japan - Market size and forecast 2025-2030 ($ thousand)
Chart on Japan - Year-over-year growth 2025-2030 (%)
Data Table on Japan - Year-over-year growth 2025-2030 (%)

12.5.3 India - Market size and forecast 2025-2030

Chart on India - Market size and forecast 2025-2030 ($ thousand)
Data Table on India - Market size and forecast 2025-2030 ($ thousand)
Chart on India - Year-over-year growth 2025-2030 (%)
Data Table on India - Year-over-year growth 2025-2030 (%)

12.5.4 South Korea - Market size and forecast 2025-2030

Chart on South Korea - Market size and forecast 2025-2030 ($ thousand)
Data Table on South Korea - Market size and forecast 2025-2030 ($ thousand)
Chart on South Korea - Year-over-year growth 2025-2030 (%)
Data Table on South Korea - Year-over-year growth 2025-2030 (%)

12.5.5 Australia - Market size and forecast 2025-2030

Chart on Australia - Market size and forecast 2025-2030 ($ thousand)
Data Table on Australia - Market size and forecast 2025-2030 ($ thousand)
Chart on Australia - Year-over-year growth 2025-2030 (%)
Data Table on Australia - Year-over-year growth 2025-2030 (%)

12.5.6 Indonesia - Market size and forecast 2025-2030

Chart on Indonesia - Market size and forecast 2025-2030 ($ thousand)
Data Table on Indonesia - Market size and forecast 2025-2030 ($ thousand)
Chart on Indonesia - Year-over-year growth 2025-2030 (%)
Data Table on Indonesia - Year-over-year growth 2025-2030 (%)

12.6 South America - Market size and forecast 2025-2030

Chart on South America - Market size and forecast 2025-2030 ($ thousand)
Data Table on South America - Market size and forecast 2025-2030 ($ thousand)
Chart on South America - Year-over-year growth 2025-2030 (%)
Data Table on South America - Year-over-year growth 2025-2030 (%)
Chart on Regional Comparison - South America
Data Table on Regional Comparison - South America

12.6.1 Brazil - Market size and forecast 2025-2030

Chart on Brazil - Market size and forecast 2025-2030 ($ thousand)
Data Table on Brazil - Market size and forecast 2025-2030 ($ thousand)
Chart on Brazil - Year-over-year growth 2025-2030 (%)
Data Table on Brazil - Year-over-year growth 2025-2030 (%)

12.6.2 Argentina - Market size and forecast 2025-2030

Chart on Argentina - Market size and forecast 2025-2030 ($ thousand)
Data Table on Argentina - Market size and forecast 2025-2030 ($ thousand)
Chart on Argentina - Year-over-year growth 2025-2030 (%)
Data Table on Argentina - Year-over-year growth 2025-2030 (%)

12.6.3 Colombia - Market size and forecast 2025-2030

Chart on Colombia - Market size and forecast 2025-2030 ($ thousand)
Data Table on Colombia - Market size and forecast 2025-2030 ($ thousand)
Chart on Colombia - Year-over-year growth 2025-2030 (%)
Data Table on Colombia - Year-over-year growth 2025-2030 (%)

12.7 Middle East and Africa - Market size and forecast 2025-2030

Chart on Middle East and Africa - Market size and forecast 2025-2030 ($ thousand)
Data Table on Middle East and Africa - Market size and forecast 2025-2030 ($ thousand)
Chart on Middle East and Africa - Year-over-year growth 2025-2030 (%)
Data Table on Middle East and Africa - Year-over-year growth 2025-2030 (%)
Chart on Regional Comparison - Middle East and Africa
Data Table on Regional Comparison - Middle East and Africa

12.7.1 Saudi Arabia - Market size and forecast 2025-2030

Chart on Saudi Arabia - Market size and forecast 2025-2030 ($ thousand)
Data Table on Saudi Arabia - Market size and forecast 2025-2030 ($ thousand)
Chart on Saudi Arabia - Year-over-year growth 2025-2030 (%)
Data Table on Saudi Arabia - Year-over-year growth 2025-2030 (%)

12.7.2 UAE - Market size and forecast 2025-2030

Chart on UAE - Market size and forecast 2025-2030 ($ thousand)
Data Table on UAE - Market size and forecast 2025-2030 ($ thousand)
Chart on UAE - Year-over-year growth 2025-2030 (%)
Data Table on UAE - Year-over-year growth 2025-2030 (%)

12.7.3 South Africa - Market size and forecast 2025-2030

Chart on South Africa - Market size and forecast 2025-2030 ($ thousand)
Data Table on South Africa - Market size and forecast 2025-2030 ($ thousand)
Chart on South Africa - Year-over-year growth 2025-2030 (%)
Data Table on South Africa - Year-over-year growth 2025-2030 (%)

12.7.4 Israel - Market size and forecast 2025-2030

Chart on Israel - Market size and forecast 2025-2030 ($ thousand)
Data Table on Israel - Market size and forecast 2025-2030 ($ thousand)
Chart on Israel - Year-over-year growth 2025-2030 (%)
Data Table on Israel - Year-over-year growth 2025-2030 (%)

12.7.5 Turkey - Market size and forecast 2025-2030

Chart on Turkey - Market size and forecast 2025-2030 ($ thousand)
Data Table on Turkey - Market size and forecast 2025-2030 ($ thousand)
Chart on Turkey - Year-over-year growth 2025-2030 (%)
Data Table on Turkey - Year-over-year growth 2025-2030 (%)

12.8 Market opportunity by geography

Market opportunity by geography ($ thousand)
Data Tables on Market opportunity by geography ($ thousand)

13. Drivers, Challenges, and Opportunity

13.1 Market drivers

Stringent food safety regulations and adherence to HACCP standards
Rising demand for high-quality frozen food and operational efficiency
Technological advancements in precision thawing and energy efficiency

13.2 Market challenges

High initial capital expenditure and maintenance costs
Compliance with environmental and energy regulations
Operational complexity and workforce skill gaps

13.3 Impact of drivers and challenges

Impact of drivers and challenges in 2025 and 2030

13.4 Market opportunities

Integration of precision-controlled automation and smart connectivity
Strategic prioritization of sustainability and eco-friendly refrigerants
Rising demand for multifunctional and space-optimized configurations

14. Competitive Landscape

14.1 Overview

14.2

Overview on criticality of inputs and factors of differentiation

14.3 Landscape disruption

Overview on factors of disruption

14.4 Industry risks

Impact of key risks on business

15. Competitive Analysis

15.1 Companies profiled

Companies covered

15.2 Company ranking index

15.3 Market positioning of companies

Matrix on companies position and classification

15.4 Advanced Environmental Ltd.

Advanced Environmental Ltd. - Overview
Advanced Environmental Ltd. - Product / Service
Advanced Environmental Ltd. - Key offerings
SWOT

15.5 Ali Group Srl

Ali Group Srl - Overview
Ali Group Srl - Product / Service
Ali Group Srl - Key offerings
SWOT

15.6 BAMBAS FROST

BAMBAS FROST - Overview
BAMBAS FROST - Product / Service
BAMBAS FROST - Key offerings
SWOT

15.7 Cospolich

Cospolich - Overview
Cospolich - Product / Service
Cospolich - Key offerings
SWOT

15.8 Darwin Chambers Co.

Darwin Chambers Co. - Overview
Darwin Chambers Co. - Product / Service
Darwin Chambers Co. - Key offerings
SWOT

15.9 Electrolux Professional AB

Electrolux Professional AB - Overview
Electrolux Professional AB - Business segments
Electrolux Professional AB - Key offerings
Electrolux Professional AB - Segment focus
SWOT

15.10 Foster Refrigerator

Foster Refrigerator - Overview
Foster Refrigerator - Product / Service
Foster Refrigerator - Key offerings
SWOT

15.11 Friulinox Ali Group srl

Friulinox Ali Group srl - Overview
Friulinox Ali Group srl - Product / Service
Friulinox Ali Group srl - Key offerings
SWOT

15.12 HOSHIZAKI Corp.

HOSHIZAKI Corp. - Overview
HOSHIZAKI Corp. - Business segments
HOSHIZAKI Corp. - Key offerings
HOSHIZAKI Corp. - Segment focus
SWOT

15.13 Ipinium AB

Ipinium AB - Overview
Ipinium AB - Product / Service
Ipinium AB - Key offerings
SWOT

15.14 Kometos Oy

Kometos Oy - Overview
Kometos Oy - Product / Service
Kometos Oy - Key offerings
SWOT

15.15 Loipart AB

Loipart AB - Overview
Loipart AB - Product / Service
Loipart AB - Key offerings
SWOT

15.16 The Middleby Corp.

The Middleby Corp. - Overview
The Middleby Corp. - Business segments
The Middleby Corp. - Key offerings
The Middleby Corp. - Segment focus
SWOT

15.17 Thermodyne Inc.

Thermodyne Inc. - Overview
Thermodyne Inc. - Product / Service
Thermodyne Inc. - Key offerings
SWOT

15.18 Williams Refrigeration

Williams Refrigeration - Overview
Williams Refrigeration - Product / Service
Williams Refrigeration - Key offerings
SWOT

16. Appendix

16.1 Scope of the report

Market definition
Objectives
Notes and caveats

16.2 Inclusions and exclusions checklist

Inclusions checklist
Exclusions checklist

16.3 Currency conversion rates for US$

16.4 Research methodology

16.5 Data procurement

Information sources

16.6 Data validation

16.7 Validation techniques employed for market sizing

16.8 Data synthesis

16.9 360 degree market analysis

16.10 List of abbreviations

Research Methodology

Technavio presents a detailed picture of the market by way of study, synthesis, and summation of data from multiple sources. The analysts have presented the various facets of the market with a particular focus on identifying the key industry influencers. The data thus presented is comprehensive, reliable, and the result of extensive research, both primary and secondary.

INFORMATION SOURCES

Primary sources

  • Manufacturers and suppliers
  • Channel partners
  • Industry experts
  • Strategic decision makers

Secondary sources

  • Industry journals and periodicals
  • Government data
  • Financial reports of key industry players
  • Historical data
  • Press releases

DATA ANALYSIS

Data Synthesis

  • Collation of data
  • Estimation of key figures
  • Analysis of derived insights

Data Validation

  • Triangulation with data models
  • Reference against proprietary databases
  • Corroboration with industry experts

REPORT WRITING

Qualitative

  • Market drivers
  • Market challenges
  • Market trends
  • Five forces analysis

Quantitative

  • Market size and forecast
  • Market segmentation
  • Geographical insights
  • Competitive landscape

Interested in this report?

Get your sample now to see our research methodology and insights!

Download Now

Frequently Asked Questions

Commercial Thawing Cabinets market growth will increase by USD 29600.8 thousand thousand during 2026-2030.

The Commercial Thawing Cabinets market is expected to grow at a CAGR of 4.7% during 2026-2030.

Commercial Thawing Cabinets market is segmented by Type (Single door, Double door) Capacity (Medium, Small, Large) End-user (Restaurants and hotels, Catering services, Others)

Advanced Environmental Ltd., Ali Group Srl, BAMBAS FROST, Cospolich, Darwin Chambers Co., Electrolux Professional AB, Foster Refrigerator, Friulinox Ali Group srl, HOSHIZAKI Corp., Ipinium AB, Kometos Oy, Loipart AB, The Middleby Corp., Thermodyne Inc., Williams Refrigeration are a few of the key vendors in the Commercial Thawing Cabinets market.

North America will register the highest growth rate of 37.4% among the other regions. Therefore, the Commercial Thawing Cabinets market in North America is expected to garner significant business opportunities for the vendors during the forecast period.

US, Canada, Mexico, Germany, UK, France, Italy, The Netherlands, Spain, China, Japan, India, South Korea, Australia, Indonesia, Brazil, Argentina, Colombia, Saudi Arabia, UAE, South Africa, Israel, Turkey

  • Stringent food safety regulations and adherence to HACCP standards is the driving factor this market.

The Commercial Thawing Cabinets market vendors should focus on grabbing business opportunities from the Type segment as it accounted for the largest market share in the base year.