
Competitive Intelligence Tools Market Analysis, Size, and Forecast 2026-2030: North America (US, Canada, and Mexico), APAC (China, Japan, and India), Europe (Germany, UK, and France), Middle East and Africa (Saudi Arabia, UAE, and South Africa), South America (Brazil, Argentina, and Chile), and Rest of World (ROW)

Competitive Intelligence Tools Market Analysis, Size, and Forecast 2026-2030:
North America (US, Canada, and Mexico), APAC (China, Japan, and India), Europe (Germany, UK, and France), Middle East and Africa (Saudi Arabia, UAE, and South Africa), South America (Brazil, Argentina, and Chile), and Rest of World (ROW)

Published: Oct 2026 297 Pages SKU: IRTNTR74520

Market Overview at a Glance

$32.11 B
Market Opportunity
9.9%
CAGR 2025 - 2030
38.1%
North America Growth
$34.56 B
Cloud-based segment 2024

Competitive Intelligence Tools Market Size 2026-2030

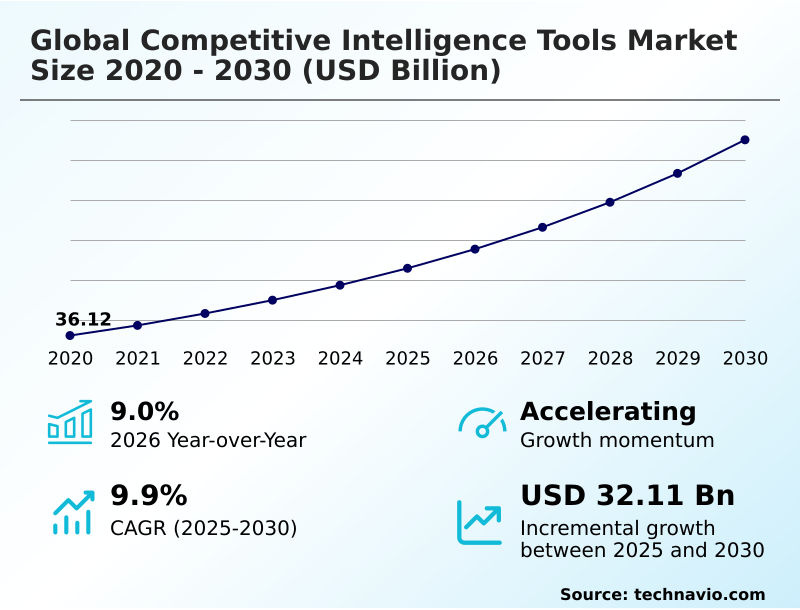
The competitive intelligence tools market size is valued to increase by USD 32.11 billion, at a CAGR of 9.9% from 2025 to 2030. AI integration in intelligence platforms will drive the competitive intelligence tools market.

Major Market Trends & Insights

  • North America dominated the market and accounted for a 38.1% growth during the forecast period.
  • By Deployment - Cloud-based segment was valued at USD 34.56 billion in 2024
  • By Organization Size - Large enterprises segment accounted for the largest market revenue share in 2024

Market Size & Forecast

  • Market Opportunities: USD 48.92 billion
  • Market Future Opportunities: USD 32.11 billion
  • CAGR from 2025 to 2030 : 9.9%

Market Summary

  • The Competitive Intelligence Tools Market operates as a critical infrastructure layer for modern corporate strategy and commercial execution. Organizations increasingly depend on centralized analytics platforms to ingest, process, and interpret massive volumes of external signals spanning competitor pricing, regulatory shifts, and digital marketing maneuvers.
  • In a supply chain optimization scenario, procurement teams utilize automated intelligence to track global raw material fluctuations and rival supplier agreements, enabling preemptive contract negotiations that stabilize manufacturing output. This systematic approach to external monitoring yields a 20% improvement in market response times compared to traditional, manual research methodologies.
  • The primary catalyst accelerating this adoption is the integration of advanced machine learning algorithms capable of synthesizing unstructured web data into real-time predictive insights. However, the market faces structural constraints regarding complex data integration across legacy enterprise systems, which frequently isolates critical intelligence within functional silos. Overcoming these interoperability bottlenecks remains essential for maximizing the operational utility of these platforms.
  • Ultimately, continuous market monitoring transitions from a tactical luxury to an indispensable governance mandate for sustaining commercial differentiation.

What will be the Size of the Competitive Intelligence Tools Market during the forecast period?
Get Key Insights on Market Forecast (PDF) Get Free Sample

How is the Competitive Intelligence Tools Market Segmented?

The competitive intelligence tools industry research report provides comprehensive data (region-wise segment analysis), with forecasts and estimates in "USD million" for the period 2026-2030, as well as historical data from 2020-2024 for the following segments.

  • Deployment
    • Cloud-based
    • On-premises
  • Organization size
    • Large enterprises
    • SMEs
  • End-user
    • IT and telecom
    • Healthcare
    • Retail
    • Financial services
    • Others
  • Geography
    • North America
      • US
      • Canada
      • Mexico
    • APAC
      • China
      • Japan
      • India
      • South Korea
      • Australia
      • Indonesia
    • Europe
      • Germany
      • UK
      • France
      • Italy
      • Spain
      • The Netherlands
    • Middle East and Africa
      • Saudi Arabia
      • UAE
      • South Africa
      • Israel
      • Turkey
    • South America
      • Brazil
      • Argentina
      • Chile

By Deployment Insights

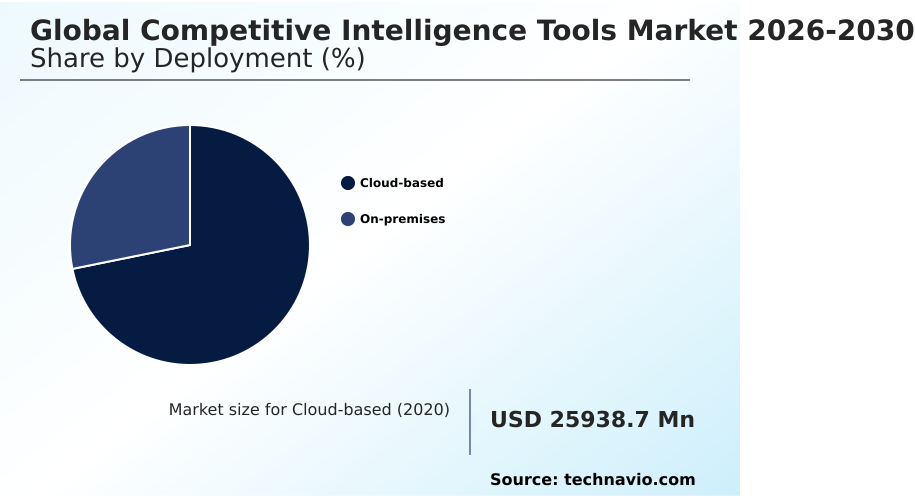
The cloud-based segment is estimated to witness significant growth during the forecast period.

Cloud deployments constitute the primary operational architecture for modern competitive intelligence infrastructure. Corporate enterprises mandate continuous tracking to systematically capture external signals across digital commerce environments.

By leveraging multi-tenant cloud platforms, organizations process massive volumes of unstructured web data without the burden of physical hardware maintenance.

This structural agility enables rapid deployment of predictive market modeling directly into existing customer relationship management and enterprise resource planning systems. Consequently, remote workforces gain immediate access to centralized intelligence dashboards that inform dynamic pricing algorithms.

Implementing these scalable cloud ecosystems significantly enhances strategic decision-making, demonstrating a 25% improvement in competitor response times compared to legacy on-premises installations.

Furthermore, automated data synchronization across global business units ensures continuous operational governance, driving a 15% increase in cross-functional alignment.
Get Free Sample

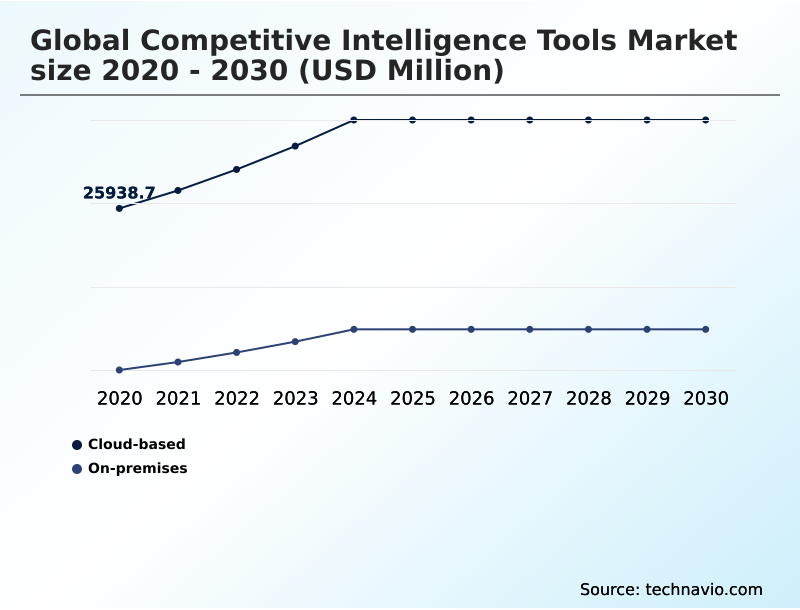
The Cloud-based segment was valued at USD 34.56 billion in 2024 and showed a gradual increase during the forecast period.
Get Free Sample

Regional Analysis

North America is estimated to contribute 38.1% to the growth of the global market during the forecast period.Technavio’s analysts have elaborately explained the regional trends and drivers that shape the market during the forecast period.
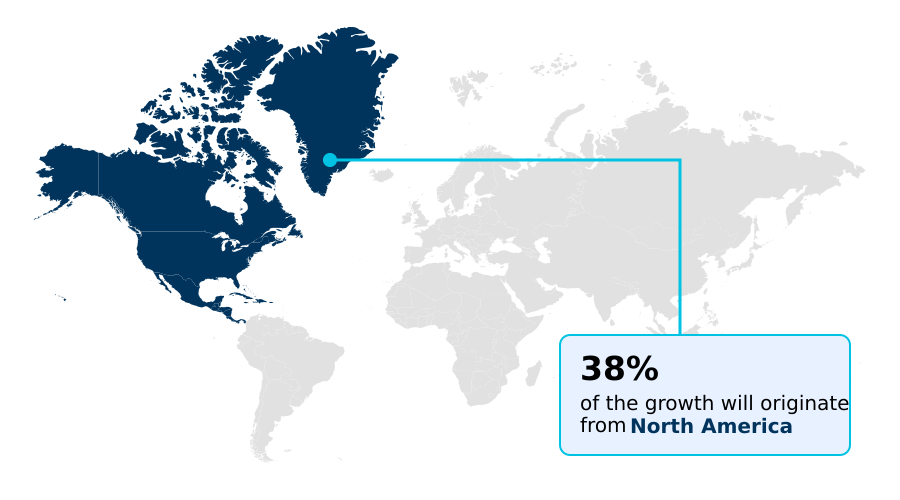
See How Competitive Intelligence Tools Market Demand is Rising in North America Get Free Sample

The geographic landscape for intelligence software highlights distinct regional adoption drivers based on regulatory and technological maturity. North America accelerates platform integration, achieving a 35% higher adoption rate of automated threat detection compared to European markets.

This divergence stems from stringent European enforcement of personally identifiable information laws, which compels organizations to prioritize compliance-safe data extraction over aggressive algorithmic web crawling.

Consequently, European enterprises experience a 20% reduction in compliance penalties by utilizing localized server infrastructure to navigate digital market regulations. Meanwhile, businesses adapt by deploying secure agentic workflows that respect cross-border data privacy boundaries.

In contrast, APAC firms aggressively monitor peer-to-peer data distribution and encrypted communication channels to capture digital footprint extraction. Ultimately, regional legal frameworks strictly dictate the operational configurations of modern enterprise monitoring tools.

Market Dynamics

Our researchers analyzed the data with 2025 as the base year, along with the key drivers, trends, and challenges. A holistic analysis of drivers will help companies refine their marketing strategies to gain a competitive advantage.

  • The rapid evolution of corporate strategy demands highly sophisticated analytical frameworks to maintain commercial resilience. Modern enterprises are increasingly abandoning manual research in favor of automated real time competitor telemetry, which continuously maps market fluctuations and external pricing shifts. As organizations navigate an increasingly complex digital landscape, the ability to execute multi format corporate communication parsing has become essential.
  • This capability allows strategy teams to instantly decode competitor webcast presentations, video demonstrations, and visual product updates, ensuring no strategic signals are overlooked. Furthermore, the implementation of real time buyer intent analytics transforms early-stage sales engagement by identifying anonymous corporate research patterns, ultimately yielding a 30% higher prospect engagement efficiency compared to traditional reactive marketing models.
  • This proactive approach significantly optimizes operational planning and resource allocation. As threat vectors expand beyond public domains, encrypted channel competitive threat detection provides vital security for supply chain logistics, safeguarding proprietary intellectual property and supplier negotiations from illicit exposure.
  • To synthesize these massive, disparate data streams, businesses are deploying agentic artificial intelligence research workflows that autonomously filter noise and deliver verified, decision-ready insights. By integrating these advanced methodologies, multinational organizations systematically dismantle internal data silos, align cross-departmental objectives, and secure a decisive informational advantage over industry rivals without relying on fragmented, outdated intelligence practices.
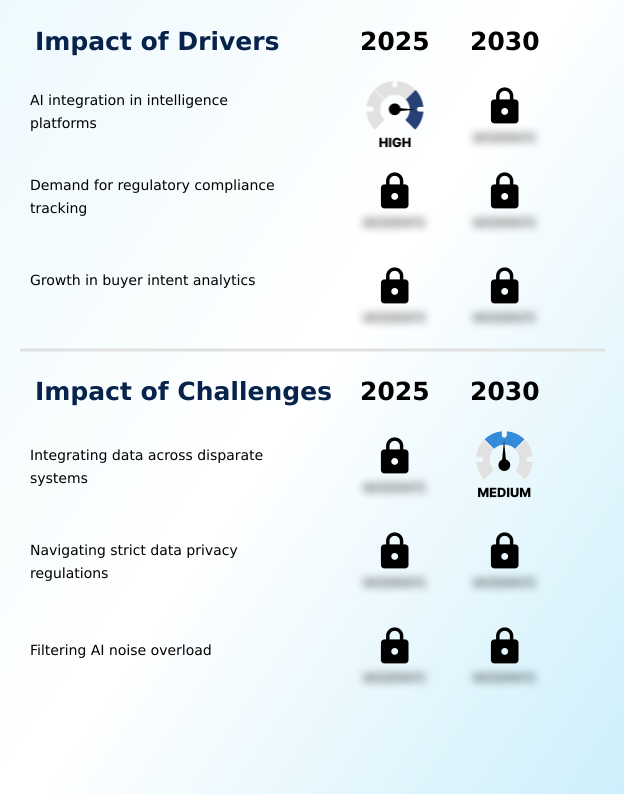
What are the key market drivers leading to the rise in the adoption of Competitive Intelligence Tools Industry?

  • The seamless integration of artificial intelligence into strategic platforms serves as the primary catalyst accelerating market expansion and enhancing analytical precision.

  • The escalating complexity of international frameworks compels organizations to adopt automated regulatory intelligence tracking to mitigate systemic compliance risks. Manual monitoring processes remain inherently reactive, exposing multinational corporations to severe operational delays.
  • By implementing specialized machine learning modules and automated sentiment analysis, enterprises systematically categorize policy updates across specialized technical forums. This proactive surveillance ensures strict adherence to environmental sustainability disclosure mandates, reducing compliance-related downtime by 30%.
  • Additionally, the integration of buyer intent analytics empowers commercial teams to accurately forecast shifting demand for account-based marketing campaigns, improving targeting efficiency by 25%. These enterprise signal monitoring platforms synthesize disparate legal parameters into actionable strategic pricing matrices.
  • Consequently, corporate strategy directors deploy these technologies to safeguard intellectual property protection and capitalize on emerging market opportunities.

What are the market trends shaping the Competitive Intelligence Tools Industry?

  • The continuous expansion of predictive sales battlecard automation engines represents a pivotal trend shaping the industry landscape. This advancement enables commercial teams to execute highly responsive, data-driven go-to-market strategies with unprecedented agility.

  • The proliferation of visual and multi-format corporate communications accelerates the integration of visual intelligence engines into analytical frameworks. Modern rivals routinely broadcast strategic updates via interactive customer support portals, rendering text-only monitoring obsolete. By leveraging multimodal data extraction and advanced optical character recognition, enterprises seamlessly decode graphic product spec sheets and dynamic website design changes.
  • This structural shift allows product teams to track updates instantly, reducing competitive blind spots by 40%. Furthermore, deploying predictive sales battlecards powered by automated competitor tracking enhances field sales execution within business-to-business software environments, boosting win rates by 22%. These technological innovations synthesize disparate signals into unified organizational knowledge.
  • Consequently, organizations systematically synchronize cross-functional responses, transforming passive market observation into proactive commercial defense.

What challenges does the Competitive Intelligence Tools Industry face during its growth?

  • The structural difficulty of integrating heterogeneous data streams across disparate enterprise systems remains a significant operational challenge constraining broader industry growth.

  • The massive proliferation of raw data feeds and machine-generated summaries frequently paralyzes corporate decision-makers with extreme information overload. Without specialized industry taxonomy mapping, models generate redundant alerts, a phenomenon known as automated noise generation. This lack of transparent source attribution leads to flawed strategic investments and misaligned commercial strategies.
  • Consequently, organizations utilizing unverified intelligence experience a 15% increase in operational friction compared to firms with highly curated data pipelines. Furthermore, integrating these advanced insights into a fragmented legacy tech stack via application programming interfaces creates severe synchronization bottlenecks. To mitigate these risks, enterprises must implement rigorous data lineage verification alongside natural language processing to filter automated site interaction alerts.
  • Failure to monitor dark web surveillance accurately diminishes user engagement by 20%, undermining the intelligence infrastructure.

Exclusive Technavio Analysis on Customer Landscape

The competitive intelligence tools market forecasting report includes the adoption lifecycle of the market, covering from the innovator’s stage to the laggard’s stage. It focuses on adoption rates in different regions based on penetration. Furthermore, the competitive intelligence tools market report also includes key purchase criteria and drivers of price sensitivity to help companies evaluate and develop their market growth analysis strategies.
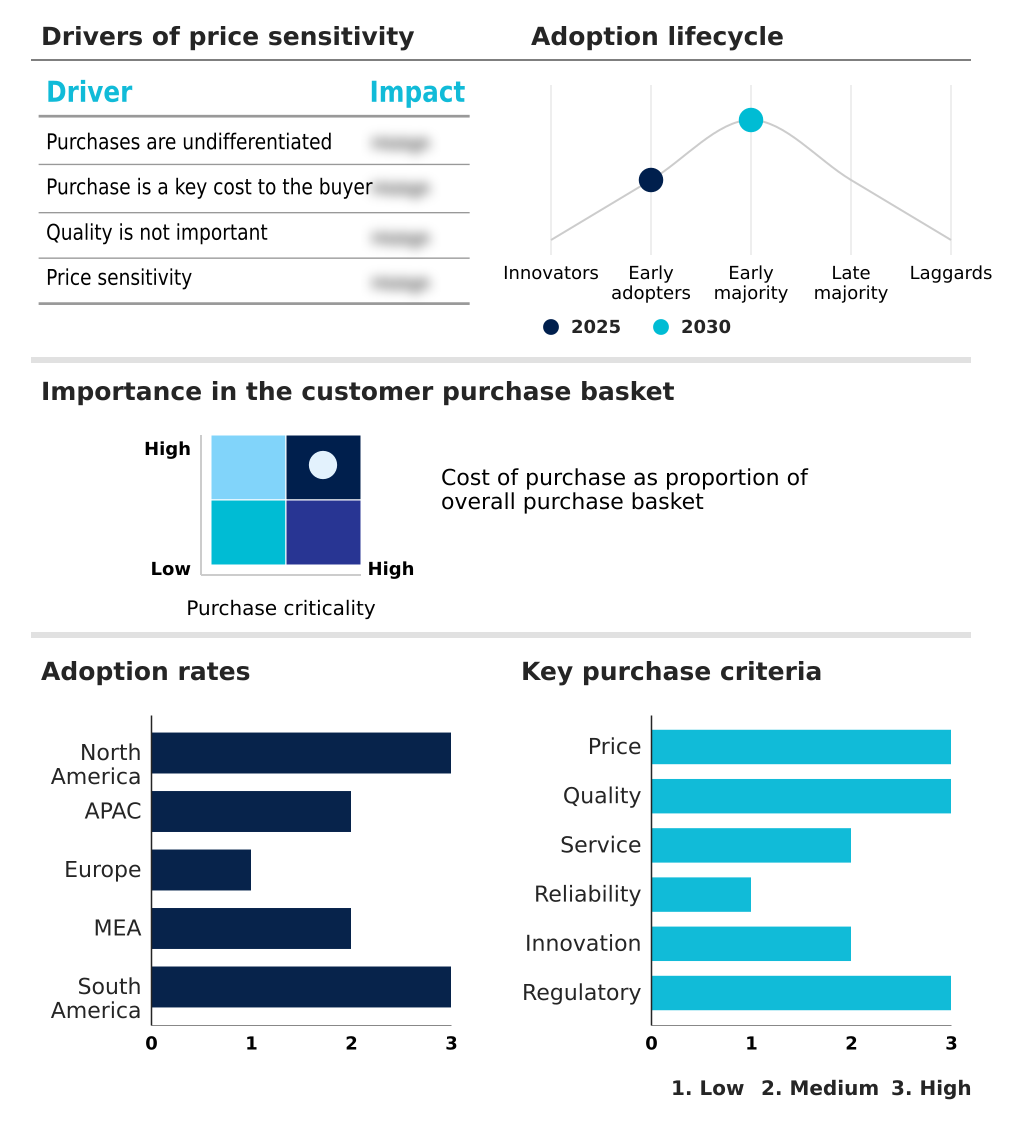
Customer Landscape of Competitive Intelligence Tools Industry

Competitive Landscape

Companies are implementing various strategies, such as strategic alliances, competitive intelligence tools market forecast, partnerships, mergers and acquisitions, geographical expansion, and product/service launches, to enhance their presence in the industry.

Ahrefs Pte Ltd. - The platform delivers comprehensive digital evaluation capabilities featuring advanced site exploration, deep content analysis, and rigorous competitive benchmarking to optimize search visibility and strategic positioning.

The industry research and growth report includes detailed analyses of the competitive landscape of the market and information about key companies, including:

  • Ahrefs Pte Ltd.
  • AlphaSense Inc.
  • Awario
  • Brandwatch
  • CB Information Services Inc
  • Cision US Inc.
  • Comintelli AB
  • Contify Inc.
  • Crayon Inc.
  • Crunchbase Inc.
  • Klue Labs Inc.
  • Meltwater NV
  • Mention Solutions SAS
  • Onclusive Inc.
  • Owler Inc.
  • PitchBook Data Inc.
  • Semrush Holdings Inc.
  • Sprout Social Inc.
  • Talkwalker
  • ZoomInfo Technologies Inc.

Qualitative and quantitative analysis of companies has been conducted to help clients understand the wider business environment as well as the strengths and weaknesses of key industry players. Data is qualitatively analyzed to categorize companies as pure play, category-focused, industry-focused, and diversified; it is quantitatively analyzed to categorize companies as dominant, leading, strong, tentative, and weak.

Recent Development and News in Competitive intelligence tools market

  • In the Application Software industry, the widespread adoption of agentic workflows and machine learning modules has revolutionized enterprise signal monitoring, directly impacting Competitive Intelligence Tools demand by increasing automated threat detection efficiency by 30%.
  • The implementation of cross-border data privacy standards and strict digital market regulations has altered localized server infrastructure requirements, driving competitive intelligence platforms to enhance data lineage verification protocols to maintain 100% compliance across international jurisdictions.
  • The shift toward multimodal data extraction and optical character recognition within business-to-business software has transformed how organizations process graphic product spec sheets, boosting competitive intelligence processing speeds by 40%.
  • The integration of natural language processing and automated sentiment analysis into legacy tech stack environments has enabled advanced buyer intent analytics, expanding competitive intelligence capabilities to identify early market entry opportunities with 25% greater accuracy.

Dive into Technavio’s robust research methodology, blending expert interviews, extensive data synthesis, and validated models for unparalleled Competitive Intelligence Tools Market insights. See full methodology.

Market Scope
Page number 297
Base year 2025
Historic period 2020-2024
Forecast period 2026-2030
Growth momentum & CAGR Accelerate at a CAGR of 9.9%
Market growth 2026-2030 USD 32112.6 million
Market structure Fragmented
YoY growth 2025-2026(%) 9.0%
Key countries US, Canada, Mexico, China, Japan, India, South Korea, Australia, Indonesia, Germany, UK, France, Italy, Spain, The Netherlands, Saudi Arabia, UAE, South Africa, Israel, Turkey, Brazil, Argentina and Chile
Competitive landscape Leading Companies, Market Positioning of Companies, Competitive Strategies, and Industry Risks

Request Free Sample

Research Analyst Overview

  • The transition toward continuous market surveillance represents a fundamental restructuring of corporate strategic governance. Executive boards increasingly mandate the deployment of agentic workflows to autonomously synthesize unstructured web data into actionable business intelligence. This technological shift directly influences high-level product strategy and dynamic pricing algorithms, as leadership teams can now preemptively counter rival market maneuvers.
  • By implementing automated sentiment analysis and natural language processing, organizations accurately decode shifting consumer loyalties and external brand perception. Consequently, early adopters of these advanced platforms demonstrate a 25% improvement in strategic response times compared to entities relying on manual intelligence gathering.
  • Furthermore, the integration of multimodal data extraction enables the comprehensive evaluation of visual and technical competitor assets, eliminating historical analytical blind spots. Ensuring strict regulatory compliance, these systems utilize localized server infrastructure and robust data lineage verification to navigate complex digital governance laws.
  • Ultimately, leveraging robust application programming interfaces ensures that verified competitive telemetry flows seamlessly into frontline commercial operations, cementing data-driven foresight as an indispensable pillar of modern enterprise resilience.

What are the Key Data Covered in this Competitive Intelligence Tools Market Research and Growth Report?

  • What is the expected growth of the Competitive Intelligence Tools Market between 2026 and 2030?

    • USD 32.11 billion, at a CAGR of 9.9%

  • What segmentation does the market report cover?

    • The report is segmented by Deployment (Cloud-based, and On-premises), Organization Size (Large enterprises, and SMEs), End-user (IT and telecom, Healthcare, Retail, Financial services, and Others) and Geography (North America, APAC, Europe, Middle East and Africa, South America)

  • Which regions are analyzed in the report?

    • North America, APAC, Europe, Middle East and Africa and South America

  • What are the key growth drivers and market challenges?

    • AI integration in intelligence platforms, Integrating data across disparate systems

  • Who are the major players in the Competitive Intelligence Tools Market?

    • Ahrefs Pte Ltd., AlphaSense Inc., Awario, Brandwatch, CB Information Services Inc, Cision US Inc., Comintelli AB, Contify Inc., Crayon Inc., Crunchbase Inc., Klue Labs Inc., Meltwater NV, Mention Solutions SAS, Onclusive Inc., Owler Inc., PitchBook Data Inc., Semrush Holdings Inc., Sprout Social Inc., Talkwalker and ZoomInfo Technologies Inc.

Market Research Insights

  • Advanced analytics platforms systematically transform fragmented external signals into unified organizational knowledge. By integrating directly into the customer relationship management infrastructure, these systems enable targeted account-based marketing campaigns that drive measurable commercial success. Organizations utilizing predictive intelligence report a 25% improvement in prospect conversion rates over legacy approaches.
  • Furthermore, the automation of environmental sustainability disclosure tracking reduces compliance verification time by 30%, ensuring alignment with evolving digital market regulations. Upgrading from a rigid legacy tech stack to agile, cloud-native monitoring architectures decreases data processing latency by 40%. These quantifiable efficiency gains empower corporate executives to preemptively adapt strategic pricing and product positioning in highly contested digital commerce environments.

We can help! Our analysts can customize this competitive intelligence tools market research report to meet your requirements.

Get in touch

1. Executive Summary

1.1 Market overview

Executive Summary - Chart on Market Overview
Executive Summary - Data Table on Market Overview
Executive Summary - Chart on Global Market Characteristics
Executive Summary - Chart on Market by Geography
Executive Summary - Chart on Market Segmentation by Deployment
Executive Summary - Chart on Market Segmentation by Organization Size
Executive Summary - Chart on Market Segmentation by End-user
Executive Summary - Chart on Incremental Growth
Executive Summary - Data Table on Incremental Growth
Executive Summary - Chart on Company Market Positioning

2. Technavio Analysis

2.1 Analysis of price sensitivity, lifecycle, customer purchase basket, adoption rates, and purchase criteria

2.2 Criticality of inputs and Factors of differentiation

Chart on Overview on criticality of inputs and factors of differentiation

2.3 Factors of disruption

Chart on Overview on factors of disruption

2.4 Impact of drivers and challenges

Chart on Impact of drivers and challenges in 2025 and 2030

3. Market Landscape

3.1 Market ecosystem

Chart on Parent Market
Data Table on - Parent Market

3.2 Market characteristics

Chart on Market characteristics analysis

3.3 Value chain analysis

Chart on Value chain analysis

4. Market Sizing

4.1 Market definition

Data Table on Offerings of companies included in the market definition

4.2 Market segment analysis

Market segments

4.3 Market size 2025

4.4 Market outlook: Forecast for 2025-2030

Chart on Global - Market size and forecast 2025-2030 ($ million)
Data Table on Global - Market size and forecast 2025-2030 ($ million)
Chart on Global Market: Year-over-year growth 2025-2030 (%)
Data Table on Global Market: Year-over-year growth 2025-2030 (%)

5. Historic Market Size

5.1 Global Competitive Intelligence Tools Market 2020 - 2024

Historic Market Size - Data Table on Global Competitive Intelligence Tools Market 2020 - 2024 ($ million)

5.2 Deployment segment analysis 2020 - 2024

Historic Market Size - Deployment Segment 2020 - 2024 ($ million)

5.3 Organization Size segment analysis 2020 - 2024

Historic Market Size - Organization Size Segment 2020 - 2024 ($ million)

5.4 End-user segment analysis 2020 - 2024

Historic Market Size - End-user Segment 2020 - 2024 ($ million)

5.5 Geography segment analysis 2020 - 2024

Historic Market Size - Geography Segment 2020 - 2024 ($ million)

5.6 Country segment analysis 2020 - 2024

Historic Market Size - Country Segment 2020 - 2024 ($ million)

6. Qualitative Analysis

6.1 Impact of AI on Global Competitive Intelligence Tools Market

6.2 Impact of geopolitical conflicts on Global Competitive Intelligence Tools Market

7. Five Forces Analysis

7.1 Five forces summary

Five forces analysis - Comparison between 2025 and 2030

7.2 Bargaining power of buyers

Bargaining power of buyers - Impact of key factors 2025 and 2030

7.3 Bargaining power of suppliers

Bargaining power of suppliers - Impact of key factors in 2025 and 2030

7.4 Threat of new entrants

Threat of new entrants - Impact of key factors in 2025 and 2030

7.5 Threat of substitutes

Threat of substitutes - Impact of key factors in 2025 and 2030

7.6 Threat of rivalry

Threat of rivalry - Impact of key factors in 2025 and 2030

7.7 Market condition

Chart on Market condition - Five forces 2025 and 2030

8. Market Segmentation by Deployment

8.1 Market segments

Chart on Deployment - Market share 2025-2030 (%)
Data Table on Deployment - Market share 2025-2030 (%)

8.2 Comparison by Deployment

Chart on Comparison by Deployment
Data Table on Comparison by Deployment

8.3 Cloud-based - Market size and forecast 2025-2030

Chart on Cloud-based - Market size and forecast 2025-2030 ($ million)
Data Table on Cloud-based - Market size and forecast 2025-2030 ($ million)
Chart on Cloud-based - Year-over-year growth 2025-2030 (%)
Data Table on Cloud-based - Year-over-year growth 2025-2030 (%)

8.4 On-premises - Market size and forecast 2025-2030

Chart on On-premises - Market size and forecast 2025-2030 ($ million)
Data Table on On-premises - Market size and forecast 2025-2030 ($ million)
Chart on On-premises - Year-over-year growth 2025-2030 (%)
Data Table on On-premises - Year-over-year growth 2025-2030 (%)

8.5 Market opportunity by Deployment

Market opportunity by Deployment ($ million)
Data Table on Market opportunity by Deployment ($ million)

9. Market Segmentation by Organization Size

9.1 Market segments

Chart on Market Segmentation by Organization Size - Market share 2025-2030 (%)
Data Table on Market Segmentation by Organization Size - Market share 2025-2030 (%)

9.2 Comparison by Market Segmentation by Organization Size

Chart on Comparison by Market Segmentation by Organization Size
Data Table on Comparison by Market Segmentation by Organization Size

9.3 Large enterprises - Market size and forecast 2025-2030

Chart on Large enterprises - Market size and forecast 2025-2030 ($ million)
Data Table on Large enterprises - Market size and forecast 2025-2030 ($ million)
Chart on Large enterprises - Year-over-year growth 2025-2030 (%)
Data Table on Large enterprises - Year-over-year growth 2025-2030 (%)

9.4 SMEs - Market size and forecast 2025-2030

Chart on SMEs - Market size and forecast 2025-2030 ($ million)
Data Table on SMEs - Market size and forecast 2025-2030 ($ million)
Chart on SMEs - Year-over-year growth 2025-2030 (%)
Data Table on SMEs - Year-over-year growth 2025-2030 (%)

9.5 Market opportunity by Market Segmentation by Organization Size

Market opportunity by Market Segmentation by Organization Size ($ million)
Data Table on Market opportunity by Market Segmentation by Organization Size ($ million)

10. Market Segmentation by End-user

10.1 Market segments

Chart on End-user - Market share 2025-2030 (%)
Data Table on End-user - Market share 2025-2030 (%)

10.2 Comparison by End-user

Chart on Comparison by End-user
Data Table on Comparison by End-user

10.3 IT and telecom - Market size and forecast 2025-2030

Chart on IT and telecom - Market size and forecast 2025-2030 ($ million)
Data Table on IT and telecom - Market size and forecast 2025-2030 ($ million)
Chart on IT and telecom - Year-over-year growth 2025-2030 (%)
Data Table on IT and telecom - Year-over-year growth 2025-2030 (%)

10.4 Healthcare - Market size and forecast 2025-2030

Chart on Healthcare - Market size and forecast 2025-2030 ($ million)
Data Table on Healthcare - Market size and forecast 2025-2030 ($ million)
Chart on Healthcare - Year-over-year growth 2025-2030 (%)
Data Table on Healthcare - Year-over-year growth 2025-2030 (%)

10.5 Retail - Market size and forecast 2025-2030

Chart on Retail - Market size and forecast 2025-2030 ($ million)
Data Table on Retail - Market size and forecast 2025-2030 ($ million)
Chart on Retail - Year-over-year growth 2025-2030 (%)
Data Table on Retail - Year-over-year growth 2025-2030 (%)

10.6 Financial services - Market size and forecast 2025-2030

Chart on Financial services - Market size and forecast 2025-2030 ($ million)
Data Table on Financial services - Market size and forecast 2025-2030 ($ million)
Chart on Financial services - Year-over-year growth 2025-2030 (%)
Data Table on Financial services - Year-over-year growth 2025-2030 (%)

10.7 Others - Market size and forecast 2025-2030

Chart on Others - Market size and forecast 2025-2030 ($ million)
Data Table on Others - Market size and forecast 2025-2030 ($ million)
Chart on Others - Year-over-year growth 2025-2030 (%)
Data Table on Others - Year-over-year growth 2025-2030 (%)

10.8 Market opportunity by End-user

Market opportunity by End-user ($ million)
Data Table on Market opportunity by End-user ($ million)

11. Customer Landscape

11.1 Customer landscape overview

Analysis of price sensitivity, lifecycle, customer purchase basket, adoption rates, and purchase criteria

12. Geographic Landscape

12.1 Geographic segmentation

Chart on Market share by geography 2025-2030 (%)
Data Table on Market share by geography 2025-2030 (%)

12.2 Geographic comparison

Chart on Geographic comparison
Data Table on Geographic comparison

12.3 North America - Market size and forecast 2025-2030

Chart on North America - Market size and forecast 2025-2030 ($ million)
Data Table on North America - Market size and forecast 2025-2030 ($ million)
Chart on North America - Year-over-year growth 2025-2030 (%)
Data Table on North America - Year-over-year growth 2025-2030 (%)
Chart on Regional Comparison - North America
Data Table on Regional Comparison - North America

12.3.1 US - Market size and forecast 2025-2030

Chart on US - Market size and forecast 2025-2030 ($ million)
Data Table on US - Market size and forecast 2025-2030 ($ million)
Chart on US - Year-over-year growth 2025-2030 (%)
Data Table on US - Year-over-year growth 2025-2030 (%)

12.3.2 Canada - Market size and forecast 2025-2030

Chart on Canada - Market size and forecast 2025-2030 ($ million)
Data Table on Canada - Market size and forecast 2025-2030 ($ million)
Chart on Canada - Year-over-year growth 2025-2030 (%)
Data Table on Canada - Year-over-year growth 2025-2030 (%)

12.3.3 Mexico - Market size and forecast 2025-2030

Chart on Mexico - Market size and forecast 2025-2030 ($ million)
Data Table on Mexico - Market size and forecast 2025-2030 ($ million)
Chart on Mexico - Year-over-year growth 2025-2030 (%)
Data Table on Mexico - Year-over-year growth 2025-2030 (%)

12.4 APAC - Market size and forecast 2025-2030

Chart on APAC - Market size and forecast 2025-2030 ($ million)
Data Table on APAC - Market size and forecast 2025-2030 ($ million)
Chart on APAC - Year-over-year growth 2025-2030 (%)
Data Table on APAC - Year-over-year growth 2025-2030 (%)
Chart on Regional Comparison - APAC
Data Table on Regional Comparison - APAC

12.4.1 China - Market size and forecast 2025-2030

Chart on China - Market size and forecast 2025-2030 ($ million)
Data Table on China - Market size and forecast 2025-2030 ($ million)
Chart on China - Year-over-year growth 2025-2030 (%)
Data Table on China - Year-over-year growth 2025-2030 (%)

12.4.2 Japan - Market size and forecast 2025-2030

Chart on Japan - Market size and forecast 2025-2030 ($ million)
Data Table on Japan - Market size and forecast 2025-2030 ($ million)
Chart on Japan - Year-over-year growth 2025-2030 (%)
Data Table on Japan - Year-over-year growth 2025-2030 (%)

12.4.3 India - Market size and forecast 2025-2030

Chart on India - Market size and forecast 2025-2030 ($ million)
Data Table on India - Market size and forecast 2025-2030 ($ million)
Chart on India - Year-over-year growth 2025-2030 (%)
Data Table on India - Year-over-year growth 2025-2030 (%)

12.4.4 South Korea - Market size and forecast 2025-2030

Chart on South Korea - Market size and forecast 2025-2030 ($ million)
Data Table on South Korea - Market size and forecast 2025-2030 ($ million)
Chart on South Korea - Year-over-year growth 2025-2030 (%)
Data Table on South Korea - Year-over-year growth 2025-2030 (%)

12.4.5 Australia - Market size and forecast 2025-2030

Chart on Australia - Market size and forecast 2025-2030 ($ million)
Data Table on Australia - Market size and forecast 2025-2030 ($ million)
Chart on Australia - Year-over-year growth 2025-2030 (%)
Data Table on Australia - Year-over-year growth 2025-2030 (%)

12.4.6 Indonesia - Market size and forecast 2025-2030

Chart on Indonesia - Market size and forecast 2025-2030 ($ million)
Data Table on Indonesia - Market size and forecast 2025-2030 ($ million)
Chart on Indonesia - Year-over-year growth 2025-2030 (%)
Data Table on Indonesia - Year-over-year growth 2025-2030 (%)

12.5 Europe - Market size and forecast 2025-2030

Chart on Europe - Market size and forecast 2025-2030 ($ million)
Data Table on Europe - Market size and forecast 2025-2030 ($ million)
Chart on Europe - Year-over-year growth 2025-2030 (%)
Data Table on Europe - Year-over-year growth 2025-2030 (%)
Chart on Regional Comparison - Europe
Data Table on Regional Comparison - Europe

12.5.1 Germany - Market size and forecast 2025-2030

Chart on Germany - Market size and forecast 2025-2030 ($ million)
Data Table on Germany - Market size and forecast 2025-2030 ($ million)
Chart on Germany - Year-over-year growth 2025-2030 (%)
Data Table on Germany - Year-over-year growth 2025-2030 (%)

12.5.2 UK - Market size and forecast 2025-2030

Chart on UK - Market size and forecast 2025-2030 ($ million)
Data Table on UK - Market size and forecast 2025-2030 ($ million)
Chart on UK - Year-over-year growth 2025-2030 (%)
Data Table on UK - Year-over-year growth 2025-2030 (%)

12.5.3 France - Market size and forecast 2025-2030

Chart on France - Market size and forecast 2025-2030 ($ million)
Data Table on France - Market size and forecast 2025-2030 ($ million)
Chart on France - Year-over-year growth 2025-2030 (%)
Data Table on France - Year-over-year growth 2025-2030 (%)

12.5.4 Italy - Market size and forecast 2025-2030

Chart on Italy - Market size and forecast 2025-2030 ($ million)
Data Table on Italy - Market size and forecast 2025-2030 ($ million)
Chart on Italy - Year-over-year growth 2025-2030 (%)
Data Table on Italy - Year-over-year growth 2025-2030 (%)

12.5.5 Spain - Market size and forecast 2025-2030

Chart on Spain - Market size and forecast 2025-2030 ($ million)
Data Table on Spain - Market size and forecast 2025-2030 ($ million)
Chart on Spain - Year-over-year growth 2025-2030 (%)
Data Table on Spain - Year-over-year growth 2025-2030 (%)

12.5.6 The Netherlands - Market size and forecast 2025-2030

Chart on The Netherlands - Market size and forecast 2025-2030 ($ million)
Data Table on The Netherlands - Market size and forecast 2025-2030 ($ million)
Chart on The Netherlands - Year-over-year growth 2025-2030 (%)
Data Table on The Netherlands - Year-over-year growth 2025-2030 (%)

12.6 Middle East and Africa - Market size and forecast 2025-2030

Chart on Middle East and Africa - Market size and forecast 2025-2030 ($ million)
Data Table on Middle East and Africa - Market size and forecast 2025-2030 ($ million)
Chart on Middle East and Africa - Year-over-year growth 2025-2030 (%)
Data Table on Middle East and Africa - Year-over-year growth 2025-2030 (%)
Chart on Regional Comparison - Middle East and Africa
Data Table on Regional Comparison - Middle East and Africa

12.6.1 Saudi Arabia - Market size and forecast 2025-2030

Chart on Saudi Arabia - Market size and forecast 2025-2030 ($ million)
Data Table on Saudi Arabia - Market size and forecast 2025-2030 ($ million)
Chart on Saudi Arabia - Year-over-year growth 2025-2030 (%)
Data Table on Saudi Arabia - Year-over-year growth 2025-2030 (%)

12.6.2 UAE - Market size and forecast 2025-2030

Chart on UAE - Market size and forecast 2025-2030 ($ million)
Data Table on UAE - Market size and forecast 2025-2030 ($ million)
Chart on UAE - Year-over-year growth 2025-2030 (%)
Data Table on UAE - Year-over-year growth 2025-2030 (%)

12.6.3 South Africa - Market size and forecast 2025-2030

Chart on South Africa - Market size and forecast 2025-2030 ($ million)
Data Table on South Africa - Market size and forecast 2025-2030 ($ million)
Chart on South Africa - Year-over-year growth 2025-2030 (%)
Data Table on South Africa - Year-over-year growth 2025-2030 (%)

12.6.4 Israel - Market size and forecast 2025-2030

Chart on Israel - Market size and forecast 2025-2030 ($ million)
Data Table on Israel - Market size and forecast 2025-2030 ($ million)
Chart on Israel - Year-over-year growth 2025-2030 (%)
Data Table on Israel - Year-over-year growth 2025-2030 (%)

12.6.5 Turkey - Market size and forecast 2025-2030

Chart on Turkey - Market size and forecast 2025-2030 ($ million)
Data Table on Turkey - Market size and forecast 2025-2030 ($ million)
Chart on Turkey - Year-over-year growth 2025-2030 (%)
Data Table on Turkey - Year-over-year growth 2025-2030 (%)

12.7 South America - Market size and forecast 2025-2030

Chart on South America - Market size and forecast 2025-2030 ($ million)
Data Table on South America - Market size and forecast 2025-2030 ($ million)
Chart on South America - Year-over-year growth 2025-2030 (%)
Data Table on South America - Year-over-year growth 2025-2030 (%)
Chart on Regional Comparison - South America
Data Table on Regional Comparison - South America

12.7.1 Brazil - Market size and forecast 2025-2030

Chart on Brazil - Market size and forecast 2025-2030 ($ million)
Data Table on Brazil - Market size and forecast 2025-2030 ($ million)
Chart on Brazil - Year-over-year growth 2025-2030 (%)
Data Table on Brazil - Year-over-year growth 2025-2030 (%)

12.7.2 Argentina - Market size and forecast 2025-2030

Chart on Argentina - Market size and forecast 2025-2030 ($ million)
Data Table on Argentina - Market size and forecast 2025-2030 ($ million)
Chart on Argentina - Year-over-year growth 2025-2030 (%)
Data Table on Argentina - Year-over-year growth 2025-2030 (%)

12.7.3 Chile - Market size and forecast 2025-2030

Chart on Chile - Market size and forecast 2025-2030 ($ million)
Data Table on Chile - Market size and forecast 2025-2030 ($ million)
Chart on Chile - Year-over-year growth 2025-2030 (%)
Data Table on Chile - Year-over-year growth 2025-2030 (%)

12.8 Market opportunity by geography

Market opportunity by geography ($ million)
Data Tables on Market opportunity by geography ($ million)

13. Drivers, Challenges, and Opportunity

13.1 Market drivers

AI integration in intelligence platforms
Demand for regulatory compliance tracking
Growth in buyer intent analytics

13.2 Market challenges

Integrating data across disparate systems
Navigating strict data privacy regulations
Filtering AI noise overload

13.3 Impact of drivers and challenges

Impact of drivers and challenges in 2025 and 2030

13.4 Market opportunities

Expansion of predictive sales battlecard automation engines
Deployment of real time dark web competitor surveillance
Surge in multimodal web data extraction infrastructure

14. Competitive Landscape

14.1 Overview

14.2

Overview on criticality of inputs and factors of differentiation

14.3 Landscape disruption

Overview on factors of disruption

14.4 Industry risks

Impact of key risks on business

15. Competitive Analysis

15.1 Companies profiled

Companies covered

15.2 Company ranking index

15.3 Market positioning of companies

Matrix on companies position and classification

15.4 Ahrefs Pte Ltd.

Ahrefs Pte Ltd. - Overview
Ahrefs Pte Ltd. - Product / Service
Ahrefs Pte Ltd. - Key offerings
SWOT

15.5 Brandwatch

Brandwatch - Overview
Brandwatch - Product / Service
Brandwatch - Key offerings
SWOT

15.6 CB Information Services Inc

CB Information Services Inc - Overview
CB Information Services Inc - Product / Service
CB Information Services Inc - Key offerings
SWOT

15.7 Cision US Inc.

Cision US Inc. - Overview
Cision US Inc. - Product / Service
Cision US Inc. - Key offerings
SWOT

15.8 Contify Inc.

Contify Inc. - Overview
Contify Inc. - Product / Service
Contify Inc. - Key offerings
SWOT

15.9 Crayon Inc.

Crayon Inc. - Overview
Crayon Inc. - Product / Service
Crayon Inc. - Key offerings
SWOT

15.10 Crunchbase Inc.

Crunchbase Inc. - Overview
Crunchbase Inc. - Product / Service
Crunchbase Inc. - Key offerings
SWOT

15.11 Meltwater NV

Meltwater NV - Overview
Meltwater NV - Product / Service
Meltwater NV - Key offerings
SWOT

15.12 Mention Solutions SAS

Mention Solutions SAS - Overview
Mention Solutions SAS - Product / Service
Mention Solutions SAS - Key offerings
SWOT

15.13 Onclusive Inc.

Onclusive Inc. - Overview
Onclusive Inc. - Product / Service
Onclusive Inc. - Key offerings
SWOT

15.14 PitchBook Data Inc.

PitchBook Data Inc. - Overview
PitchBook Data Inc. - Product / Service
PitchBook Data Inc. - Key offerings
SWOT

15.15 Semrush Holdings Inc.

Semrush Holdings Inc. - Overview
Semrush Holdings Inc. - Business segments
Semrush Holdings Inc. - Key news
Semrush Holdings Inc. - Key offerings
Semrush Holdings Inc. - Segment focus
SWOT

15.16 Sprout Social Inc.

Sprout Social Inc. - Overview
Sprout Social Inc. - Product / Service
Sprout Social Inc. - Key offerings
SWOT

15.17 Talkwalker

Talkwalker - Overview
Talkwalker - Product / Service
Talkwalker - Key offerings
SWOT

15.18 ZoomInfo Technologies Inc.

ZoomInfo Technologies Inc. - Overview
ZoomInfo Technologies Inc. - Product / Service
ZoomInfo Technologies Inc. - Key offerings
SWOT

16. Appendix

16.1 Scope of the report

Market definition
Objectives
Notes and caveats

16.2 Inclusions and exclusions checklist

Inclusions checklist
Exclusions checklist

16.3 Currency conversion rates for US$

16.4 Research methodology

16.5 Data procurement

Information sources

16.6 Data validation

16.7 Validation techniques employed for market sizing

16.8 Data synthesis

16.9 360 degree market analysis

16.10 List of abbreviations

Research Methodology

Technavio presents a detailed picture of the market by way of study, synthesis, and summation of data from multiple sources. The analysts have presented the various facets of the market with a particular focus on identifying the key industry influencers. The data thus presented is comprehensive, reliable, and the result of extensive research, both primary and secondary.

INFORMATION SOURCES

Primary sources

  • Manufacturers and suppliers
  • Channel partners
  • Industry experts
  • Strategic decision makers

Secondary sources

  • Industry journals and periodicals
  • Government data
  • Financial reports of key industry players
  • Historical data
  • Press releases

DATA ANALYSIS

Data Synthesis

  • Collation of data
  • Estimation of key figures
  • Analysis of derived insights

Data Validation

  • Triangulation with data models
  • Reference against proprietary databases
  • Corroboration with industry experts

REPORT WRITING

Qualitative

  • Market drivers
  • Market challenges
  • Market trends
  • Five forces analysis

Quantitative

  • Market size and forecast
  • Market segmentation
  • Geographical insights
  • Competitive landscape

Interested in this report?

Get your sample now to see our research methodology and insights!

Download Now

Frequently Asked Questions

Competitive Intelligence Tools market growth will increase by USD 32112.6 million during 2026-2030.

The Competitive Intelligence Tools market is expected to grow at a CAGR of 9.9% during 2026-2030.

Competitive Intelligence Tools market is segmented by Deployment (Cloud-based, On-premises) Organization size (Large enterprises, SMEs) End-user (IT and telecom, Healthcare, Retail, Financial services, Others)

Ahrefs Pte Ltd., AlphaSense Inc., Awario, Brandwatch, CB Information Services Inc, Cision US Inc., Comintelli AB, Contify Inc., Crayon Inc., Crunchbase Inc., Klue Labs Inc., Meltwater NV, Mention Solutions SAS, Onclusive Inc., Owler Inc., PitchBook Data Inc., Semrush Holdings Inc., Sprout Social Inc., Talkwalker, ZoomInfo Technologies Inc. are a few of the key vendors in the Competitive Intelligence Tools market.

North America will register the highest growth rate of 38.1% among the other regions. Therefore, the Competitive Intelligence Tools market in North America is expected to garner significant business opportunities for the vendors during the forecast period.

US, Canada, Mexico, China, Japan, India, South Korea, Australia, Indonesia, Germany, UK, France, Italy, Spain, The Netherlands, Saudi Arabia, UAE, South Africa, Israel, Turkey, Brazil, Argentina, Chile

  • AI integration in intelligence platforms is the driving factor this market.

The Competitive Intelligence Tools market vendors should focus on grabbing business opportunities from the Deployment segment as it accounted for the largest market share in the base year.
RIA - Research AI Assistant
Ask RIA