Composite Materials and Aluminum Alloys in Aerospace Market Size 2024-2028
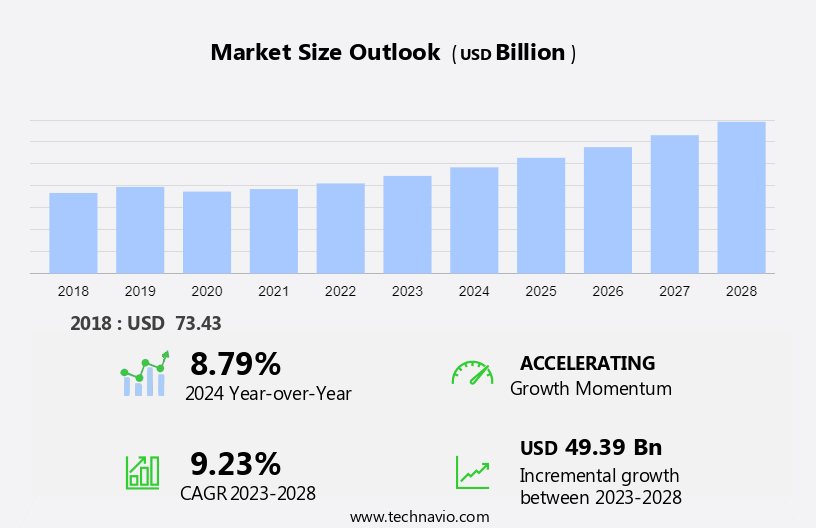
The composite materials and aluminum alloys in aerospace market size is forecast to increase by USD 49.39 billion at a CAGR of 9.23% between 2023 and 2028.
- The market In the aerospace industry is experiencing significant growth due to the increasing demand for weight reduction and fuel efficiency in aircraft. Aluminum alloys, with their superior strength-to-weight ratio, are increasingly being used In the production of aircraft structures. the trend towards sustainability is driving research and development efforts in the use of alternative materials, such as titanium alloys and steel alloys, to further improve safety, performance, and overall aircraft efficiency. However, the market also faces challenges, such as the complexity issues related to the repair and maintenance of composite materials and alloys. The trend towards lightweight and fuel-efficient aircraft is a major growth factor, as airlines seek to reduce operating costs and improve environmental performance. Composite materials offer excellent strength and durability, but their complex nature makes repair and maintenance more challenging than traditional materials.
What will be the Size of the Market During the Forecast Period?
- The aerospace market for composite materials and aluminum alloys continues to experience significant growth, driven by the increasing demand for fuel efficiency and reduced emissions in air travel. Aircraft manufacturing companies are increasingly turning to lightweight materials, such as carbon fibers and glass fibers in polymer matrices, for the production of airframes and wings. Aluminum alloys, known for their high strength-to-weight ratio and corrosion resistance, remain a staple In the industry.
- Aircraft manufacturers, including those producing commercial and military aircraft, are under financial strain to reduce operational costs, making the adoption of these advanced materials essential. The market for composite materials and aluminum alloys in aerospace is segmented into various applications, including airframes, wings, and engine components.
How is this Industry segmented and which is the largest segment?
The composite materials and aluminum alloys in aerospace industry research report provides comprehensive data (region-wise segment analysis), with forecasts and estimates in "USD billion" for the period 2024-2028, as well as historical data from 2018-2022 for the following segments.
- Type
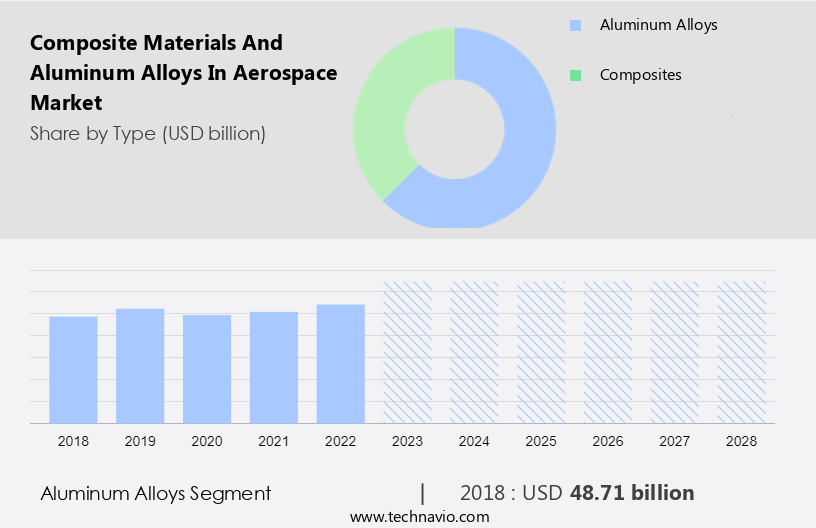
- Aluminum alloys
- Composites
- Application
- Commercial aircraft
- Military aircraft
- Business and general aviation
- Helicopters
- Geography
- North America
- US
- Europe
- Germany
- France
- APAC
- China
- Japan
- South America
- Middle East and Africa
- North America
By Type Insights
- The aluminum alloys segment is estimated to witness significant growth during the forecast period.
Aluminum alloys, recognized for their superior strength-to-weight ratio and corrosion resistance, dominate the aerospace market due to their versatility. The aluminum alloys segment is categorized into various types, each tailored to specific industry requirements. Notably, 2000 series alloys are extensively utilized In the aerospace sector, appreciated for their high tensile strength and superior fatigue resistance. These alloys significantly contribute to aircraft manufacturing, particularly In the production of airframes and wings. Commercial aircraft, such as the Boeing 787 and Airbus A350, incorporate 2000 series aluminum alloys. Lightweight and fuel-efficient aircraft, a priority In the current financial strain for airlines and travel restrictions, benefit significantly from these alloys.
Get a glance at the market report of share of various segments Request Free Sample
The aluminum alloys segment was valued at USD 48.71 billion in 2018 and showed a gradual increase during the forecast period.
Regional Analysis
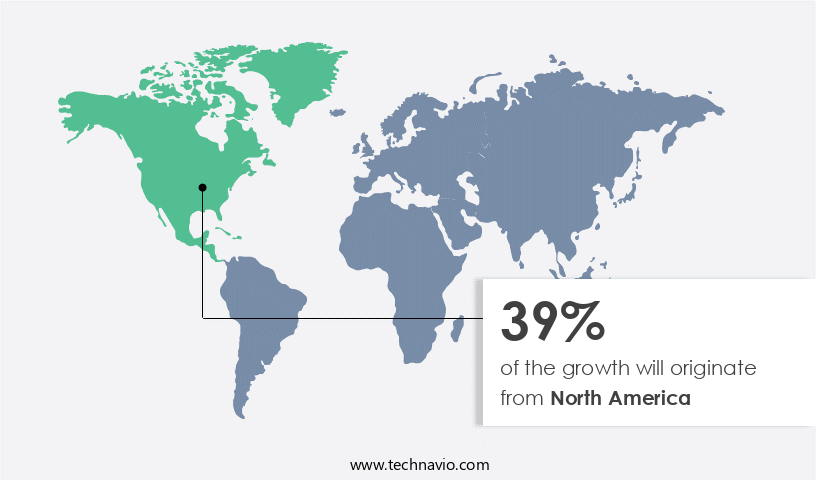
- North America is estimated to contribute 39% to the growth of the global market during the forecast period.
Technavio's analysts have elaborately explained the regional trends and drivers that shape the market during the forecast period.
For more insights on the market size of various regions, Request Free Sample
The North American market dominates the global composite materials and aluminum alloys industry in aerospace, driven by the region's emphasis on lightweight, fuel-efficient aircraft. Major players, such as Boeing and Lockheed Martin, based In the US and Canada, utilize composite materials extensively In their high-performance aircraft, like Boeing's B787 Dreamliner, which enhances fuel efficiency and performance. Aluminum alloys are also in high demand due to their desirable properties, including high strength-to-weight ratio and corrosion resistance. Aircraft manufacturers in North America prioritize these materials for airframes and wings, contributing to the industry's growth. Commercial and military applications, including aircraft carriers, larger airplanes, helicopters, and UAVs, further expand the market's scope.
Market Dynamics
Our researchers analyzed the data with 2023 as the base year, along with the key drivers, trends, and challenges. A holistic analysis of drivers will help companies refine their marketing strategies to gain a competitive advantage.
What are the key market drivers leading to the rise In the adoption of Composite Materials and Aluminum Alloys in Aerospace Industry?
Increasing demand for weight reduction and fuel efficiency in aircraft is the key driver of the market.
- Composite materials and aluminum alloys are essential components In the manufacturing of aircraft, contributing to weight reduction while maintaining structural integrity. Composite materials, such as carbon fibers and glass fibers in polymer matrices, offer a superior strength-to-weight ratio, making them ideal for aerospace applications. The integration of composite materials with aluminum alloys leads to substantial weight savings, translating into improved fuel efficiency and reduced operational costs. Notable aircraft, like the Boeing 787 and Airbus A350, have successfully adopted composite materials extensively In their designs, resulting in fuel savings of up to 20% compared to conventional aircraft In the same class.
- This not only benefits airlines by lowering fuel costs but also reduces the environmental impact of air travel. The aviation industry, under financial strain due to travel restrictions and increased competition from low-cost carriers (LCCs), is seeking innovative solutions to enhance performance and sustainability. Composite materials and aluminum alloys play a crucial role in this endeavor by enabling the production of lighter, fuel-efficient aircraft. Furthermore, military organizations and drone manufacturers also utilize these materials for their aircraft and helicopters, contributing to the end-use segmentation of the market. Titanium alloys and steel alloys, while not mentioned explicitly, are also essential structural components In the aerospace industry.
What are the market trends shaping the Composite Materials and Aluminum Alloys in Aerospace Industry?
Improved corrosion resistance of aluminum alloys is the upcoming market trend.
- In the aerospace sector, the demand for corrosion-resistant aluminum alloys and composite materials continues to grow due to their durability and ability to enhance fuel efficiency and reduce emissions in aircraft manufacturing. The harsh environmental conditions experienced during air travel necessitate the use of these materials in airframes and wings. Corrosion, a significant threat to structural integrity and performance, drives the development of advanced aluminum alloys with improved corrosion resistance. Lightweight and fuel-efficient aircraft, such as the Boeing 787 and Airbus A350, are prime examples of this trend. While aluminum alloys are commonly used for their low density and strength, they have historically been susceptible to corrosion.
- To address this issue, manufacturers invest in research and development to produce corrosion-resistant aluminum alloys, including those made with titanium and steel alloys. Composites, which consist of carbon fibers, glass fibers, and polymer matrices, are also gaining popularity due to their high strength-to-weight ratio and low density. End-use segmentation includes commercial aircraft, military aircraft, helicopters, and UAVs. The focus on sustainability, performance, and reducing operational costs, particularly In the face of the financial strain caused by travel restrictions and the impact on the airline industry, further drives the adoption of these materials.
What challenges does the Composite Materials and Aluminum Alloys in Aerospace Industry face during its growth?
Complexity issues related to repair and maintenance of composite materials and alloys is a key challenge affecting the industry growth.
- The composite materials and aluminum alloys market in aerospace applications is experiencing intricate challenges due to the complexity of repair and maintenance processes. Composite materials, which consist of multiple components such as carbon fibers, glass fibers, and polymer matrices, differ from traditional materials like metals. This complexity necessitates specialized knowledge, advanced equipment, and skilled labor for damage assessment and repair. For instance, when composite structures in an aircraft are damaged, determining the extent and type of damage requires sophisticated, non-destructive testing methods. This increases the complexity and cost of repairs. Aircraft manufacturers like Boeing and Airbus have responded by introducing composite materials in airframes and wings for their fuel-efficient aircraft, such as the Boeing 787 and Airbus A350, to reduce operational costs and emissions in air travel.
- However, the financial strain on airlines and the increasing demand for low-cost carriers (LCCs) may impact the market's growth. Additionally, military organizations and UAV manufacturers also use composites for their military aircraft, helicopters, and structural components. The market's value and volume are influenced by factors such as sustainability, performance, and supply chain dynamics. Titanium alloys and steel alloys continue to be used in fuselages and wings, but composites offer advantages in lightweight design and corrosion resistance. The market's future growth may depend on the development of cost-effective repair and maintenance solutions for composite structures.
Exclusive Customer Landscape
The market forecasting report includes the adoption lifecycle of the market, covering from the innovator's stage to the laggard's stage. It focuses on adoption rates in different regions based on penetration. Furthermore, the market report also includes key purchase criteria and drivers of price sensitivity to help companies evaluate and develop their market growth analysis strategies.

Customer Landscape
Key Companies & Market Insights
Companies are implementing various strategies, such as strategic alliances, market forecast, partnerships, mergers and acquisitions, geographical expansion, and product/service launches, to enhance their presence in the industry.
The industry research and growth report includes detailed analyses of the competitive landscape of the market and information about key companies, including:
- Alcoa Corp.
- Allegheny Technologies Inc.
- AMG Advanced Metallurgical Group NV
- Arconic Corp.
- Berkshire Hathaway Inc.
- Constellium SE
- General Electric Co.
- Hexcel Corp.
- Hindalco Industries Ltd.
- Kaiser Aluminum Corp.
- Kobe Steel Ltd.
- Materion Corp.
- Mitsubishi Chemical Group Corp.
- Owens Corning
- SGL Carbon SE
- Solvay SA
- Teijin Ltd.
- The Boeing Co.
- thyssenkrupp AG
- Toray Industries Inc.
Qualitative and quantitative analysis of companies has been conducted to help clients understand the wider business environment as well as the strengths and weaknesses of key industry players. Data is qualitatively analyzed to categorize companies as pure play, category-focused, industry-focused, and diversified; it is quantitatively analyzed to categorize companies as dominant, leading, strong, tentative, and weak.
Research Analyst Overview
Composite materials and aluminum alloys have emerged as significant players In the aerospace industry, revolutionizing the manufacturing of airframes, wings, and other structural components for both civilian and military applications. These materials offer numerous advantages, including enhanced fuel efficiency, reduced emissions, and improved corrosion resistance. Aircraft manufacturing has witnessed a paradigm shift towards the use of lightweight, fuel-efficient materials to mitigate the financial strain experienced by airlines due to operational costs. Composite materials, such as carbon fibers and glass fibers reinforced in polymer matrices, have gained prominence due to their high strength-to-weight ratio and excellent durability. The aviation sector's emphasis on sustainability and performance has further fueled the demand for composite materials and aluminum alloys.
In addition, air travel, a major contributor to greenhouse gas emissions, is under increasing scrutiny, and the adoption of fuel-efficient aircraft is a crucial step towards reducing the industry's carbon footprint. The aerospace industry's reliance on composite materials is not limited to commercial aircraft. Military organizations have also recognized their potential, with applications ranging from helicopters to larger airplanes and even military carriers. Composites have become indispensable in various end-use segments, including fuselages, wings, and structural components. The adoption of composite materials and aluminum alloys In the aerospace industry is driven by their inherent properties. These materials offer superior strength, low density, and excellent resistance to corrosion, making them ideal for the demanding conditions of air travel.
Moreover, their use contributes to the overall sustainability of the aviation sector by reducing fuel consumption and emissions. The aerospace industry's supply chain has adapted to accommodate the increasing demand for composite materials and aluminum alloys. Traditional materials, such as titanium alloys and steel alloys, continue to be used in specific applications but are being gradually replaced by composites. The use of composites In the aerospace industry is not limited to large commercial aircraft. Unmanned aerial vehicles (UAVs or drones) also benefit from the advantages offered by these materials. Their lightweight and high-strength properties make composites an attractive choice for drone manufacturers. Furthermore, the financial implications of the COVID-19 pandemic have brought travel restrictions and operational challenges to the aviation industry. However, the long-term outlook for the aerospace sector remains positive, with the continued adoption of composite materials and aluminum alloys expected to drive growth and innovation.
|
Market Scope |
|
|
Report Coverage |
Details |
|
Page number |
168 |
|
Base year |
2023 |
|
Historic period |
2018-2022 |
|
Forecast period |
2024-2028 |
|
Growth momentum & CAGR |
Accelerate at a CAGR of 9.23% |
|
Market growth 2024-2028 |
USD 49.39 billion |
|
Market structure |
Fragmented |
|
YoY growth 2023-2024(%) |
8.79 |
|
Key countries |
US, China, Japan, Germany, and France |
|
Competitive landscape |
Leading Companies, market growth and forecasting, Market Positioning of Companies, Competitive Strategies, and Industry Risks |
What are the Key Data Covered in this Market Research and Growth Report?
- CAGR of the Composite Materials and Aluminum Alloys in Aerospace industry during the forecast period
- Detailed information on factors that will drive the growth and forecasting between 2024 and 2028
- Precise estimation of the size of the market and its contribution of the industry in focus to the parent market
- Accurate predictions about upcoming growth and trends and changes in consumer behaviour
- Growth of the market across North America, Europe, APAC, South America, and Middle East and Africa
- Thorough analysis of the market's competitive landscape and detailed information about companies
- Comprehensive analysis of factors that will challenge the market growth of industry companies
We can help! Our analysts can customize this market research report to meet your requirements.
 RIA -
RIA - 
