Comprehensive Metabolic Panel Testing Market Analysis, Size, and Forecast 2025-2029: North America (US, Canada, and Mexico), APAC (China, India, and Japan), Europe (Germany, UK, and France), South America (Brazil), Middle East and Africa (UAE, South Africa, and Saudi Arabia), Asia, Rest of World (ROW)

Comprehensive Metabolic Panel Testing Market Analysis, Size, and Forecast 2025-2029:
North America (US, Canada, and Mexico), APAC (China, India, and Japan), Europe (Germany, UK, and France), South America (Brazil), Middle East and Africa (UAE, South Africa, and Saudi Arabia), Asia, Rest of World (ROW)

Published: Dec 2025 308 Pages SKU: IRTNTR81149

Market Overview at a Glance

$5.84 B
Market Opportunity
8.6%
CAGR 2024 - 2029
40%
North America Growth
$3.88 B
Kidney diseases segment 2023

Comprehensive Metabolic Panel Testing Market Size 2025-2029

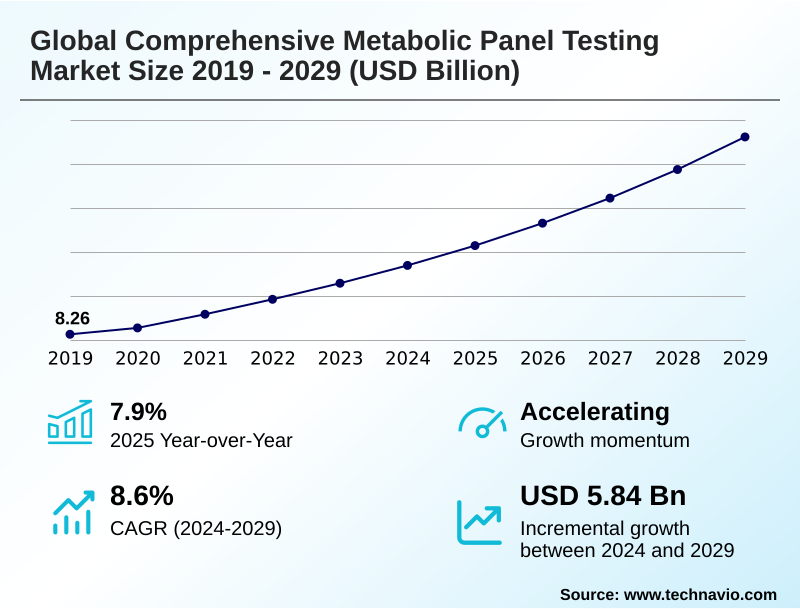
The comprehensive metabolic panel testing market size is valued to increase by USD 5.84 billion, at a CAGR of 8.6% from 2024 to 2029. Escalating incidence of chronic diseases will drive the comprehensive metabolic panel testing market.

Major Market Trends & Insights

  • North America dominated the market and accounted for a 40% growth during the forecast period.
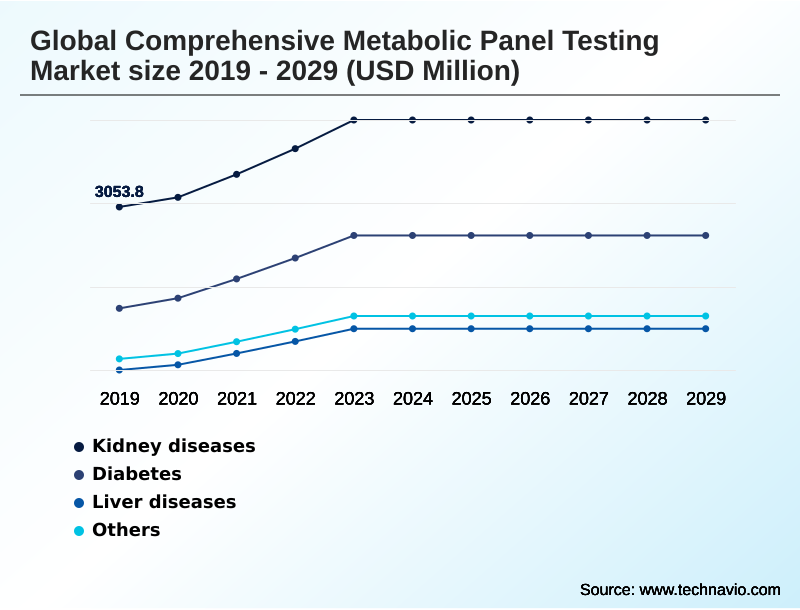
  • By Application - Kidney diseases segment was valued at USD 3.88 billion in 2023
  • By Test - Kidney function tests segment accounted for the largest market revenue share in 2023

Market Size & Forecast

  • Market Opportunities: USD 8.96 billion
  • Market Future Opportunities: USD 5.84 billion
  • CAGR from 2024 to 2029 : 8.6%

Market Summary

  • The comprehensive metabolic panel testing market is fundamental to modern healthcare, providing a broad overview of an individual's metabolic health, including kidney and liver function, electrolyte balance, and blood glucose levels. Growth is driven by the rising prevalence of chronic conditions and an aging population, which demand regular monitoring for effective chronic disease management.
  • A significant trend is the shift towards decentralized testing, including point-of-care testing (POCT) and at-home solutions, which offer convenience and rapid results. For instance, a large laboratory network can optimize its diagnostic workflow by deploying CLIA-waived tests in satellite clinics, reducing sample transportation time and enabling faster clinical decision support.
  • This enhances operational efficiency by balancing the workload between high-throughput screening in central labs and rapid diagnostics at the periphery. However, the market faces challenges from stringent regulatory compliance frameworks for in-vitro diagnostics (IVD), including laboratory-developed tests (LDTs), and complex reimbursement policies that can limit adoption.
  • The integration of artificial intelligence for post-analytical data interpretation and early disease detection presents a major opportunity, promising to improve the predictive power of metabolic assessments.

What will be the Size of the Comprehensive Metabolic Panel Testing Market during the forecast period?

Get Key Insights on Market Forecast (PDF) Request Free Sample

How is the Comprehensive Metabolic Panel Testing Market Segmented?

The comprehensive metabolic panel testing industry research report provides comprehensive data (region-wise segment analysis), with forecasts and estimates in "USD million" for the period 2025-2029, as well as historical data from 2019-2023 for the following segments.

  • Application
    • Kidney diseases
    • Diabetes
    • Liver diseases
    • Others
  • Test
    • Kidney function tests
    • Glucose
    • Liver function tests
    • Electrolytes
    • Others
  • End-user
    • Laboratories
    • Hospital
    • Point-of-care testing
    • Emergency departments
    • Others
  • Geography
    • North America
      • US
      • Canada
      • Mexico
    • Asia
    • Europe
      • Germany
      • UK
      • France
    • Rest of World (ROW)

By Application Insights

The kidney diseases segment is estimated to witness significant growth during the forecast period.

The comprehensive metabolic panel testing market application in kidney disease management is expanding, driven by the need for regular monitoring of analytes such as blood urea nitrogen (BUN) and creatinine.

The comprehensive metabolic panel, a key tool in chronic disease management, provides essential data on kidney function through tests for creatinine clearance and estimated glomerular filtration rate (eGFR).

As healthcare systems emphasize early disease detection, the use of a basic metabolic panel alongside the urine albumin-to-creatinine ratio (UACR) is becoming standard. Advances in non-invasive diagnostics and high-throughput screening technologies are improving diagnostic workflow optimization.

This focus on proactive monitoring and value-based healthcare models has led to a 15% improvement in the early detection rates of diabetic nephropathy in targeted population health management programs.

Request Free Sample

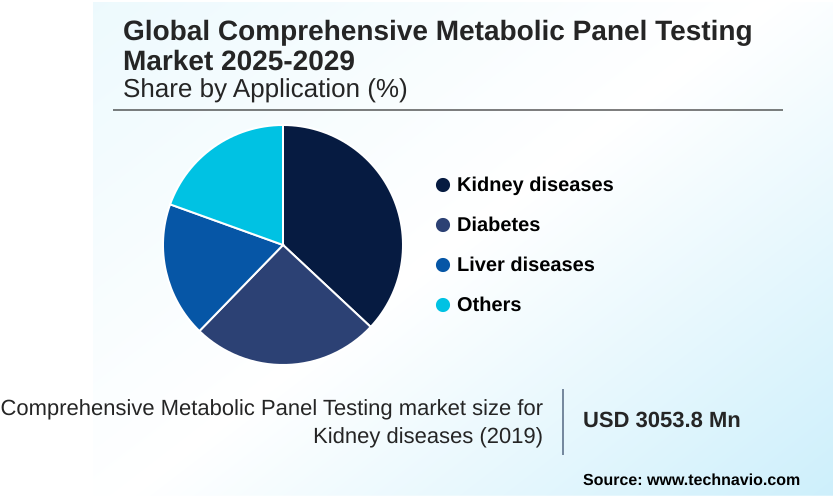
The Kidney diseases segment was valued at USD 3.88 billion in 2023 and showed a gradual increase during the forecast period.

Request Free Sample

Regional Analysis

North America is estimated to contribute 40% to the growth of the global market during the forecast period.Technavio’s analysts have elaborately explained the regional trends and drivers that shape the market during the forecast period.

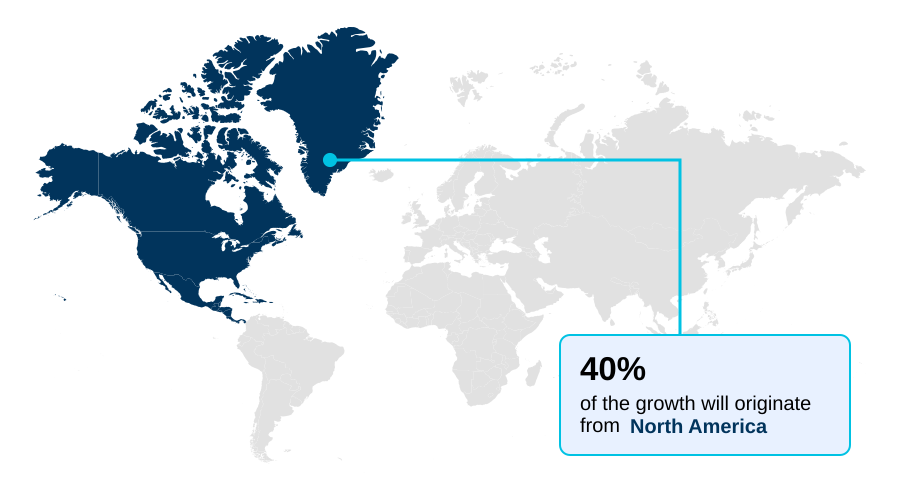
See How Comprehensive Metabolic Panel Testing Market Demand is Rising in North America Request Free Sample

The geographic landscape of the comprehensive metabolic panel testing market is shaped by regional healthcare priorities and technological adoption rates.

In North America, which accounts for approximately 40% of the market's incremental growth, the high prevalence of chronic diseases drives demand. The region's advanced infrastructure supports widespread use of automated chemistry analyzer systems and mass spectrometry platforms for high-throughput screening.

In contrast, markets in Asia are focusing on improving healthcare access through point-of-care testing (POCT) and mobile health initiatives. Europe's market is characterized by stringent regulatory compliance frameworks, such as the IVDR, which influence product development and market entry.

Across all regions, the integration of biosensor technology and microfluidics technology is enabling the development of more compact and efficient diagnostic tools, with some advanced analyzers now capable of processing over 50 key assays in under 14 minutes, enhancing diagnostic test validation and turnaround times.
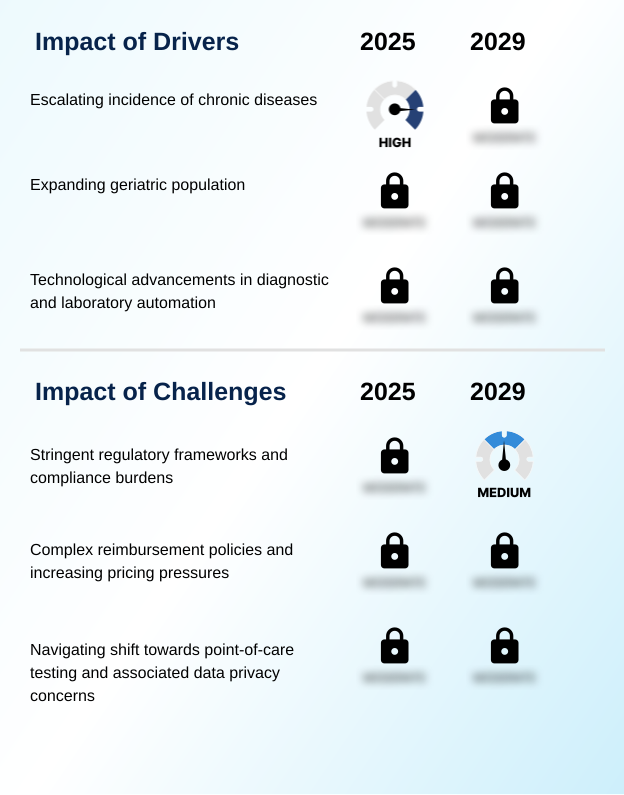
Market Dynamics

Our researchers analyzed the data with 2024 as the base year, along with the key drivers, trends, and challenges. A holistic analysis of drivers will help companies refine their marketing strategies to gain a competitive advantage.

  • Strategic focus within the comprehensive metabolic panel testing market is increasingly granular, addressing specific clinical needs and patient pathways. The discussion around a comprehensive vs basic metabolic panel is pivotal in primary care for optimizing diagnostic spending.
  • For chronic conditions, the use of a comprehensive metabolic panel for diabetes management and as a metabolic panel for kidney disease is standard practice, with interpretation guides becoming essential clinical tools. The role of liver function tests in cmp is critical for monitoring medication toxicity, while understanding electrolyte imbalance and metabolic panel results is key in acute settings.
  • The growth of point-of-care metabolic panel devices and at-home metabolic testing kits is reshaping patient access, raising questions about insurance coverage for cmp testing. The application of ai in metabolic panel analysis promises to revolutionize early detection. In specialized areas, a pediatric comprehensive metabolic panel requires different reference ranges, and metabolic testing for weight loss is a growing consumer trend.
  • Clinicians must also consider how to prepare for a cmp test and what to do with abnormal cmp results next, including understanding the impact of medication on cmp.
  • In terms of business outcomes, a decentralized testing model using at-home kits has been shown to reduce hospital readmission rates for certain chronic conditions by more than 10% compared to traditional protocols, optimizing resource allocation.

What are the key market drivers leading to the rise in the adoption of Comprehensive Metabolic Panel Testing Industry?

  • The escalating incidence of chronic diseases, which necessitate regular monitoring for effective patient management, is a key driver for the comprehensive metabolic panel testing market.

  • The market's primary driver is the escalating burden of chronic, lifestyle-associated diseases.
  • The high prevalence of these conditions, with nearly half of adults in some developed nations having a cardiovascular disease and nine out of ten older adults reporting at least one chronic illness, creates sustained demand for routine monitoring.
  • This demographic reality necessitates a significantly higher frequency of screenings, including kidney function tests and liver function tests, for at-risk populations. This demand underpins the need for efficient population health management strategies and personalized medicine insights.
  • The clinical utility of both the comprehensive metabolic panel and specialized in-vitro diagnostics (IVD) in managing conditions like diabetic nephropathy monitoring and cardiovascular risk stratification ensures their central role in the healthcare continuum, driving consistent testing volumes and technological innovation in clinical chemistry assays.

What are the market trends shaping the Comprehensive Metabolic Panel Testing Industry?

  • The ascendancy of point-of-care metabolic panel testing signifies a key market trend. This shift is driven by the growing demand for rapid, near-patient analysis in diverse healthcare environments.

  • Key market trends are redefining the delivery and utility of metabolic assessments. The proliferation of direct-to-consumer (DTC) testing and at-home solutions, powered by advancements in biosensor technology, is enabling greater patient autonomy in metabolic health assessment.
  • The integration of AI into diagnostics, exemplified by tools using over 20 parameters for risk stratification, is enhancing predictive accuracy by more than 15% over traditional methods.
  • Concurrently, the adoption of point-of-care testing (POCT) in clinical settings is accelerating, with handheld analyzers delivering lab-quality results for a basic metabolic panel within minutes—a stark contrast to the multi-hour turnaround from centralized labs.
  • This shift toward decentralized, technology-driven diagnostics is a cornerstone of modern geriatric medicine screening and remote patient monitoring, supported by robust electronic health record (EHR) integration for seamless data flow.

What challenges does the Comprehensive Metabolic Panel Testing Industry face during its growth?

  • Stringent regulatory frameworks and their associated compliance burdens present a key challenge affecting the growth and innovation of the comprehensive metabolic panel testing industry.

  • Navigating complex regulatory and data privacy landscapes presents a significant market challenge. Adherence to stringent regulatory compliance frameworks, such as evolving rules for laboratory-developed tests (LDTs) and in-vitro diagnostics (IVD), increases compliance costs for manufacturers by an estimated 20-30%, impacting R&D for new immunoassay systems.
  • Furthermore, the rise of direct-to-consumer testing introduces data privacy and security risks, with audits revealing that over 60% of some firms have vague policies, creating challenges for quality management system (QMS) adherence.
  • This environment complicates reimbursement policy navigation and requires robust frameworks for diagnostic test validation to ensure both accuracy and security, especially as laboratory information system (LIS) integration becomes more widespread. These hurdles impact the seamless adoption of new technologies and influence overall market accessibility.

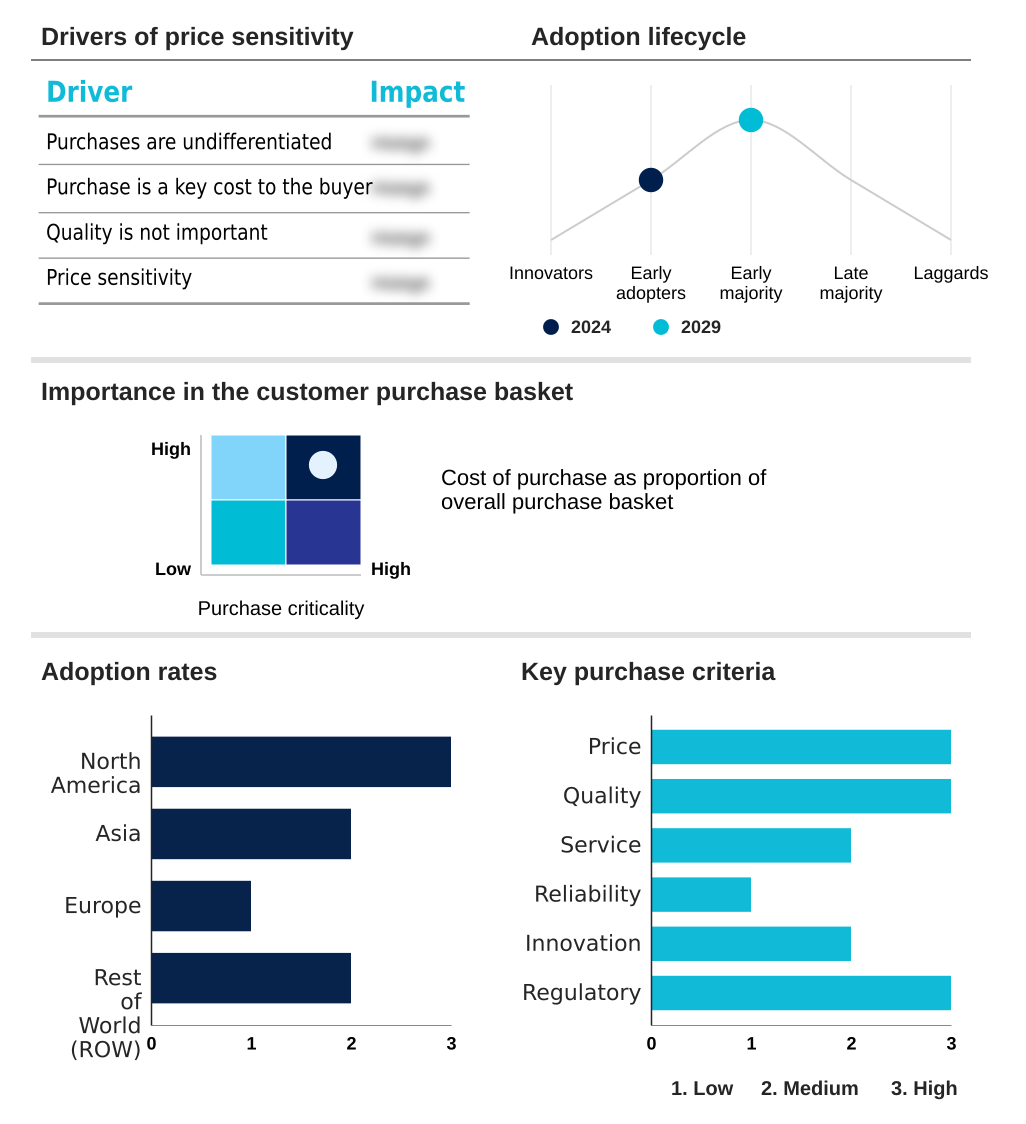
Exclusive Technavio Analysis on Customer Landscape

The comprehensive metabolic panel testing market forecasting report includes the adoption lifecycle of the market, covering from the innovator’s stage to the laggard’s stage. It focuses on adoption rates in different regions based on penetration. Furthermore, the comprehensive metabolic panel testing market report also includes key purchase criteria and drivers of price sensitivity to help companies evaluate and develop their market growth analysis strategies.

Customer Landscape of Comprehensive Metabolic Panel Testing Industry

Competitive Landscape

Companies are implementing various strategies, such as strategic alliances, comprehensive metabolic panel testing market forecast, partnerships, mergers and acquisitions, geographical expansion, and product/service launches, to enhance their presence in the industry.

Abbott Laboratories - Core laboratory solutions provide essential assays assessing liver, kidney, heart, and metabolic function, forming a foundational component of modern diagnostic services and clinical decision support.

The industry research and growth report includes detailed analyses of the competitive landscape of the market and information about key companies, including:

  • Abbott Laboratories
  • ARUP Laboratories
  • Beckman Coulter Inc.
  • Bio Rad Laboratories Inc.
  • CENTOGENE NV
  • DiaSorin Spa
  • F. Hoffmann La Roche Ltd.
  • Laboratory Corp.
  • Mayo Medical Laboratories
  • Metropolis Healthcare Ltd.
  • Quest Diagnostics Inc.
  • QuidelOrtho Corp.
  • Randox Laboratories Ltd.
  • Siemens Healthineers AG
  • Sonic Healthcare Ltd.
  • SYNLAB International GmbH
  • Thermo Fisher Scientific Inc.
  • Unipath Specialty Laboratory Ltd.

Qualitative and quantitative analysis of companies has been conducted to help clients understand the wider business environment as well as the strengths and weaknesses of key industry players. Data is qualitatively analyzed to categorize companies as pure play, category-focused, industry-focused, and diversified; it is quantitatively analyzed to categorize companies as dominant, leading, strong, tentative, and weak.

Recent Development and News in Comprehensive metabolic panel testing market

  • In August, 2024, the U.S. Food and Drug Administration cleared the first over-the-counter continuous glucose biosensor for adults with type 2 diabetes not using insulin, expanding consumer access to metabolic health data.
  • In October, 2024, Labcorp announced its role as the exclusive U.S. distributor for the first FDA-authorized over-the-counter syphilis test, a move aimed at broadening the accessibility of critical diagnostics.
  • In December, 2024, a partnership was announced between Philips and icometrix to integrate AI-powered brain imaging capabilities, showcasing the trend of incorporating artificial intelligence to enhance diagnostic precision.
  • In January, 2025, South Korea's Ministry of Food and Drug Safety implemented the Digital Medical Products Act, establishing a formal approval pathway for AI-enhanced diagnostics and fostering innovation within the sector.

Dive into Technavio’s robust research methodology, blending expert interviews, extensive data synthesis, and validated models for unparalleled Comprehensive Metabolic Panel Testing Market insights. See full methodology.

Market Scope
Page number 308
Base year 2024
Historic period 2019-2023
Forecast period 2025-2029
Growth momentum & CAGR Accelerate at a CAGR of 8.6%
Market growth 2025-2029 USD 5839.0 million
Market structure Fragmented
YoY growth 2024-2025(%) 7.9%
Key countries US, Canada, Mexico, China, India, Japan, South Korea, Indonesia, Thailand, Singapore, Germany, UK, France, Italy, The Netherlands, Spain, Russia, Australia, Brazil, UAE, South Africa, Saudi Arabia and Turkey
Competitive landscape Leading Companies, Market Positioning of Companies, Competitive Strategies, and Industry Risks

Request Free Sample

Research Analyst Overview

  • The comprehensive metabolic panel testing market is defined by its critical role in foundational diagnostics, utilizing a range of technologies from clinical chemistry assays to advanced immunoassay systems and molecular diagnostics. The standard comprehensive metabolic panel assesses key indicators like blood glucose levels, creatinine clearance, blood urea nitrogen (BUN), and calcium concentration.
  • It includes specific liver function tests such as alanine transaminase (ALT), aspartate transaminase (AST), alkaline phosphatase (ALP), and total bilirubin, alongside serum albumin levels and total protein measurement to evaluate nutritional status. Electrolyte balance is monitored through sodium levels, potassium concentration, chloride levels, and CO2 (bicarbonate) levels.
  • A key boardroom consideration is the capital investment in high-throughput screening systems versus decentralized point-of-care testing (POCT) platforms. The adoption of an advanced automated chemistry analyzer can reduce sample processing time by over 30% compared to manual methods.
  • The market is also navigating the regulatory landscape for laboratory-developed tests (LDTs) and CLIA-waived tests, with continuous glucose monitoring (CGM) and non-invasive diagnostics emerging as transformative forces influencing future product strategies.

What are the Key Data Covered in this Comprehensive Metabolic Panel Testing Market Research and Growth Report?

  • What is the expected growth of the Comprehensive Metabolic Panel Testing Market between 2025 and 2029?

    • USD 5.84 billion, at a CAGR of 8.6%

  • What segmentation does the market report cover?

    • The report is segmented by Application (Kidney diseases, Diabetes, Liver diseases, and Others), Test (Kidney function tests, Glucose, Liver function tests, Electrolytes, and Others), End-user (Laboratories, Hospital, Point-of-care testing, Emergency departments, and Others) and Geography (North America, Asia, Europe, Rest of World (ROW))

  • Which regions are analyzed in the report?

    • North America, Asia, Europe and Rest of World (ROW)

  • What are the key growth drivers and market challenges?

    • Escalating incidence of chronic diseases, Stringent regulatory frameworks and compliance burdens

  • Who are the major players in the Comprehensive Metabolic Panel Testing Market?

    • Abbott Laboratories, ARUP Laboratories, Beckman Coulter Inc., Bio Rad Laboratories Inc., CENTOGENE NV, DiaSorin Spa, F. Hoffmann La Roche Ltd., Laboratory Corp., Mayo Medical Laboratories, Metropolis Healthcare Ltd., Quest Diagnostics Inc., QuidelOrtho Corp., Randox Laboratories Ltd., Siemens Healthineers AG, Sonic Healthcare Ltd., SYNLAB International GmbH, Thermo Fisher Scientific Inc. and Unipath Specialty Laboratory Ltd.

Market Research Insights

  • The dynamics of the comprehensive metabolic panel testing market are increasingly shaped by the pursuit of operational efficiency and improved patient outcomes. The adoption of telehealth diagnostic services, for example, has demonstrated the potential to reduce unnecessary screening metabolic panels by over 15% through better patient triage and adherence to medical necessity criteria.
  • Concurrently, the integration of point-of-care testing within hospital emergency departments has been linked to a reduction in patient length-of-stay by up to 20%, directly impacting value-based healthcare model metrics. These shifts highlight a strategic pivot towards more targeted and efficient diagnostic workflow optimization.
  • As healthcare providers navigate complex reimbursement policy navigation, data-driven approaches that prove clinical and economic value are becoming essential for sustaining growth and justifying investment in advanced diagnostic platforms and remote patient monitoring technologies.

We can help! Our analysts can customize this comprehensive metabolic panel testing market research report to meet your requirements.

Get in touch

1. Executive Summary

1.1 Market overview

Executive Summary - Chart on Market Overview
Executive Summary - Data Table on Market Overview
Executive Summary - Chart on Global Market Characteristics
Executive Summary - Chart on Market by Geography
Executive Summary - Chart on Market Segmentation by Application
Executive Summary - Chart on Market Segmentation by Test
Executive Summary - Chart on Market Segmentation by End-user
Executive Summary - Chart on Incremental Growth
Executive Summary - Data Table on Incremental Growth
Executive Summary - Chart on Company Market Positioning

2. Technavio Analysis

2.1 Analysis of price sensitivity, lifecycle, customer purchase basket, adoption rates, and purchase criteria

2.2 Criticality of inputs and Factors of differentiation

Chart on Overview on criticality of inputs and factors of differentiation

2.3 Factors of disruption

Chart on Overview on factors of disruption

2.4 Impact of drivers and challenges

Chart on Impact of drivers and challenges in 2024 and 2029

3. Market Landscape

3.1 Market ecosystem

Chart on Parent Market
Data Table on - Parent Market

3.2 Market characteristics

Chart on Market characteristics analysis

3.3 Value chain analysis

Chart on Value chain analysis

4. Market Sizing

4.1 Market definition

Data Table on Offerings of companies included in the market definition

4.2 Market segment analysis

Market segments

4.3 Market size 2024

4.4 Market outlook: Forecast for 2024-2029

Chart on Global - Market size and forecast 2024-2029 ($ million)
Data Table on Global - Market size and forecast 2024-2029 ($ million)
Chart on Global Market: Year-over-year growth 2024-2029 (%)
Data Table on Global Market: Year-over-year growth 2024-2029 (%)

5. Historic Market Size

5.1 Global Comprehensive Metabolic Panel Testing Market 2019 - 2023

Historic Market Size - Data Table on Global Comprehensive Metabolic Panel Testing Market 2019 - 2023 ($ million)

5.2 Application segment analysis 2019 - 2023

Historic Market Size - Application Segment 2019 - 2023 ($ million)

5.3 Test segment analysis 2019 - 2023

Historic Market Size - Test Segment 2019 - 2023 ($ million)

5.4 End-user segment analysis 2019 - 2023

Historic Market Size - End-user Segment 2019 - 2023 ($ million)

5.5 Geography segment analysis 2019 - 2023

Historic Market Size - Geography Segment 2019 - 2023 ($ million)

5.6 Country segment analysis 2019 - 2023

Historic Market Size - Country Segment 2019 - 2023 ($ million)

6. Qualitative Analysis

6.1 Impact of AI in global comprehensive metabolic panel testing market

7. Five Forces Analysis

7.1 Five forces summary

Five forces analysis - Comparison between 2024 and 2029

7.2 Bargaining power of buyers

Bargaining power of buyers - Impact of key factors 2024 and 2029

7.3 Bargaining power of suppliers

Bargaining power of suppliers - Impact of key factors in 2024 and 2029

7.4 Threat of new entrants

Threat of new entrants - Impact of key factors in 2024 and 2029

7.5 Threat of substitutes

Threat of substitutes - Impact of key factors in 2024 and 2029

7.6 Threat of rivalry

Threat of rivalry - Impact of key factors in 2024 and 2029

7.7 Market condition

Chart on Market condition - Five forces 2024 and 2029

8. Market Segmentation by Application

8.1 Market segments

Chart on Application - Market share 2024-2029 (%)
Data Table on Application - Market share 2024-2029 (%)

8.2 Comparison by Application

Chart on Comparison by Application
Data Table on Comparison by Application

8.3 Kidney diseases - Market size and forecast 2024-2029

Chart on Kidney diseases - Market size and forecast 2024-2029 ($ million)
Data Table on Kidney diseases - Market size and forecast 2024-2029 ($ million)
Chart on Kidney diseases - Year-over-year growth 2024-2029 (%)
Data Table on Kidney diseases - Year-over-year growth 2024-2029 (%)

8.4 Diabetes - Market size and forecast 2024-2029

Chart on Diabetes - Market size and forecast 2024-2029 ($ million)
Data Table on Diabetes - Market size and forecast 2024-2029 ($ million)
Chart on Diabetes - Year-over-year growth 2024-2029 (%)
Data Table on Diabetes - Year-over-year growth 2024-2029 (%)

8.5 Liver diseases - Market size and forecast 2024-2029

Chart on Liver diseases - Market size and forecast 2024-2029 ($ million)
Data Table on Liver diseases - Market size and forecast 2024-2029 ($ million)
Chart on Liver diseases - Year-over-year growth 2024-2029 (%)
Data Table on Liver diseases - Year-over-year growth 2024-2029 (%)

8.6 Others - Market size and forecast 2024-2029

Chart on Others - Market size and forecast 2024-2029 ($ million)
Data Table on Others - Market size and forecast 2024-2029 ($ million)
Chart on Others - Year-over-year growth 2024-2029 (%)
Data Table on Others - Year-over-year growth 2024-2029 (%)

8.7 Market opportunity by Application

Market opportunity by Application ($ million)
Data Table on Market opportunity by Application ($ million)

9. Market Segmentation by Test

9.1 Market segments

Chart on Test - Market share 2024-2029 (%)
Data Table on Test - Market share 2024-2029 (%)

9.2 Comparison by Test

Chart on Comparison by Test
Data Table on Comparison by Test

9.3 Kidney function tests - Market size and forecast 2024-2029

Chart on Kidney function tests - Market size and forecast 2024-2029 ($ million)
Data Table on Kidney function tests - Market size and forecast 2024-2029 ($ million)
Chart on Kidney function tests - Year-over-year growth 2024-2029 (%)
Data Table on Kidney function tests - Year-over-year growth 2024-2029 (%)

9.4 Glucose - Market size and forecast 2024-2029

Chart on Glucose - Market size and forecast 2024-2029 ($ million)
Data Table on Glucose - Market size and forecast 2024-2029 ($ million)
Chart on Glucose - Year-over-year growth 2024-2029 (%)
Data Table on Glucose - Year-over-year growth 2024-2029 (%)

9.5 Liver function tests - Market size and forecast 2024-2029

Chart on Liver function tests - Market size and forecast 2024-2029 ($ million)
Data Table on Liver function tests - Market size and forecast 2024-2029 ($ million)
Chart on Liver function tests - Year-over-year growth 2024-2029 (%)
Data Table on Liver function tests - Year-over-year growth 2024-2029 (%)

9.6 Electrolytes - Market size and forecast 2024-2029

Chart on Electrolytes - Market size and forecast 2024-2029 ($ million)
Data Table on Electrolytes - Market size and forecast 2024-2029 ($ million)
Chart on Electrolytes - Year-over-year growth 2024-2029 (%)
Data Table on Electrolytes - Year-over-year growth 2024-2029 (%)

9.7 Others - Market size and forecast 2024-2029

Chart on Others - Market size and forecast 2024-2029 ($ million)
Data Table on Others - Market size and forecast 2024-2029 ($ million)
Chart on Others - Year-over-year growth 2024-2029 (%)
Data Table on Others - Year-over-year growth 2024-2029 (%)

9.8 Market opportunity by Test

Market opportunity by Test ($ million)
Data Table on Market opportunity by Test ($ million)

10. Market Segmentation by End-user

10.1 Market segments

Chart on End-user - Market share 2024-2029 (%)
Data Table on End-user - Market share 2024-2029 (%)

10.2 Comparison by End-user

Chart on Comparison by End-user
Data Table on Comparison by End-user

10.3 Laboratories - Market size and forecast 2024-2029

Chart on Laboratories - Market size and forecast 2024-2029 ($ million)
Data Table on Laboratories - Market size and forecast 2024-2029 ($ million)
Chart on Laboratories - Year-over-year growth 2024-2029 (%)
Data Table on Laboratories - Year-over-year growth 2024-2029 (%)

10.4 Hospital - Market size and forecast 2024-2029

Chart on Hospital - Market size and forecast 2024-2029 ($ million)
Data Table on Hospital - Market size and forecast 2024-2029 ($ million)
Chart on Hospital - Year-over-year growth 2024-2029 (%)
Data Table on Hospital - Year-over-year growth 2024-2029 (%)

10.5 Point-of-care testing - Market size and forecast 2024-2029

Chart on Point-of-care testing - Market size and forecast 2024-2029 ($ million)
Data Table on Point-of-care testing - Market size and forecast 2024-2029 ($ million)
Chart on Point-of-care testing - Year-over-year growth 2024-2029 (%)
Data Table on Point-of-care testing - Year-over-year growth 2024-2029 (%)

10.6 Emergency departments - Market size and forecast 2024-2029

Chart on Emergency departments - Market size and forecast 2024-2029 ($ million)
Data Table on Emergency departments - Market size and forecast 2024-2029 ($ million)
Chart on Emergency departments - Year-over-year growth 2024-2029 (%)
Data Table on Emergency departments - Year-over-year growth 2024-2029 (%)

10.7 Others - Market size and forecast 2024-2029

Chart on Others - Market size and forecast 2024-2029 ($ million)
Data Table on Others - Market size and forecast 2024-2029 ($ million)
Chart on Others - Year-over-year growth 2024-2029 (%)
Data Table on Others - Year-over-year growth 2024-2029 (%)

10.8 Market opportunity by End-user

Market opportunity by End-user ($ million)
Data Table on Market opportunity by End-user ($ million)

11. Customer Landscape

11.1 Customer landscape overview

Analysis of price sensitivity, lifecycle, customer purchase basket, adoption rates, and purchase criteria

12. Geographic Landscape

12.1 Geographic segmentation

Chart on Market share by geography 2024-2029 (%)
Data Table on Market share by geography 2024-2029 (%)

12.2 Geographic comparison

Chart on Geographic comparison
Data Table on Geographic comparison

12.3 North America - Market size and forecast 2024-2029

Chart on North America - Market size and forecast 2024-2029 ($ million)
Data Table on North America - Market size and forecast 2024-2029 ($ million)
Chart on North America - Year-over-year growth 2024-2029 (%)
Data Table on North America - Year-over-year growth 2024-2029 (%)
Chart on Regional Comparison - North America
Data Table on Regional Comparison - North America

12.3.1 US - Market size and forecast 2024-2029

Chart on US - Market size and forecast 2024-2029 ($ million)
Data Table on US - Market size and forecast 2024-2029 ($ million)
Chart on US - Year-over-year growth 2024-2029 (%)
Data Table on US - Year-over-year growth 2024-2029 (%)

12.3.2 Canada - Market size and forecast 2024-2029

Chart on Canada - Market size and forecast 2024-2029 ($ million)
Data Table on Canada - Market size and forecast 2024-2029 ($ million)
Chart on Canada - Year-over-year growth 2024-2029 (%)
Data Table on Canada - Year-over-year growth 2024-2029 (%)

12.3.3 Mexico - Market size and forecast 2024-2029

Chart on Mexico - Market size and forecast 2024-2029 ($ million)
Data Table on Mexico - Market size and forecast 2024-2029 ($ million)
Chart on Mexico - Year-over-year growth 2024-2029 (%)
Data Table on Mexico - Year-over-year growth 2024-2029 (%)

12.4 Asia - Market size and forecast 2024-2029

Chart on Asia - Market size and forecast 2024-2029 ($ million)
Data Table on Asia - Market size and forecast 2024-2029 ($ million)
Chart on Asia - Year-over-year growth 2024-2029 (%)
Data Table on Asia - Year-over-year growth 2024-2029 (%)
Chart on Regional Comparison - Asia
Data Table on Regional Comparison - Asia

12.4.1 China - Market size and forecast 2024-2029

Chart on China - Market size and forecast 2024-2029 ($ million)
Data Table on China - Market size and forecast 2024-2029 ($ million)
Chart on China - Year-over-year growth 2024-2029 (%)
Data Table on China - Year-over-year growth 2024-2029 (%)

12.4.2 India - Market size and forecast 2024-2029

Chart on India - Market size and forecast 2024-2029 ($ million)
Data Table on India - Market size and forecast 2024-2029 ($ million)
Chart on India - Year-over-year growth 2024-2029 (%)
Data Table on India - Year-over-year growth 2024-2029 (%)

12.4.3 Japan - Market size and forecast 2024-2029

Chart on Japan - Market size and forecast 2024-2029 ($ million)
Data Table on Japan - Market size and forecast 2024-2029 ($ million)
Chart on Japan - Year-over-year growth 2024-2029 (%)
Data Table on Japan - Year-over-year growth 2024-2029 (%)

12.4.4 South Korea - Market size and forecast 2024-2029

Chart on South Korea - Market size and forecast 2024-2029 ($ million)
Data Table on South Korea - Market size and forecast 2024-2029 ($ million)
Chart on South Korea - Year-over-year growth 2024-2029 (%)
Data Table on South Korea - Year-over-year growth 2024-2029 (%)

12.4.5 Indonesia - Market size and forecast 2024-2029

Chart on Indonesia - Market size and forecast 2024-2029 ($ million)
Data Table on Indonesia - Market size and forecast 2024-2029 ($ million)
Chart on Indonesia - Year-over-year growth 2024-2029 (%)
Data Table on Indonesia - Year-over-year growth 2024-2029 (%)

12.4.6 Thailand - Market size and forecast 2024-2029

Chart on Thailand - Market size and forecast 2024-2029 ($ million)
Data Table on Thailand - Market size and forecast 2024-2029 ($ million)
Chart on Thailand - Year-over-year growth 2024-2029 (%)
Data Table on Thailand - Year-over-year growth 2024-2029 (%)

12.4.7 Singapore - Market size and forecast 2024-2029

Chart on Singapore - Market size and forecast 2024-2029 ($ million)
Data Table on Singapore - Market size and forecast 2024-2029 ($ million)
Chart on Singapore - Year-over-year growth 2024-2029 (%)
Data Table on Singapore - Year-over-year growth 2024-2029 (%)

12.5 Europe - Market size and forecast 2024-2029

Chart on Europe - Market size and forecast 2024-2029 ($ million)
Data Table on Europe - Market size and forecast 2024-2029 ($ million)
Chart on Europe - Year-over-year growth 2024-2029 (%)
Data Table on Europe - Year-over-year growth 2024-2029 (%)
Chart on Regional Comparison - Europe
Data Table on Regional Comparison - Europe

12.5.1 Germany - Market size and forecast 2024-2029

Chart on Germany - Market size and forecast 2024-2029 ($ million)
Data Table on Germany - Market size and forecast 2024-2029 ($ million)
Chart on Germany - Year-over-year growth 2024-2029 (%)
Data Table on Germany - Year-over-year growth 2024-2029 (%)

12.5.2 UK - Market size and forecast 2024-2029

Chart on UK - Market size and forecast 2024-2029 ($ million)
Data Table on UK - Market size and forecast 2024-2029 ($ million)
Chart on UK - Year-over-year growth 2024-2029 (%)
Data Table on UK - Year-over-year growth 2024-2029 (%)

12.5.3 France - Market size and forecast 2024-2029

Chart on France - Market size and forecast 2024-2029 ($ million)
Data Table on France - Market size and forecast 2024-2029 ($ million)
Chart on France - Year-over-year growth 2024-2029 (%)
Data Table on France - Year-over-year growth 2024-2029 (%)

12.5.4 Italy - Market size and forecast 2024-2029

Chart on Italy - Market size and forecast 2024-2029 ($ million)
Data Table on Italy - Market size and forecast 2024-2029 ($ million)
Chart on Italy - Year-over-year growth 2024-2029 (%)
Data Table on Italy - Year-over-year growth 2024-2029 (%)

12.5.5 The Netherlands - Market size and forecast 2024-2029

Chart on The Netherlands - Market size and forecast 2024-2029 ($ million)
Data Table on The Netherlands - Market size and forecast 2024-2029 ($ million)
Chart on The Netherlands - Year-over-year growth 2024-2029 (%)
Data Table on The Netherlands - Year-over-year growth 2024-2029 (%)

12.5.6 Spain - Market size and forecast 2024-2029

Chart on Spain - Market size and forecast 2024-2029 ($ million)
Data Table on Spain - Market size and forecast 2024-2029 ($ million)
Chart on Spain - Year-over-year growth 2024-2029 (%)
Data Table on Spain - Year-over-year growth 2024-2029 (%)

12.5.7 Russia - Market size and forecast 2024-2029

Chart on Russia - Market size and forecast 2024-2029 ($ million)
Data Table on Russia - Market size and forecast 2024-2029 ($ million)
Chart on Russia - Year-over-year growth 2024-2029 (%)
Data Table on Russia - Year-over-year growth 2024-2029 (%)

12.6 Rest of World (ROW) - Market size and forecast 2024-2029

Chart on Rest of World (ROW) - Market size and forecast 2024-2029 ($ million)
Data Table on Rest of World (ROW) - Market size and forecast 2024-2029 ($ million)
Chart on Rest of World (ROW) - Year-over-year growth 2024-2029 (%)
Data Table on Rest of World (ROW) - Year-over-year growth 2024-2029 (%)
Chart on Regional Comparison - Rest of World (ROW)
Data Table on Regional Comparison - Rest of World (ROW)

12.6.1 Australia - Market size and forecast 2024-2029

Chart on Australia - Market size and forecast 2024-2029 ($ million)
Data Table on Australia - Market size and forecast 2024-2029 ($ million)
Chart on Australia - Year-over-year growth 2024-2029 (%)
Data Table on Australia - Year-over-year growth 2024-2029 (%)

12.6.2 Brazil - Market size and forecast 2024-2029

Chart on Brazil - Market size and forecast 2024-2029 ($ million)
Data Table on Brazil - Market size and forecast 2024-2029 ($ million)
Chart on Brazil - Year-over-year growth 2024-2029 (%)
Data Table on Brazil - Year-over-year growth 2024-2029 (%)

12.6.3 UAE - Market size and forecast 2024-2029

Chart on UAE - Market size and forecast 2024-2029 ($ million)
Data Table on UAE - Market size and forecast 2024-2029 ($ million)
Chart on UAE - Year-over-year growth 2024-2029 (%)
Data Table on UAE - Year-over-year growth 2024-2029 (%)

12.6.4 South Africa - Market size and forecast 2024-2029

Chart on South Africa - Market size and forecast 2024-2029 ($ million)
Data Table on South Africa - Market size and forecast 2024-2029 ($ million)
Chart on South Africa - Year-over-year growth 2024-2029 (%)
Data Table on South Africa - Year-over-year growth 2024-2029 (%)

12.6.5 Saudi Arabia - Market size and forecast 2024-2029

Chart on Saudi Arabia - Market size and forecast 2024-2029 ($ million)
Data Table on Saudi Arabia - Market size and forecast 2024-2029 ($ million)
Chart on Saudi Arabia - Year-over-year growth 2024-2029 (%)
Data Table on Saudi Arabia - Year-over-year growth 2024-2029 (%)

12.6.6 Turkey - Market size and forecast 2024-2029

Chart on Turkey - Market size and forecast 2024-2029 ($ million)
Data Table on Turkey - Market size and forecast 2024-2029 ($ million)
Chart on Turkey - Year-over-year growth 2024-2029 (%)
Data Table on Turkey - Year-over-year growth 2024-2029 (%)

12.7 Market opportunity by geography

Market opportunity by geography ($ million)
Data Tables on Market opportunity by geography ($ million)

13. Drivers, Challenges, and Opportunity

13.1 Market drivers

Escalating incidence of chronic diseases
Expanding geriatric population
Technological advancements in diagnostic and laboratory automation

13.2 Market challenges

Stringent regulatory frameworks and compliance burdens
Complex reimbursement policies and increasing pricing pressures
Navigating shift towards point-of-care testing and associated data privacy concerns

13.3 Impact of drivers and challenges

Impact of drivers and challenges in 2024 and 2029

13.4 Market opportunities

Ascendancy of point-of-care metabolic panel testing
Integration of artificial intelligence in metabolic panel analysis
Expansion of at-home and direct-to-consumer metabolic panel testing

14. Competitive Landscape

14.1 Overview

14.2

Overview on criticality of inputs and factors of differentiation

14.3 Landscape disruption

Overview on factors of disruption

14.4 Industry risks

Impact of key risks on business

15. Competitive Analysis

15.1 Companies profiled

Companies covered

15.2 Company ranking index

15.3 Market positioning of companies

Matrix on companies position and classification

15.4 Abbott Laboratories

Abbott Laboratories - Overview
Abbott Laboratories - Business segments
Abbott Laboratories - Key news
Abbott Laboratories - Key offerings
Abbott Laboratories - Segment focus
SWOT

15.5 ARUP Laboratories

ARUP Laboratories - Overview
ARUP Laboratories - Product / Service
ARUP Laboratories - Key offerings
SWOT

15.6 Beckman Coulter Inc.

Beckman Coulter Inc. - Overview
Beckman Coulter Inc. - Product / Service
Beckman Coulter Inc. - Key offerings
SWOT

15.7 Bio Rad Laboratories Inc.

Bio Rad Laboratories Inc. - Overview
Bio Rad Laboratories Inc. - Business segments
Bio Rad Laboratories Inc. - Key news
Bio Rad Laboratories Inc. - Key offerings
Bio Rad Laboratories Inc. - Segment focus
SWOT

15.8 CENTOGENE NV

CENTOGENE NV - Overview
CENTOGENE NV - Product / Service
CENTOGENE NV - Key offerings
SWOT

15.9 F. Hoffmann La Roche Ltd.

F. Hoffmann La Roche Ltd. - Overview
F. Hoffmann La Roche Ltd. - Business segments
F. Hoffmann La Roche Ltd. - Key news
F. Hoffmann La Roche Ltd. - Key offerings
F. Hoffmann La Roche Ltd. - Segment focus
SWOT

15.10 Laboratory Corp.

Laboratory Corp. - Overview
Laboratory Corp. - Business segments
Laboratory Corp. - Key news
Laboratory Corp. - Key offerings
Laboratory Corp. - Segment focus
SWOT

15.11 Mayo Medical Laboratories

Mayo Medical Laboratories - Overview
Mayo Medical Laboratories - Product / Service
Mayo Medical Laboratories - Key offerings
SWOT

15.12 Quest Diagnostics Inc.

Quest Diagnostics Inc. - Overview
Quest Diagnostics Inc. - Business segments
Quest Diagnostics Inc. - Key offerings
Quest Diagnostics Inc. - Segment focus
SWOT

15.13 QuidelOrtho Corp.

QuidelOrtho Corp. - Overview
QuidelOrtho Corp. - Business segments
QuidelOrtho Corp. - Key offerings
QuidelOrtho Corp. - Segment focus
SWOT

15.14 Randox Laboratories Ltd.

Randox Laboratories Ltd. - Overview
Randox Laboratories Ltd. - Product / Service
Randox Laboratories Ltd. - Key news
Randox Laboratories Ltd. - Key offerings
SWOT

15.15 Siemens Healthineers AG

Siemens Healthineers AG - Overview
Siemens Healthineers AG - Business segments
Siemens Healthineers AG - Key news
Siemens Healthineers AG - Key offerings
Siemens Healthineers AG - Segment focus
SWOT

15.16 Sonic Healthcare Ltd.

Sonic Healthcare Ltd. - Overview
Sonic Healthcare Ltd. - Business segments
Sonic Healthcare Ltd. - Key offerings
Sonic Healthcare Ltd. - Segment focus
SWOT

15.17 SYNLAB International GmbH

SYNLAB International GmbH - Overview
SYNLAB International GmbH - Product / Service
SYNLAB International GmbH - Key offerings
SWOT

15.18 Thermo Fisher Scientific Inc.

Thermo Fisher Scientific Inc. - Overview
Thermo Fisher Scientific Inc. - Business segments
Thermo Fisher Scientific Inc. - Key news
Thermo Fisher Scientific Inc. - Key offerings
Thermo Fisher Scientific Inc. - Segment focus
SWOT

16. Appendix

16.1 Scope of the report

Market definition
Objectives
Notes and caveats

16.2 Inclusions and exclusions checklist

Inclusions checklist
Exclusions checklist

16.3 Currency conversion rates for US$

16.4 Research methodology

16.5 Data procurement

Information sources

16.6 Data validation

16.7 Validation techniques employed for market sizing

16.8 Data synthesis

16.9 360 degree market analysis

16.10 List of abbreviations

Research Methodology

Technavio presents a detailed picture of the market by way of study, synthesis, and summation of data from multiple sources. The analysts have presented the various facets of the market with a particular focus on identifying the key industry influencers. The data thus presented is comprehensive, reliable, and the result of extensive research, both primary and secondary.

INFORMATION SOURCES

Primary sources

  • Manufacturers and suppliers
  • Channel partners
  • Industry experts
  • Strategic decision makers

Secondary sources

  • Industry journals and periodicals
  • Government data
  • Financial reports of key industry players
  • Historical data
  • Press releases

DATA ANALYSIS

Data Synthesis

  • Collation of data
  • Estimation of key figures
  • Analysis of derived insights

Data Validation

  • Triangulation with data models
  • Reference against proprietary databases
  • Corroboration with industry experts

REPORT WRITING

Qualitative

  • Market drivers
  • Market challenges
  • Market trends
  • Five forces analysis

Quantitative

  • Market size and forecast
  • Market segmentation
  • Geographical insights
  • Competitive landscape

Interested in this report?

Get your sample now to see our research methodology and insights!

Download Now

Frequently Asked Questions

Comprehensive Metabolic Panel Testing market growth will increase by USD 5839.0 million during 2025-2029 .

The Comprehensive Metabolic Panel Testing market is expected to grow at a CAGR of 8.6% during 2025-2029 .

Comprehensive Metabolic Panel Testing market is segmented by Application (Kidney diseases, Diabetes, Liver diseases, Others) Test (Kidney function tests, Glucose, Liver function tests, Electrolytes, Others) End-user (Laboratories, Hospital, Point-of-care testing, Emergency departments, Others)

Abbott Laboratories, ARUP Laboratories, Beckman Coulter Inc., Bio Rad Laboratories Inc., CENTOGENE NV, DiaSorin Spa, F. Hoffmann La Roche Ltd., Laboratory Corp., Mayo Medical Laboratories, Metropolis Healthcare Ltd., Quest Diagnostics Inc., QuidelOrtho Corp., Randox Laboratories Ltd., Siemens Healthineers AG, Sonic Healthcare Ltd., SYNLAB International GmbH, Thermo Fisher Scientific Inc., Unipath Specialty Laboratory Ltd. are a few of the key vendors in the Comprehensive Metabolic Panel Testing market.

North America will register the highest growth rate of 40% among the other regions. Therefore, the Comprehensive Metabolic Panel Testing market in North America is expected to garner significant business opportunities for the vendors during the forecast period.

US, Canada, Mexico, China, India, Japan, South Korea, Indonesia, Thailand, Singapore, Germany, UK, France, Italy, The Netherlands, Spain, Russia, Australia, Brazil, UAE, South Africa, Saudi Arabia, Turkey

  • Escalating incidence of chronic diseases is the driving factor this market.

The Comprehensive Metabolic Panel Testing market vendors should focus on grabbing business opportunities from the Application segment as it accounted for the largest market share in the base year.