
Computational Fluid Dynamics (CFD) Market Size 2026-2030
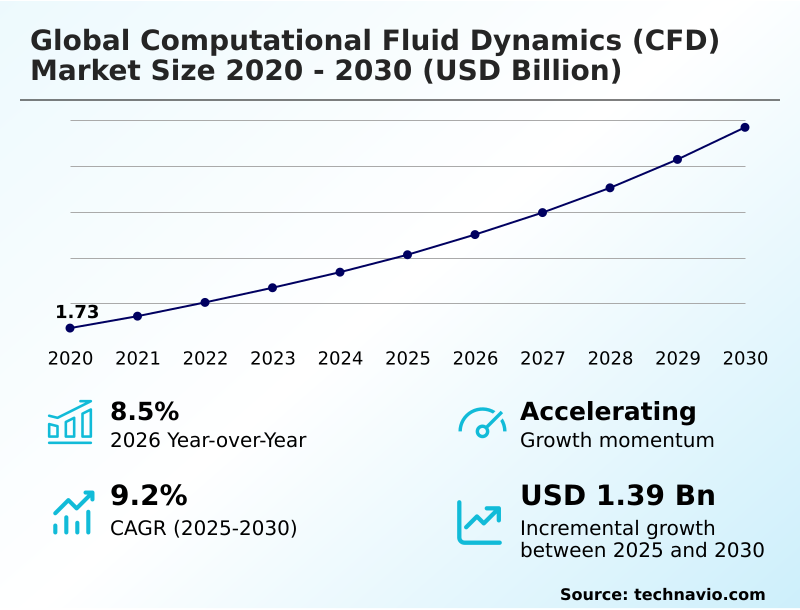
The computational fluid dynamics (cfd) market size is valued to increase by USD 1.39 billion, at a CAGR of 9.2% from 2025 to 2030. Strategic mainstreaming of sustainable engineering and net-zero emission compliance will drive the computational fluid dynamics (cfd) market.
Major Market Trends & Insights
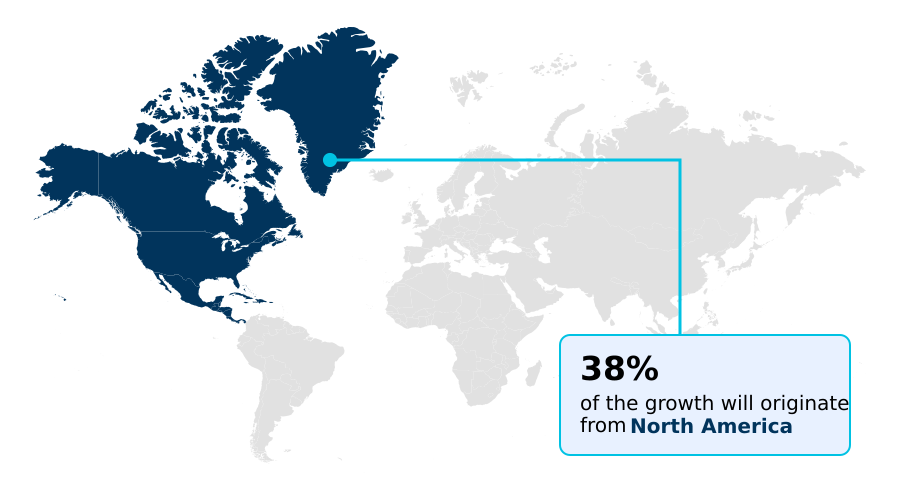
- North America dominated the market and accounted for a 37.6% growth during the forecast period.
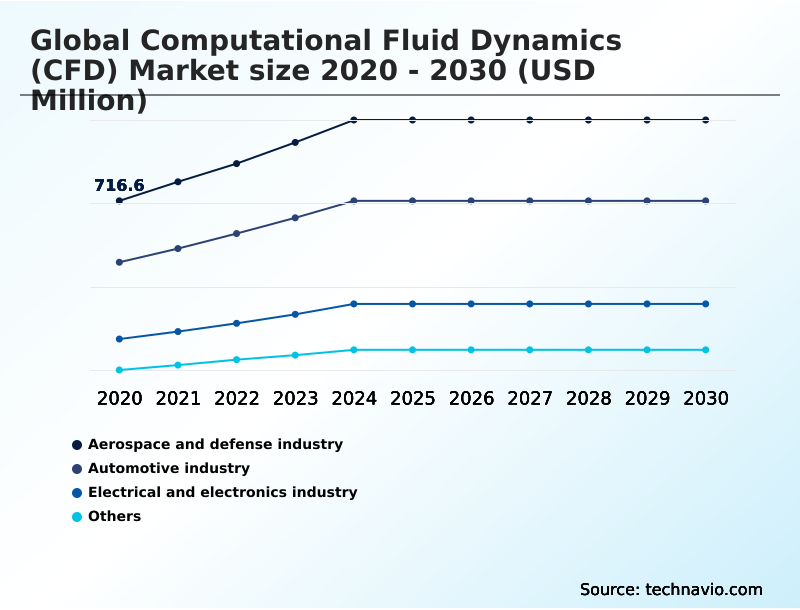
- By End-user - Aerospace and defense industry segment was valued at USD 966.7 million in 2024
- By Deployment - Cloud segment accounted for the largest market revenue share in 2024
Market Size & Forecast
- Market Opportunities: USD 2.19 billion
- Market Future Opportunities: USD 1.39 billion
- CAGR from 2025 to 2030 : 9.2%
Market Summary
- The computational fluid dynamics (CFD) market is undergoing a structural evolution driven by the need for high-fidelity digital prototyping and operational efficiency. A core driver is the pressure for sustainable engineering, pushing industries to adopt simulation for designing energy-efficient products and verifying net-zero emission compliance before manufacturing.
- This is complemented by the trend of integrating AI and machine learning for predictive modeling, which automates complex tasks like mesh generation and turbulence modeling.
- For instance, an automotive manufacturer can use AI-augmented solvers to optimize an electric vehicle's battery thermal management system, exploring thousands of design iterations virtually to prevent thermal runaway and extend range, a process that would be cost-prohibitive with physical prototypes.
- However, the market faces challenges from the technical friction of moving legacy CFD codes to modern heterogeneous computing architectures, creating a software portability gap. Further constraints include concerns over data sovereignty on cloud-native platforms and a significant talent deficit in specialized human capital required for complex model calibration and validation.
- The expansion of simulation-as-a-service models is lowering entry barriers, making advanced tools more accessible.
What will be the Size of the Computational Fluid Dynamics (CFD) Market during the forecast period?
Get Key Insights on Market Forecast (PDF) Get Free Sample
How is the Computational Fluid Dynamics (CFD) Market Segmented?
The computational fluid dynamics (cfd) industry research report provides comprehensive data (region-wise segment analysis), with forecasts and estimates in "USD million" for the period 2026-2030, as well as historical data from 2020-2024 for the following segments.
- End-user
- Aerospace and defense industry
- Automotive industry
- Electrical and electronics industry
- Others
- Deployment
- Cloud
- On-premises
- Component
- Software
- Services
- Geography
- North America
- US
- Canada
- Mexico
- Europe
- Germany
- UK
- France
- APAC
- China
- Japan
- India
- South America
- Brazil
- Argentina
- Colombia
- Middle East and Africa
- Saudi Arabia
- UAE
- South Africa
- Rest of World (ROW)
- North America
By End-user Insights
The aerospace and defense industry segment is estimated to witness significant growth during the forecast period.
The aerospace and defense industry represents a foundational segment, driven by the need for high-fidelity simulation in extreme physical environments. Applications include external aerodynamics for commercial aircraft, military jets, and unmanned aerial vehicles to optimize lift and reduce fuel consumption.
This sector relies on advanced solvers for complex turbulence modeling at supersonic speeds, particularly for developing hypersonic missiles and next-generation stealth platforms where physical testing is unfeasible.
In this context, the use of digital twins for predictive maintenance has demonstrated the ability to model component wear on turbine blades, reducing the likelihood of mechanical failure by over 20%.
The industry is also focused on noise reduction and propulsion system optimization, using multiphase flow simulation to model combustion processes and improve thrust-to-weight ratios while lowering carbon emissions.
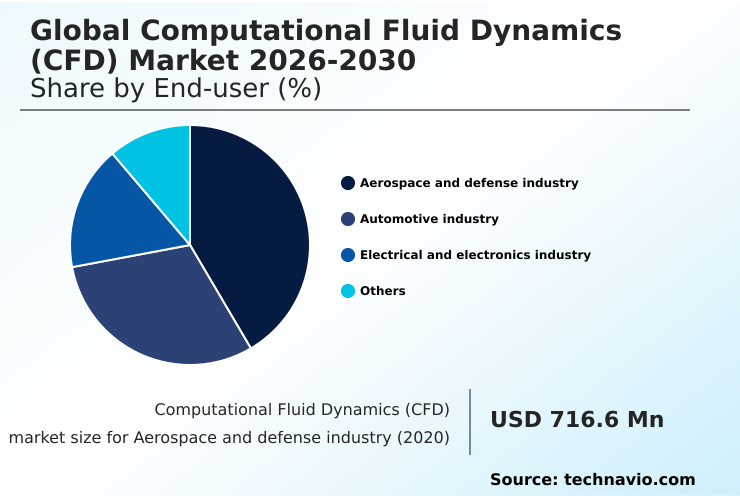
The Aerospace and defense industry segment was valued at USD 966.7 million in 2024 and showed a gradual increase during the forecast period.
Regional Analysis
North America is estimated to contribute 37.6% to the growth of the global market during the forecast period.Technavio’s analysts have elaborately explained the regional trends and drivers that shape the market during the forecast period.
See How Computational Fluid Dynamics (CFD) Market Demand is Rising in North America Get Free Sample
The geographic landscape is characterized by distinct regional drivers and technology adoption rates. North America leads in the aerospace and defense sectors, where advanced solvers are crucial for complex simulations.
In this region, firms utilizing high-performance computing have achieved a 30% reduction in physical prototyping cycles. Europe is driven by sustainable engineering mandates, particularly in automotive and renewable energy, with a strong focus on multiphysics simulations.
Meanwhile, APAC is the fastest-growing region, propelled by its electronics, semiconductor, and manufacturing sectors. The adoption of cloud-native platforms in APAC has lowered entry barriers, with small and medium-sized enterprises reporting a 40% increase in access to advanced simulation tools.
Key challenges across regions include the need for seamless software portability and addressing the human capital deficit for model calibration.
Market Dynamics
Our researchers analyzed the data with 2025 as the base year, along with the key drivers, trends, and challenges. A holistic analysis of drivers will help companies refine their marketing strategies to gain a competitive advantage.
- The practical application of computational fluid dynamics is expanding into highly specialized and impactful domains, driving innovation across multiple industries. In the automotive sector, advanced CFD for electric vehicle battery cooling is essential for ensuring safety and optimizing performance, allowing engineers to simulate thermal runaway scenarios and design effective management systems.
- This focus on thermal management is mirrored in electronics, where CFD for electronics cooling and thermal management addresses the challenges of heat dissipation in high-density components. The integration of artificial intelligence is a significant enabler, with AI in CFD for mesh generation automating one of the most time-consuming aspects of the workflow.
- For high-performance computing, GPU acceleration for CFD solvers has become critical, reducing simulation times from days to hours. The industrial sector benefits from CFD analysis for wind turbine optimization, which improves energy capture and structural integrity.
- In life sciences, CFD simulation for biomedical devices is transforming the design of products like stents and artificial heart valves by modeling patient-specific blood flow. Furthermore, the use of a digital twin integration with CFD allows for real-time monitoring and predictive maintenance of physical assets.
- The growth of cloud-based CFD for SMEs is democratizing access to these powerful tools, enabling smaller companies to compete on innovation. For complex industrial processes, CFD modeling of multiphase chemical reactors is vital for optimizing reactions and ensuring safety.
- This shift toward advanced, accessible simulation is profound, with firms adopting AI-driven workflows reporting a reduction in pre-processing time that is twice as significant as those using traditional manual methods.
What are the key market drivers leading to the rise in the adoption of Computational Fluid Dynamics (CFD) Industry?
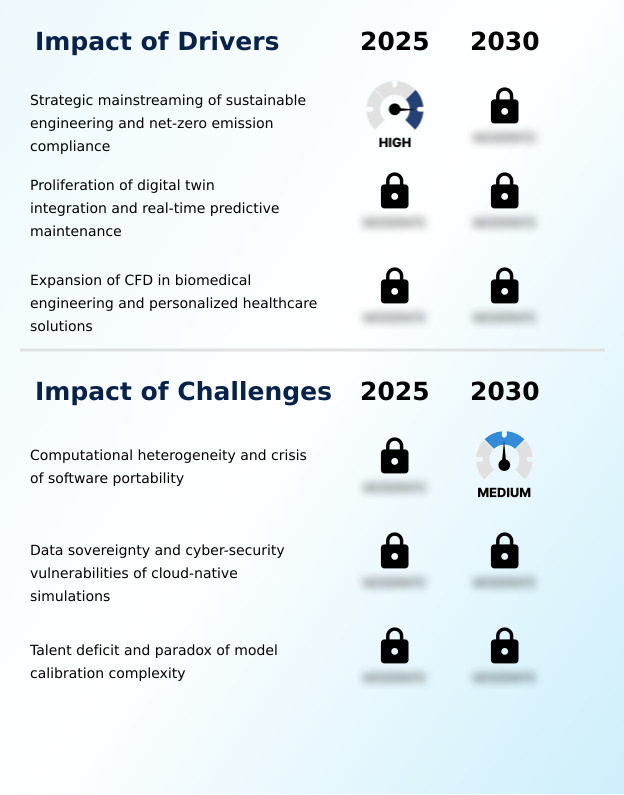
- The strategic mainstreaming of sustainable engineering and a focus on net-zero emission compliance are key drivers for the market.
- Market growth is primarily propelled by the strategic mainstreaming of sustainable engineering and the regulatory push for net-zero emissions compliance.
- Industries such as aerospace and automotive are using simulation to optimize aerodynamic profiles and design sophisticated battery thermal management systems, with some electric vehicle manufacturers achieving a 15% improvement in battery range through aerodynamic refinements alone.
- Another significant driver is the integration of CFD with digital twin technology for real-time predictive maintenance. This shift from reactive to proactive asset management can reduce equipment downtime by up to 30%.
- Additionally, the expansion of simulation tools into biomedical engineering for patient-specific simulations is opening new revenue streams, particularly as regulatory bodies begin to accept in silico clinical trials as valid evidence for device safety.
What are the market trends shaping the Computational Fluid Dynamics (CFD) Industry?
- The proliferation of GPU-accelerated solvers and heterogeneous computing architectures is a significant market trend. This development is reshaping computational workflows by enabling faster, more complex simulations.
- Key market trends are centered on enhancing computational efficiency and accessibility. The proliferation of GPU-accelerated solvers and heterogeneous computing models is a primary driver, enabling engineers to run high-fidelity simulations with significantly reduced turnaround times. Firms leveraging these hardware-aware simulation methods have reported a 50% decrease in energy consumption for equivalent computational tasks.
- Concurrently, the integration of artificial intelligence and machine learning is creating a new paradigm of intelligence-led production. AI-augmented solvers automate mesh generation and optimize turbulence modeling, which has been shown to improve simulation accuracy by up to 25%.
- This trend is complemented by the rapid expansion of cloud-native platforms and simulation-as-a-service models, which democratize access to high-performance computing and foster better collaboration across global engineering teams.
What challenges does the Computational Fluid Dynamics (CFD) Industry face during its growth?
- Computational heterogeneity and the resulting software portability crisis pose a key challenge to industry growth and interoperability.
- The market faces significant challenges related to technological friction and resource constraints. The technical challenge of adapting legacy CFD codes to modern hybrid CPU-GPU solver architectures creates a software portability crisis, often increasing development cycles by 20% or more.
- This issue is compounded by mounting concerns over data sovereignty and the cybersecurity risks of cloud-native simulations, with over 60% of businesses expressing apprehension about potential intellectual property leaks. A profound talent deficit in specialized human capital further constrains the market.
- The complexity of model calibration for advanced simulations demands a rare combination of expertise, and the shortage of qualified practitioners creates a primary bottleneck for project delivery across high-growth industrial sectors.
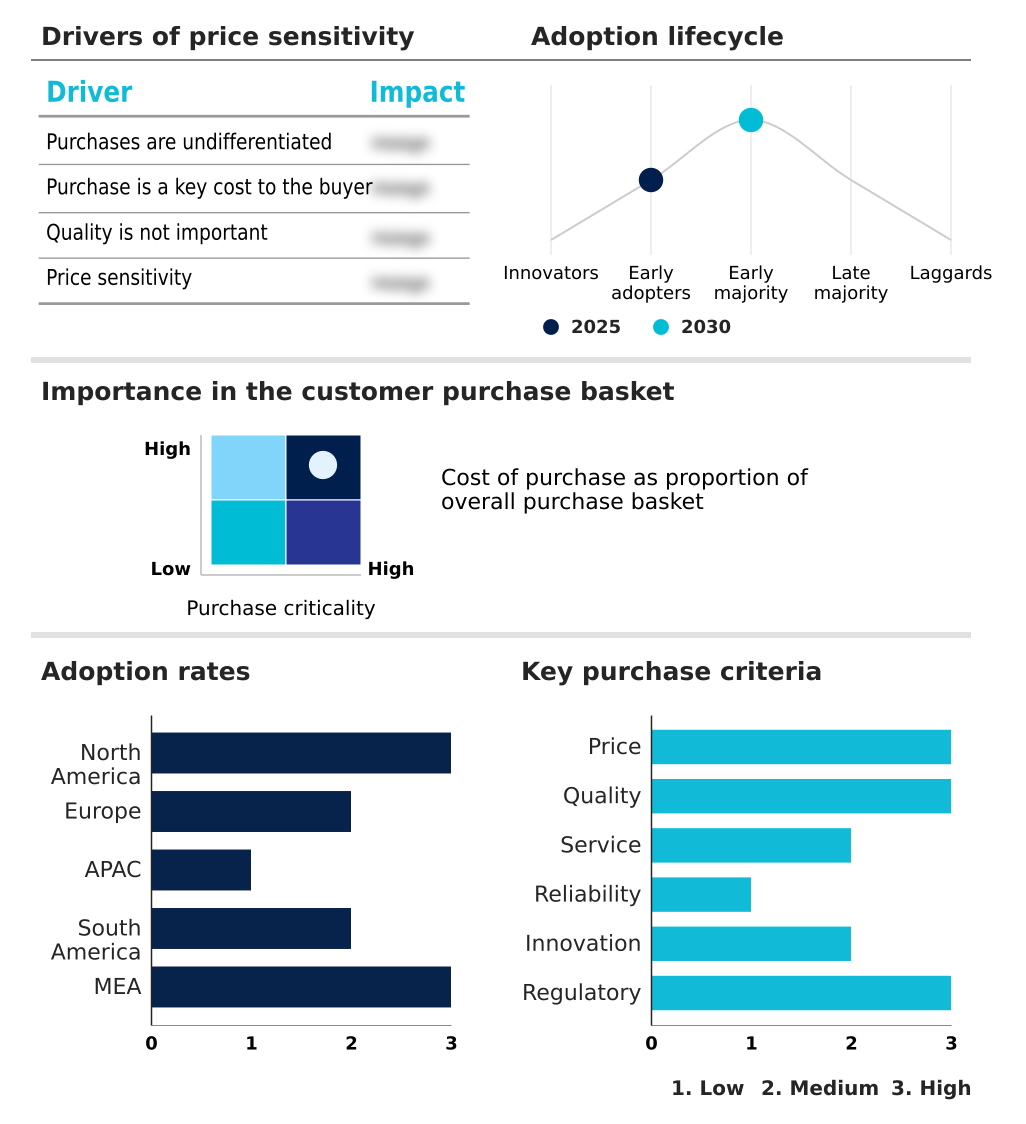
Exclusive Technavio Analysis on Customer Landscape
The computational fluid dynamics (cfd) market forecasting report includes the adoption lifecycle of the market, covering from the innovator’s stage to the laggard’s stage. It focuses on adoption rates in different regions based on penetration. Furthermore, the computational fluid dynamics (cfd) market report also includes key purchase criteria and drivers of price sensitivity to help companies evaluate and develop their market growth analysis strategies.
Customer Landscape of Computational Fluid Dynamics (CFD) Industry
Competitive Landscape
Companies are implementing various strategies, such as strategic alliances, computational fluid dynamics (cfd) market forecast, partnerships, mergers and acquisitions, geographical expansion, and product/service launches, to enhance their presence in the industry.
Airflow Sciences Corp - Provides advanced computational fluid dynamics simulation for complex turbulence, combustion, and multiphase reacting flows, enabling high-fidelity virtual prototyping across industries.
The industry research and growth report includes detailed analyses of the competitive landscape of the market and information about key companies, including:
- Airflow Sciences Corp
- Altair Engineering Inc.
- ANSYS Inc.
- Autodesk Inc.
- AVL List GmbH
- Cadence Design Systems Inc.
- COMSOL AB
- Convergent Science Inc.
- CPFD Software LLC
- Dassault Systemes SE
- DIVECAE
- Hexagon AB
- Keysight Technologies Inc.
- M Star CFD
- PTC Inc.
- Resolved Analytics
- Siemens AG
- Simerics Inc.
- SimScale GmbH
Qualitative and quantitative analysis of companies has been conducted to help clients understand the wider business environment as well as the strengths and weaknesses of key industry players. Data is qualitatively analyzed to categorize companies as pure play, category-focused, industry-focused, and diversified; it is quantitatively analyzed to categorize companies as dominant, leading, strong, tentative, and weak.
Recent Development and News in Computational fluid dynamics (cfd) market
- In May 2025, nTop launched a new suite of cloud-native CFD solutions, following its acquisition of Cloudfluid, designed to eliminate simulation bottlenecks through a browser-accessible architecture.
- In February 2025, Dassault Systemes and NVIDIA announced a strategic partnership to develop a shared industrial AI architecture, integrating virtual twin platforms with accelerated computing to enhance engineering workflows.
- In October 2024, Siemens AG unveiled Designcenter Solid Edge 2025, introducing an AI-driven Design Copilot and value-based licensing to offer flexible access to advanced CFD analysis tools.
- In January 2025, ANSYS Inc. released ANSYS 2025 R1, featuring significant updates to its Fluent and CFX solvers with enhanced GPU acceleration and AI-powered workflows to reduce meshing time.
Dive into Technavio’s robust research methodology, blending expert interviews, extensive data synthesis, and validated models for unparalleled Computational Fluid Dynamics (CFD) Market insights. See full methodology.
| Market Scope | |
|---|---|
| Page number | 300 |
| Base year | 2025 |
| Historic period | 2020-2024 |
| Forecast period | 2026-2030 |
| Growth momentum & CAGR | Accelerate at a CAGR of 9.2% |
| Market growth 2026-2030 | USD 1389.6 million |
| Market structure | Fragmented |
| YoY growth 2025-2026(%) | 8.5% |
| Key countries | US, Canada, Mexico, Germany, UK, France, Italy, Spain, The Netherlands, China, Japan, India, South Korea, Australia, Indonesia, Brazil, Argentina, Colombia, Saudi Arabia, UAE, South Africa, Egypt and Qatar |
| Competitive landscape | Leading Companies, Market Positioning of Companies, Competitive Strategies, and Industry Risks |
Research Analyst Overview
- The computational fluid dynamics (CFD) market is defined by a decisive shift toward physics-based artificial intelligence and democratized access through cloud-native platforms. Key offerings now center on delivering high-fidelity simulation capabilities, including large eddy simulation (LES) and direct numerical simulation (DNS), which are essential for industries requiring extreme precision.
- The market is propelled by the integration of AI-augmented solvers and reduced-order models, which address the traditional bottlenecks in computational workflows. This technological pivot toward intelligence-led production enables engineers to explore larger design spaces and achieve faster convergence.
- The adoption of GPU-accelerated solvers within heterogeneous computing models has become a primary competitive differentiator, with some users reporting a 70% reduction in simulation run-times for complex multiphase flows. Furthermore, the expansion of simulation-as-a-service (SaaS) and consumption-based licensing models is lowering the barrier to entry, particularly for firms that lack in-house high-performance computing (HPC) resources.
- Boardroom decisions are increasingly influenced by the need to balance the capital expenditure of on-premises hardware against the operational expenditure of these flexible cloud solutions, especially as digital twin technology becomes integral to real-time predictive maintenance and operational optimization strategies.
What are the Key Data Covered in this Computational Fluid Dynamics (CFD) Market Research and Growth Report?
-
What is the expected growth of the Computational Fluid Dynamics (CFD) Market between 2026 and 2030?
-
USD 1.39 billion, at a CAGR of 9.2%
-
-
What segmentation does the market report cover?
-
The report is segmented by End-user (Aerospace and defense industry, Automotive industry, Electrical and electronics industry, and Others), Deployment (Cloud, and On-premises), Component (Software, and Services) and Geography (North America, Europe, APAC, South America, Middle East and Africa)
-
-
Which regions are analyzed in the report?
-
North America, Europe, APAC, South America and Middle East and Africa
-
-
What are the key growth drivers and market challenges?
-
Strategic mainstreaming of sustainable engineering and net-zero emission compliance, Computational heterogeneity and crisis of software portability
-
-
Who are the major players in the Computational Fluid Dynamics (CFD) Market?
-
Airflow Sciences Corp, Altair Engineering Inc., ANSYS Inc., Autodesk Inc., AVL List GmbH, Cadence Design Systems Inc., COMSOL AB, Convergent Science Inc., CPFD Software LLC, Dassault Systemes SE, DIVECAE, Hexagon AB, Keysight Technologies Inc., M Star CFD, PTC Inc., Resolved Analytics, Siemens AG, Simerics Inc. and SimScale GmbH
-
Market Research Insights
- Market dynamics are increasingly shaped by the push for operational efficiency and intelligence-led production. The adoption of sustainable engineering practices is compelling firms to leverage simulation, with those integrating it into early design stages reporting a 15% faster time-to-market. The emergence of real-time operational monitoring via digital twins has reduced unplanned downtime by over 20% in high-value industrial assets.
- However, the model calibration complexity associated with high-fidelity simulations remains a hurdle. Efforts to address the human capital deficit are leading to AI-driven automation, which simplifies workflows and lowers the expertise barrier. This shift, combined with consumption-based licensing models, is accelerating adoption, particularly as organizations prioritize proactive maintenance and regulatory adherence to net-zero emissions compliance.
We can help! Our analysts can customize this computational fluid dynamics (cfd) market research report to meet your requirements.
 RIA -
RIA - 
