Computer Numerical Control Solutions Market Analysis, Size, and Forecast 2026-2030: APAC (China, Japan, and India), North America (US, Canada, and Mexico), Europe (Germany, UK, and France), South America (Brazil, Argentina, and Colombia), Middle East and Africa (Saudi Arabia, UAE, and South Africa), and Rest of World (ROW)

Computer Numerical Control Solutions Market Analysis, Size, and Forecast 2026-2030:
APAC (China, Japan, and India), North America (US, Canada, and Mexico), Europe (Germany, UK, and France), South America (Brazil, Argentina, and Colombia), Middle East and Africa (Saudi Arabia, UAE, and South Africa), and Rest of World (ROW)

Published: Jan 2026 303 Pages SKU: IRTNTR44824

Market Overview at a Glance

$13.16 B
Market Opportunity
8.4%
CAGR 2025 - 2030
45.7%
APAC Growth
$8.72 B
Servo drives segment 2024

Computer Numerical Control Solutions Market Size 2026-2030

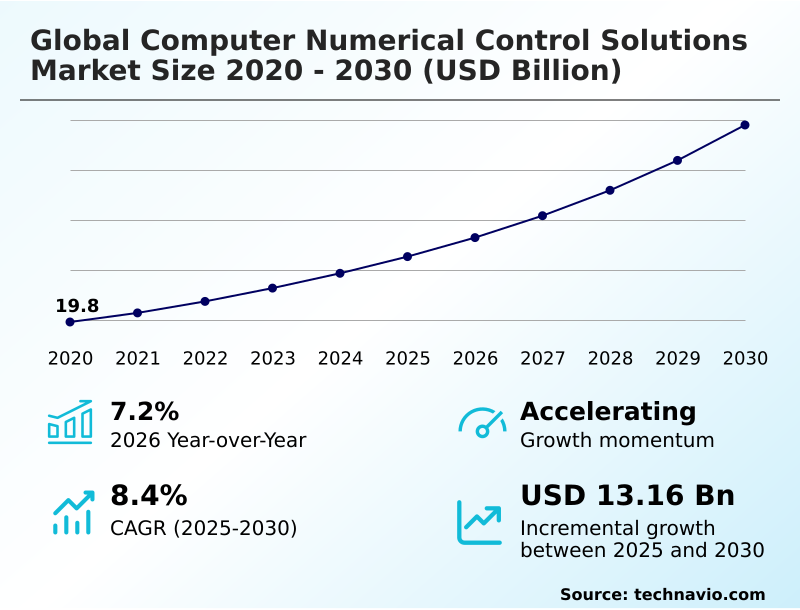
The computer numerical control solutions market size is valued to increase by USD 13.16 billion, at a CAGR of 8.4% from 2025 to 2030. Increasing demand for automation in manufacturing will drive the computer numerical control solutions market.

Major Market Trends & Insights

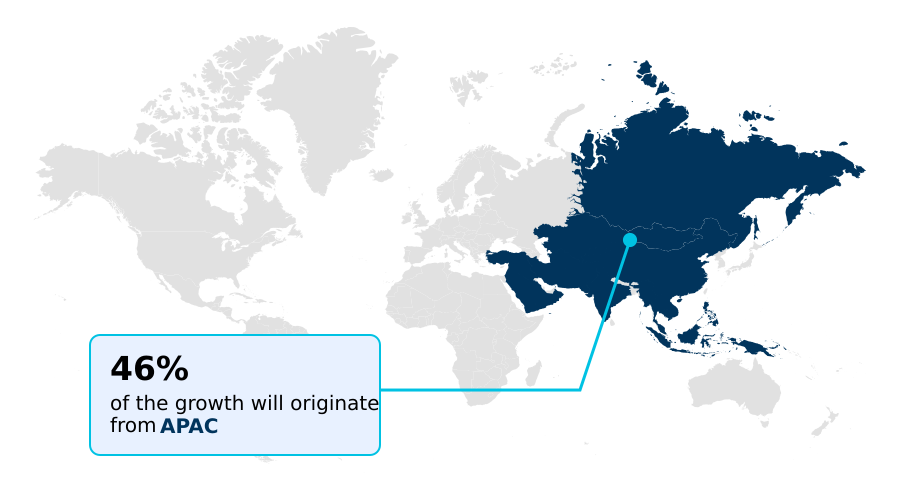
  • APAC dominated the market and accounted for a 45.7% growth during the forecast period.
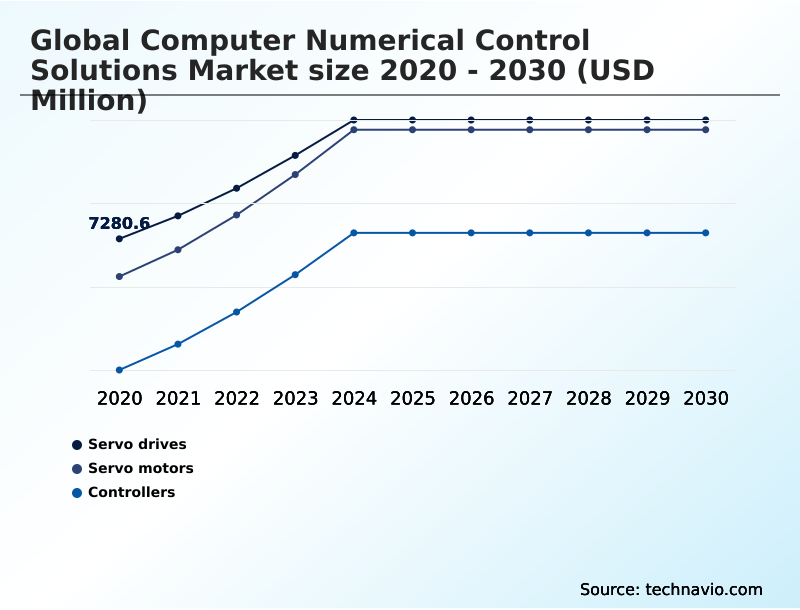
  • By Solution - Servo drives segment was valued at USD 8.72 billion in 2024
  • By End-user - Automotive segment accounted for the largest market revenue share in 2024

Market Size & Forecast

  • Market Opportunities: USD 19.70 billion
  • Market Future Opportunities: USD 13.16 billion
  • CAGR from 2025 to 2030 : 8.4%

Market Summary

  • The computer numerical control solutions market is undergoing a significant transformation, driven by the convergence of operational technology and digital innovation. The core demand stems from the need for increased precision and efficiency in manufacturing, particularly in sectors requiring high-precision components like automotive and aerospace.
  • A key driver is the push toward automation to mitigate rising labor costs and skill shortages, where robotic systems and automated workflows are becoming standard. This is supported by the adoption of Industry 4.0 principles, enabling real-time data monitoring and predictive maintenance, which significantly enhances productivity.
  • For instance, a manufacturer might leverage a closed-loop control system integrated with manufacturing execution systems (MES) to automatically adjust production schedules based on supply chain disruptions, reducing downtime and improving on-time delivery rates. However, the high initial investment in equipment such as a 5-axis cnc machine and the complexity of smart factory integration present considerable challenges, particularly for smaller enterprises.
  • The evolution of human-machine interface design and more intuitive cnc machine programming is helping to lower the barrier to entry, but the need for capital and skilled operators remains a central market dynamic.

What will be the Size of the Computer Numerical Control Solutions Market during the forecast period?

Get Key Insights on Market Forecast (PDF) Request Free Sample

How is the Computer Numerical Control Solutions Market Segmented?

The computer numerical control solutions industry research report provides comprehensive data (region-wise segment analysis), with forecasts and estimates in "USD million" for the period 2026-2030, as well as historical data from 2020-2024 for the following segments.

  • Solution
    • Servo drives
    • Servo motors
    • Controllers
  • End-user
    • Automotive
    • Aerospace and defense
    • Industrial machinery
    • Others
  • Type
    • Milling machine
    • Laser machine
    • Grinding machine
    • Others
  • Geography
    • APAC
      • China
      • Japan
      • India
    • North America
      • US
      • Canada
      • Mexico
    • Europe
      • Germany
      • UK
      • France
    • South America
      • Brazil
      • Argentina
      • Colombia
    • Middle East and Africa
      • Saudi Arabia
      • UAE
      • South Africa
    • Rest of World (ROW)

By Solution Insights

The servo drives segment is estimated to witness significant growth during the forecast period.

The servo drives segment is integral to the broader market, serving as the core of advanced motion control systems. These drives are essential for achieving the precision engineering applications required in modern manufacturing.

By utilizing a closed-loop control system, they ensure the accurate positioning of high-precision components, a critical factor in electric vehicle component production and mass customization manufacturing.

The integration of high-performance servo drives with advanced CNC controllers facilitates production line optimization and supports lean manufacturing principles.

This synergy enables manufacturers to achieve positional accuracy improvements of over 15%, directly enhancing product quality and operational efficiency across automated production lines.

Request Free Sample

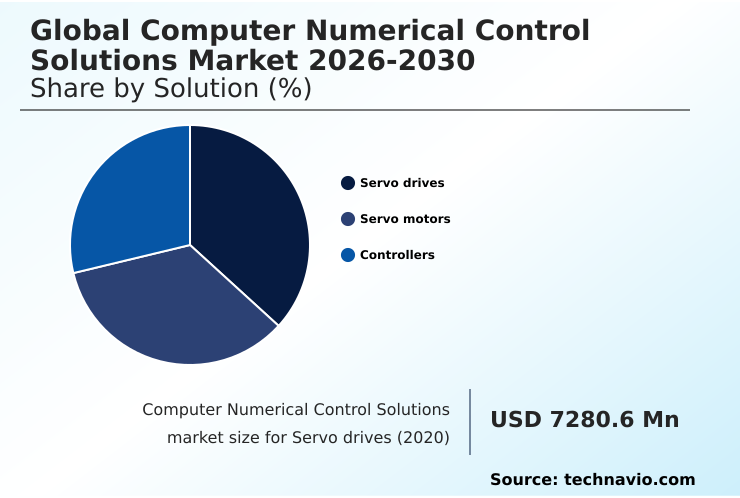
The Servo drives segment was valued at USD 8.72 billion in 2024 and showed a gradual increase during the forecast period.

Request Free Sample

Regional Analysis

APAC is estimated to contribute 45.7% to the growth of the global market during the forecast period.Technavio’s analysts have elaborately explained the regional trends and drivers that shape the market during the forecast period.

See How Computer Numerical Control Solutions Market Demand is Rising in APAC Request Free Sample

Geographically, the market landscape is led by APAC, which accounts for over 45% of the incremental growth, driven by its robust manufacturing sector.

Countries in this region are heavily investing in multi-axis machining and high-speed milling for applications like semiconductor fabrication and aerospace component machining. North America and Europe remain significant markets, focusing on high-value sectors such as orthopedic implant manufacturing.

The strategic deployment of advanced tooling systems and the establishment of the automated manufacturing cell are key priorities in these developed regions, as they seek to enhance production line optimization and maintain a competitive edge.

Market Dynamics

Our researchers analyzed the data with 2025 as the base year, along with the key drivers, trends, and challenges. A holistic analysis of drivers will help companies refine their marketing strategies to gain a competitive advantage.

  • The evolution of the computer numerical control solutions market is deeply intertwined with industrial modernization. The cnc technology for automotive industry is a prime example, where precision and speed are paramount. Concurrently, the impact of ai on cnc machining is revolutionizing operations through machine learning algorithms that optimize toolpaths and enable predictive maintenance for cnc machines.
  • For specialized sectors, the use of multi-axis cnc for aerospace parts is non-negotiable for producing complex geometries. This is complemented by the rise of hybrid additive-subtractive manufacturing, a technology that merges building and finishing processes. The role of cnc in industry 4.0 is further defined by iiot in smart factory production, though this presents challenges in cnc system integration.
  • The benefits of 5-axis cnc machining are clear, particularly in precision machining for medical devices, where accuracy saves lives. Effective cnc programming for complex geometries remains a core skill, essential for automating manufacturing with cnc robotics. Organizations must also consider the total cost of cnc machine ownership, which extends beyond the initial purchase.
  • Advanced cnc software for generative design is enabling lighter, stronger parts, improving efficiency with cnc automation. There are also specific cnc solutions for semiconductor manufacturing where microscopic precision is required, and servo motor control for cnc accuracy is critical.
  • Finally, data analytics for cnc performance and securing connected cnc manufacturing systems are key boardroom topics, especially for cnc applications in industrial machinery where operational uptime is directly tied to profitability. Firms implementing these integrated strategies report efficiency gains nearly twice that of those using siloed, older technologies.

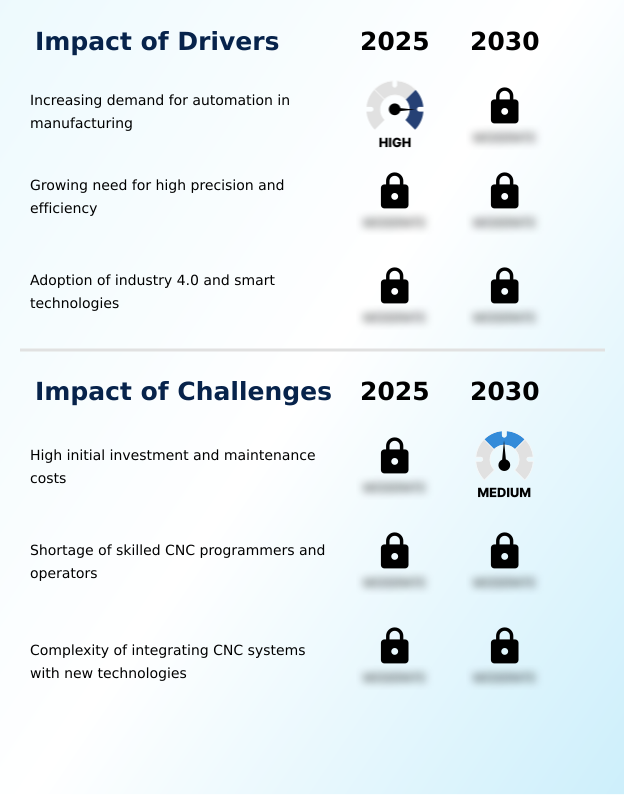
What are the key market drivers leading to the rise in the adoption of Computer Numerical Control Solutions Industry?

  • Increasing demand for automation within the manufacturing sector serves as a primary driver for market growth.

  • The push for greater operational efficiency is a significant driver, fueled by the adoption of IIoT connectivity and real-time data monitoring. These technologies enable sophisticated machining process optimization and support the high-volume needs of subtractive manufacturing.
  • Reshoring manufacturing trends are also compelling organizations to invest in factory automation solutions and shop floor automation to enhance supply chain resilience.
  • The implementation of an automated workflow, which connects machinery with enterprise systems, has been shown to improve operational equipment effectiveness (OEE) by up to 20%, demonstrating a clear return on investment.

What are the market trends shaping the Computer Numerical Control Solutions Industry?

  • The integration of artificial intelligence and machine learning is a significant emerging trend. This development is paving the way for advancements in process optimization and predictive capabilities.

  • A primary trend is the fusion of additive manufacturing and advanced machining, with the 5-axis CNC machine becoming central to this evolution. Innovations in generative design are enabling the creation of complex parts, which are then refined through high-precision machining. The adoption of predictive maintenance, facilitated by digital twin simulation, is reducing unplanned downtime by over 30%.
  • Enhanced computer-aided manufacturing (CAM) software and intuitive human-machine interface designs are simplifying operations, leading to significant machining cycle time reduction. This focus on smart factory integration is also extending cnc machine tool life, with some users reporting a 15% increase in operational lifespan.

What challenges does the Computer Numerical Control Solutions Industry face during its growth?

  • The high initial investment and ongoing maintenance costs present a key challenge affecting industry growth.

  • Integrating disparate systems remains a significant challenge. The complexity of linking robotic systems and programmable logic controllers with legacy enterprise resource planning (ERP) and manufacturing execution systems (MES) can impede data-driven process optimization. The sophisticated CNC machine programming required for technologies like laser metal deposition and other cyber-physical systems demands a highly skilled workforce, which is in short supply.
  • Furthermore, ensuring seamless industrial robotics integration with digital manufacturing software requires substantial upfront investment and expertise, with integration costs sometimes exceeding initial hardware spend by 25%.

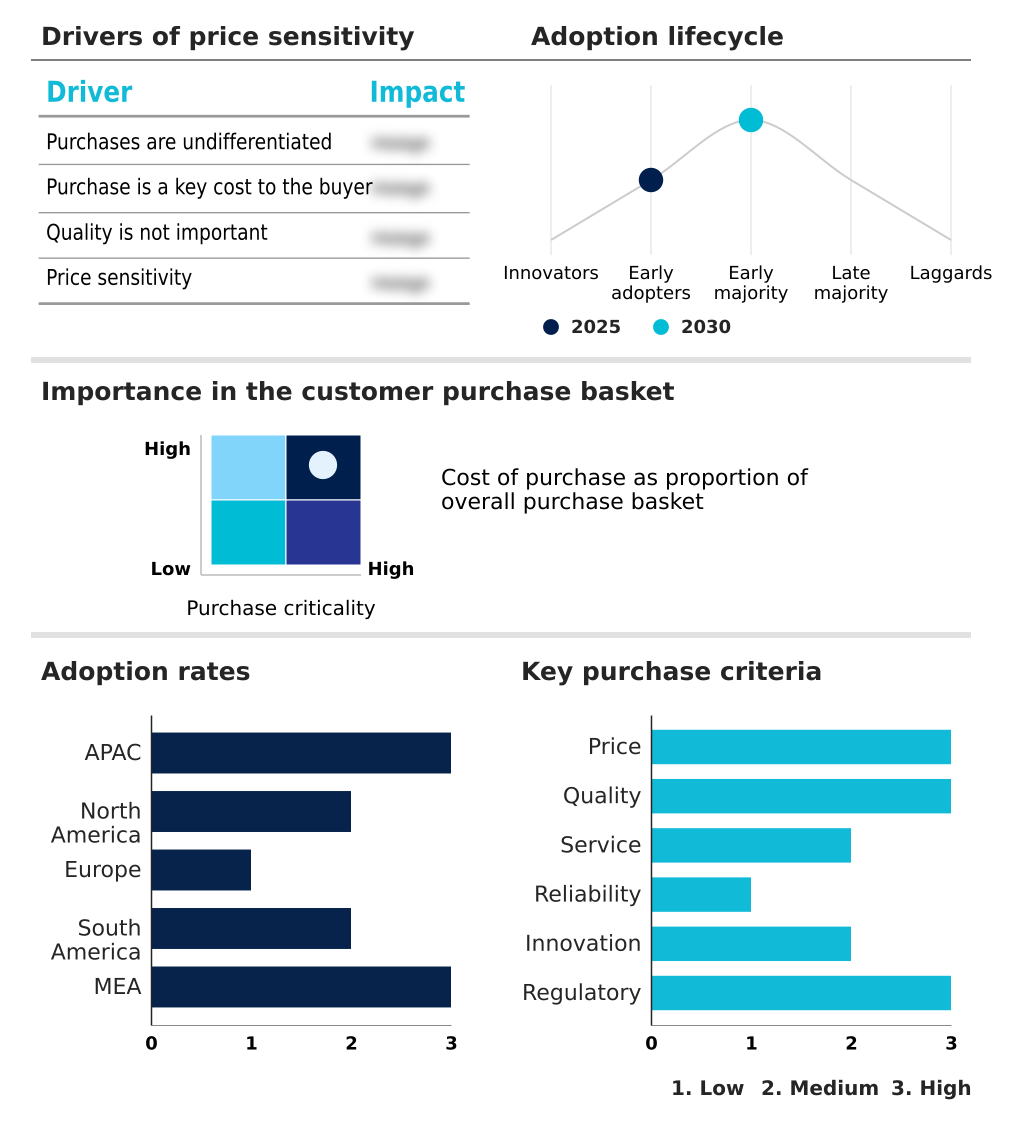
Exclusive Technavio Analysis on Customer Landscape

The computer numerical control solutions market forecasting report includes the adoption lifecycle of the market, covering from the innovator’s stage to the laggard’s stage. It focuses on adoption rates in different regions based on penetration. Furthermore, the computer numerical control solutions market report also includes key purchase criteria and drivers of price sensitivity to help companies evaluate and develop their market growth analysis strategies.

Customer Landscape of Computer Numerical Control Solutions Industry

Competitive Landscape

Companies are implementing various strategies, such as strategic alliances, computer numerical control solutions market forecast, partnerships, mergers and acquisitions, geographical expansion, and product/service launches, to enhance their presence in the industry.

Bosch Rexroth AG - Delivers integrated computer numerical control solutions, including advanced motion control systems and factory automation platforms for complex engineering and machinery applications.

The industry research and growth report includes detailed analyses of the competitive landscape of the market and information about key companies, including:

  • Bosch Rexroth AG
  • Delta Electronics Inc.
  • DMG MORI Co. Ltd.
  • FANUC Corp.
  • Haas Automation Inc.
  • HEIDENHAIN
  • Hurco Companies Inc.
  • JTEKT Corp.
  • KEBA Group AG
  • Makino Inc.
  • Minitech Machinery Corp.
  • Mitsubishi Electric Corp.
  • Okuma Corp.
  • Rockwell Automation Inc.
  • Sandvik AB
  • SIEB and MEYER AG
  • TRUMPF SE Co. KG
  • Yamazaki Mazak Corp.
  • Yaskawa Electric Corp.

Qualitative and quantitative analysis of companies has been conducted to help clients understand the wider business environment as well as the strengths and weaknesses of key industry players. Data is qualitatively analyzed to categorize companies as pure play, category-focused, industry-focused, and diversified; it is quantitatively analyzed to categorize companies as dominant, leading, strong, tentative, and weak.

Recent Development and News in Computer numerical control solutions market

  • In August 2024, FANUC introduced a new AI-powered feature in its controllers designed to reduce cycle times by learning from previous machining operations.
  • In September 2024, TRUMPF showcased a new hybrid machine combining laser metal deposition with high-speed milling, providing a comprehensive solution for producing complex metal parts.
  • In January 2025, DMG MORI unveiled a new 5-axis machining center specifically for the aerospace sector, addressing the growing demand for advanced machining capabilities.
  • In March 2025, Tesla Inc. announced plans for a new, highly automated manufacturing plant that will depend heavily on CNC technology for electric vehicle component production.

Dive into Technavio’s robust research methodology, blending expert interviews, extensive data synthesis, and validated models for unparalleled Computer Numerical Control Solutions Market insights. See full methodology.

Market Scope
Page number 303
Base year 2025
Historic period 2020-2024
Forecast period 2026-2030
Growth momentum & CAGR Accelerate at a CAGR of 8.4%
Market growth 2026-2030 USD 13161.7 million
Market structure Fragmented
YoY growth 2025-2026(%) 7.2%
Key countries China, Japan, India, South Korea, Australia, Indonesia, US, Canada, Mexico, Germany, UK, France, Italy, Spain, The Netherlands, Brazil, Argentina, Colombia, Saudi Arabia, UAE, South Africa, Israel and Turkey
Competitive landscape Leading Companies, Market Positioning of Companies, Competitive Strategies, and Industry Risks

Request Free Sample

Research Analyst Overview

  • The market's trajectory is defined by the integration of core components like servo drives, servo motors, and advanced cnc controllers into cohesive, intelligent systems. The shift towards multi-axis machining and the 5-axis cnc machine allows for unprecedented complexity in high-precision components.
  • This is driven by innovations in both subtractive manufacturing and additive manufacturing, with technologies like laser metal deposition and high-speed milling becoming standard. Machining process optimization is now a primary focus, enabled by iiot connectivity for real-time data monitoring and predictive maintenance. This creates a fully automated workflow powered by robotic systems.
  • The human-machine interface is becoming more intuitive, simplifying interactions with complex motion control systems. Advanced digital manufacturing software supports generative design and leverages data-driven process optimization. This entire ecosystem, from programmable logic controllers to tooling systems, operates on a closed-loop control system, where firms have achieved a 30% reduction in processing time.

What are the Key Data Covered in this Computer Numerical Control Solutions Market Research and Growth Report?

  • What is the expected growth of the Computer Numerical Control Solutions Market between 2026 and 2030?

    • USD 13.16 billion, at a CAGR of 8.4%

  • What segmentation does the market report cover?

    • The report is segmented by Solution (Servo drives, Servo motors, and Controllers), End-user (Automotive, Aerospace and defense, Industrial machinery, and Others), Type (Milling machine, Laser machine, Grinding machine, and Others) and Geography (APAC, North America, Europe, South America, Middle East and Africa)

  • Which regions are analyzed in the report?

    • APAC, North America, Europe, South America and Middle East and Africa

  • What are the key growth drivers and market challenges?

    • Increasing demand for automation in manufacturing, High initial investment and maintenance costs

  • Who are the major players in the Computer Numerical Control Solutions Market?

    • Bosch Rexroth AG, Delta Electronics Inc., DMG MORI Co. Ltd., FANUC Corp., Haas Automation Inc., HEIDENHAIN, Hurco Companies Inc., JTEKT Corp., KEBA Group AG, Makino Inc., Minitech Machinery Corp., Mitsubishi Electric Corp., Okuma Corp., Rockwell Automation Inc., Sandvik AB, SIEB and MEYER AG, TRUMPF SE Co. KG, Yamazaki Mazak Corp. and Yaskawa Electric Corp.

Market Research Insights

  • Market dynamics are increasingly shaped by strategic initiatives such as reshoring manufacturing trends and the adoption of lean manufacturing principles to enhance supply chain resilience. The focus on production line optimization and shop floor automation is paramount, with companies achieving up to a 15% improvement in operational equipment effectiveness (OEE) through smart factory integration.
  • In specialized sectors like electric vehicle component production and semiconductor fabrication, the demand for advanced factory automation solutions is intense. Investment in digital twin simulation has been shown to achieve machining cycle time reduction by 20%, validating the ROI of modernizing computer-aided manufacturing (CAM) processes. This shift underscores a broader move toward data-centric operations across the industrial landscape.

We can help! Our analysts can customize this computer numerical control solutions market research report to meet your requirements.

Get in touch

1. Executive Summary

1.1 Market overview

Executive Summary - Chart on Market Overview
Executive Summary - Data Table on Market Overview
Executive Summary - Chart on Global Market Characteristics
Executive Summary - Chart on Market by Geography
Executive Summary - Chart on Market Segmentation by Solution
Executive Summary - Chart on Market Segmentation by End-user
Executive Summary - Chart on Market Segmentation by Type
Executive Summary - Chart on Incremental Growth
Executive Summary - Data Table on Incremental Growth
Executive Summary - Chart on Company Market Positioning

2. Technavio Analysis

2.1 Analysis of price sensitivity, lifecycle, customer purchase basket, adoption rates, and purchase criteria

2.2 Criticality of inputs and Factors of differentiation

Chart on Overview on criticality of inputs and factors of differentiation

2.3 Factors of disruption

Chart on Overview on factors of disruption

2.4 Impact of drivers and challenges

Chart on Impact of drivers and challenges in 2025 and 2030

3. Market Landscape

3.1 Market ecosystem

Chart on Parent Market
Data Table on - Parent Market

3.2 Market characteristics

Chart on Market characteristics analysis

3.3 Value chain analysis

Chart on Value chain analysis

4. Market Sizing

4.1 Market definition

Data Table on Offerings of companies included in the market definition

4.2 Market segment analysis

Market segments

4.3 Market size 2025

4.4 Market outlook: Forecast for 2025-2030

Chart on Global - Market size and forecast 2025-2030 ($ million)
Data Table on Global - Market size and forecast 2025-2030 ($ million)
Chart on Global Market: Year-over-year growth 2025-2030 (%)
Data Table on Global Market: Year-over-year growth 2025-2030 (%)

5. Historic Market Size

5.1 Global Computer Numerical Control Solutions Market 2020 - 2024

Historic Market Size - Data Table on Global Computer Numerical Control Solutions Market 2020 - 2024 ($ million)

5.2 Solution segment analysis 2020 - 2024

Historic Market Size - Solution Segment 2020 - 2024 ($ million)

5.3 End-user segment analysis 2020 - 2024

Historic Market Size - End-user Segment 2020 - 2024 ($ million)

5.4 Type segment analysis 2020 - 2024

Historic Market Size - Type Segment 2020 - 2024 ($ million)

5.5 Geography segment analysis 2020 - 2024

Historic Market Size - Geography Segment 2020 - 2024 ($ million)

5.6 Country segment analysis 2020 - 2024

Historic Market Size - Country Segment 2020 - 2024 ($ million)

6. Qualitative Analysis

6.1 Impact of AI on global computer numerical control solutions market

7. Five Forces Analysis

7.1 Five forces summary

Five forces analysis - Comparison between 2025 and 2030

7.2 Bargaining power of buyers

Bargaining power of buyers - Impact of key factors 2025 and 2030

7.3 Bargaining power of suppliers

Bargaining power of suppliers - Impact of key factors in 2025 and 2030

7.4 Threat of new entrants

Threat of new entrants - Impact of key factors in 2025 and 2030

7.5 Threat of substitutes

Threat of substitutes - Impact of key factors in 2025 and 2030

7.6 Threat of rivalry

Threat of rivalry - Impact of key factors in 2025 and 2030

7.7 Market condition

Chart on Market condition - Five forces 2025 and 2030

8. Market Segmentation by Solution

8.1 Market segments

Chart on Solution - Market share 2025-2030 (%)
Data Table on Solution - Market share 2025-2030 (%)

8.2 Comparison by Solution

Chart on Comparison by Solution
Data Table on Comparison by Solution

8.3 Servo drives - Market size and forecast 2025-2030

Chart on Servo drives - Market size and forecast 2025-2030 ($ million)
Data Table on Servo drives - Market size and forecast 2025-2030 ($ million)
Chart on Servo drives - Year-over-year growth 2025-2030 (%)
Data Table on Servo drives - Year-over-year growth 2025-2030 (%)

8.4 Servo motors - Market size and forecast 2025-2030

Chart on Servo motors - Market size and forecast 2025-2030 ($ million)
Data Table on Servo motors - Market size and forecast 2025-2030 ($ million)
Chart on Servo motors - Year-over-year growth 2025-2030 (%)
Data Table on Servo motors - Year-over-year growth 2025-2030 (%)

8.5 Controllers - Market size and forecast 2025-2030

Chart on Controllers - Market size and forecast 2025-2030 ($ million)
Data Table on Controllers - Market size and forecast 2025-2030 ($ million)
Chart on Controllers - Year-over-year growth 2025-2030 (%)
Data Table on Controllers - Year-over-year growth 2025-2030 (%)

8.6 Market opportunity by Solution

Market opportunity by Solution ($ million)
Data Table on Market opportunity by Solution ($ million)

9. Market Segmentation by End-user

9.1 Market segments

Chart on End-user - Market share 2025-2030 (%)
Data Table on End-user - Market share 2025-2030 (%)

9.2 Comparison by End-user

Chart on Comparison by End-user
Data Table on Comparison by End-user

9.3 Automotive - Market size and forecast 2025-2030

Chart on Automotive - Market size and forecast 2025-2030 ($ million)
Data Table on Automotive - Market size and forecast 2025-2030 ($ million)
Chart on Automotive - Year-over-year growth 2025-2030 (%)
Data Table on Automotive - Year-over-year growth 2025-2030 (%)

9.4 Aerospace and defense - Market size and forecast 2025-2030

Chart on Aerospace and defense - Market size and forecast 2025-2030 ($ million)
Data Table on Aerospace and defense - Market size and forecast 2025-2030 ($ million)
Chart on Aerospace and defense - Year-over-year growth 2025-2030 (%)
Data Table on Aerospace and defense - Year-over-year growth 2025-2030 (%)

9.5 Industrial machinery - Market size and forecast 2025-2030

Chart on Industrial machinery - Market size and forecast 2025-2030 ($ million)
Data Table on Industrial machinery - Market size and forecast 2025-2030 ($ million)
Chart on Industrial machinery - Year-over-year growth 2025-2030 (%)
Data Table on Industrial machinery - Year-over-year growth 2025-2030 (%)

9.6 Others - Market size and forecast 2025-2030

Chart on Others - Market size and forecast 2025-2030 ($ million)
Data Table on Others - Market size and forecast 2025-2030 ($ million)
Chart on Others - Year-over-year growth 2025-2030 (%)
Data Table on Others - Year-over-year growth 2025-2030 (%)

9.7 Market opportunity by End-user

Market opportunity by End-user ($ million)
Data Table on Market opportunity by End-user ($ million)

10. Market Segmentation by Type

10.1 Market segments

Chart on Type - Market share 2025-2030 (%)
Data Table on Type - Market share 2025-2030 (%)

10.2 Comparison by Type

Chart on Comparison by Type
Data Table on Comparison by Type

10.3 Milling machine - Market size and forecast 2025-2030

Chart on Milling machine - Market size and forecast 2025-2030 ($ million)
Data Table on Milling machine - Market size and forecast 2025-2030 ($ million)
Chart on Milling machine - Year-over-year growth 2025-2030 (%)
Data Table on Milling machine - Year-over-year growth 2025-2030 (%)

10.4 Laser machine - Market size and forecast 2025-2030

Chart on Laser machine - Market size and forecast 2025-2030 ($ million)
Data Table on Laser machine - Market size and forecast 2025-2030 ($ million)
Chart on Laser machine - Year-over-year growth 2025-2030 (%)
Data Table on Laser machine - Year-over-year growth 2025-2030 (%)

10.5 Grinding machine - Market size and forecast 2025-2030

Chart on Grinding machine - Market size and forecast 2025-2030 ($ million)
Data Table on Grinding machine - Market size and forecast 2025-2030 ($ million)
Chart on Grinding machine - Year-over-year growth 2025-2030 (%)
Data Table on Grinding machine - Year-over-year growth 2025-2030 (%)

10.6 Others - Market size and forecast 2025-2030

Chart on Others - Market size and forecast 2025-2030 ($ million)
Data Table on Others - Market size and forecast 2025-2030 ($ million)
Chart on Others - Year-over-year growth 2025-2030 (%)
Data Table on Others - Year-over-year growth 2025-2030 (%)

10.7 Market opportunity by Type

Market opportunity by Type ($ million)
Data Table on Market opportunity by Type ($ million)

11. Customer Landscape

11.1 Customer landscape overview

Analysis of price sensitivity, lifecycle, customer purchase basket, adoption rates, and purchase criteria

12. Geographic Landscape

12.1 Geographic segmentation

Chart on Market share by geography 2025-2030 (%)
Data Table on Market share by geography 2025-2030 (%)

12.2 Geographic comparison

Chart on Geographic comparison
Data Table on Geographic comparison

12.3 APAC - Market size and forecast 2025-2030

Chart on APAC - Market size and forecast 2025-2030 ($ million)
Data Table on APAC - Market size and forecast 2025-2030 ($ million)
Chart on APAC - Year-over-year growth 2025-2030 (%)
Data Table on APAC - Year-over-year growth 2025-2030 (%)
Chart on Regional Comparison - APAC
Data Table on Regional Comparison - APAC

12.3.1 China - Market size and forecast 2025-2030

Chart on China - Market size and forecast 2025-2030 ($ million)
Data Table on China - Market size and forecast 2025-2030 ($ million)
Chart on China - Year-over-year growth 2025-2030 (%)
Data Table on China - Year-over-year growth 2025-2030 (%)

12.3.2 Japan - Market size and forecast 2025-2030

Chart on Japan - Market size and forecast 2025-2030 ($ million)
Data Table on Japan - Market size and forecast 2025-2030 ($ million)
Chart on Japan - Year-over-year growth 2025-2030 (%)
Data Table on Japan - Year-over-year growth 2025-2030 (%)

12.3.3 India - Market size and forecast 2025-2030

Chart on India - Market size and forecast 2025-2030 ($ million)
Data Table on India - Market size and forecast 2025-2030 ($ million)
Chart on India - Year-over-year growth 2025-2030 (%)
Data Table on India - Year-over-year growth 2025-2030 (%)

12.3.4 South Korea - Market size and forecast 2025-2030

Chart on South Korea - Market size and forecast 2025-2030 ($ million)
Data Table on South Korea - Market size and forecast 2025-2030 ($ million)
Chart on South Korea - Year-over-year growth 2025-2030 (%)
Data Table on South Korea - Year-over-year growth 2025-2030 (%)

12.3.5 Australia - Market size and forecast 2025-2030

Chart on Australia - Market size and forecast 2025-2030 ($ million)
Data Table on Australia - Market size and forecast 2025-2030 ($ million)
Chart on Australia - Year-over-year growth 2025-2030 (%)
Data Table on Australia - Year-over-year growth 2025-2030 (%)

12.3.6 Indonesia - Market size and forecast 2025-2030

Chart on Indonesia - Market size and forecast 2025-2030 ($ million)
Data Table on Indonesia - Market size and forecast 2025-2030 ($ million)
Chart on Indonesia - Year-over-year growth 2025-2030 (%)
Data Table on Indonesia - Year-over-year growth 2025-2030 (%)

12.4 North America - Market size and forecast 2025-2030

Chart on North America - Market size and forecast 2025-2030 ($ million)
Data Table on North America - Market size and forecast 2025-2030 ($ million)
Chart on North America - Year-over-year growth 2025-2030 (%)
Data Table on North America - Year-over-year growth 2025-2030 (%)
Chart on Regional Comparison - North America
Data Table on Regional Comparison - North America

12.4.1 US - Market size and forecast 2025-2030

Chart on US - Market size and forecast 2025-2030 ($ million)
Data Table on US - Market size and forecast 2025-2030 ($ million)
Chart on US - Year-over-year growth 2025-2030 (%)
Data Table on US - Year-over-year growth 2025-2030 (%)

12.4.2 Canada - Market size and forecast 2025-2030

Chart on Canada - Market size and forecast 2025-2030 ($ million)
Data Table on Canada - Market size and forecast 2025-2030 ($ million)
Chart on Canada - Year-over-year growth 2025-2030 (%)
Data Table on Canada - Year-over-year growth 2025-2030 (%)

12.4.3 Mexico - Market size and forecast 2025-2030

Chart on Mexico - Market size and forecast 2025-2030 ($ million)
Data Table on Mexico - Market size and forecast 2025-2030 ($ million)
Chart on Mexico - Year-over-year growth 2025-2030 (%)
Data Table on Mexico - Year-over-year growth 2025-2030 (%)

12.5 Europe - Market size and forecast 2025-2030

Chart on Europe - Market size and forecast 2025-2030 ($ million)
Data Table on Europe - Market size and forecast 2025-2030 ($ million)
Chart on Europe - Year-over-year growth 2025-2030 (%)
Data Table on Europe - Year-over-year growth 2025-2030 (%)
Chart on Regional Comparison - Europe
Data Table on Regional Comparison - Europe

12.5.1 Germany - Market size and forecast 2025-2030

Chart on Germany - Market size and forecast 2025-2030 ($ million)
Data Table on Germany - Market size and forecast 2025-2030 ($ million)
Chart on Germany - Year-over-year growth 2025-2030 (%)
Data Table on Germany - Year-over-year growth 2025-2030 (%)

12.5.2 UK - Market size and forecast 2025-2030

Chart on UK - Market size and forecast 2025-2030 ($ million)
Data Table on UK - Market size and forecast 2025-2030 ($ million)
Chart on UK - Year-over-year growth 2025-2030 (%)
Data Table on UK - Year-over-year growth 2025-2030 (%)

12.5.3 France - Market size and forecast 2025-2030

Chart on France - Market size and forecast 2025-2030 ($ million)
Data Table on France - Market size and forecast 2025-2030 ($ million)
Chart on France - Year-over-year growth 2025-2030 (%)
Data Table on France - Year-over-year growth 2025-2030 (%)

12.5.4 Italy - Market size and forecast 2025-2030

Chart on Italy - Market size and forecast 2025-2030 ($ million)
Data Table on Italy - Market size and forecast 2025-2030 ($ million)
Chart on Italy - Year-over-year growth 2025-2030 (%)
Data Table on Italy - Year-over-year growth 2025-2030 (%)

12.5.5 Spain - Market size and forecast 2025-2030

Chart on Spain - Market size and forecast 2025-2030 ($ million)
Data Table on Spain - Market size and forecast 2025-2030 ($ million)
Chart on Spain - Year-over-year growth 2025-2030 (%)
Data Table on Spain - Year-over-year growth 2025-2030 (%)

12.5.6 The Netherlands - Market size and forecast 2025-2030

Chart on The Netherlands - Market size and forecast 2025-2030 ($ million)
Data Table on The Netherlands - Market size and forecast 2025-2030 ($ million)
Chart on The Netherlands - Year-over-year growth 2025-2030 (%)
Data Table on The Netherlands - Year-over-year growth 2025-2030 (%)

12.6 South America - Market size and forecast 2025-2030

Chart on South America - Market size and forecast 2025-2030 ($ million)
Data Table on South America - Market size and forecast 2025-2030 ($ million)
Chart on South America - Year-over-year growth 2025-2030 (%)
Data Table on South America - Year-over-year growth 2025-2030 (%)
Chart on Regional Comparison - South America
Data Table on Regional Comparison - South America

12.6.1 Brazil - Market size and forecast 2025-2030

Chart on Brazil - Market size and forecast 2025-2030 ($ million)
Data Table on Brazil - Market size and forecast 2025-2030 ($ million)
Chart on Brazil - Year-over-year growth 2025-2030 (%)
Data Table on Brazil - Year-over-year growth 2025-2030 (%)

12.6.2 Argentina - Market size and forecast 2025-2030

Chart on Argentina - Market size and forecast 2025-2030 ($ million)
Data Table on Argentina - Market size and forecast 2025-2030 ($ million)
Chart on Argentina - Year-over-year growth 2025-2030 (%)
Data Table on Argentina - Year-over-year growth 2025-2030 (%)

12.6.3 Colombia - Market size and forecast 2025-2030

Chart on Colombia - Market size and forecast 2025-2030 ($ million)
Data Table on Colombia - Market size and forecast 2025-2030 ($ million)
Chart on Colombia - Year-over-year growth 2025-2030 (%)
Data Table on Colombia - Year-over-year growth 2025-2030 (%)

12.7 Middle East and Africa - Market size and forecast 2025-2030

Chart on Middle East and Africa - Market size and forecast 2025-2030 ($ million)
Data Table on Middle East and Africa - Market size and forecast 2025-2030 ($ million)
Chart on Middle East and Africa - Year-over-year growth 2025-2030 (%)
Data Table on Middle East and Africa - Year-over-year growth 2025-2030 (%)
Chart on Regional Comparison - Middle East and Africa
Data Table on Regional Comparison - Middle East and Africa

12.7.1 Saudi Arabia - Market size and forecast 2025-2030

Chart on Saudi Arabia - Market size and forecast 2025-2030 ($ million)
Data Table on Saudi Arabia - Market size and forecast 2025-2030 ($ million)
Chart on Saudi Arabia - Year-over-year growth 2025-2030 (%)
Data Table on Saudi Arabia - Year-over-year growth 2025-2030 (%)

12.7.2 UAE - Market size and forecast 2025-2030

Chart on UAE - Market size and forecast 2025-2030 ($ million)
Data Table on UAE - Market size and forecast 2025-2030 ($ million)
Chart on UAE - Year-over-year growth 2025-2030 (%)
Data Table on UAE - Year-over-year growth 2025-2030 (%)

12.7.3 South Africa - Market size and forecast 2025-2030

Chart on South Africa - Market size and forecast 2025-2030 ($ million)
Data Table on South Africa - Market size and forecast 2025-2030 ($ million)
Chart on South Africa - Year-over-year growth 2025-2030 (%)
Data Table on South Africa - Year-over-year growth 2025-2030 (%)

12.7.4 Israel - Market size and forecast 2025-2030

Chart on Israel - Market size and forecast 2025-2030 ($ million)
Data Table on Israel - Market size and forecast 2025-2030 ($ million)
Chart on Israel - Year-over-year growth 2025-2030 (%)
Data Table on Israel - Year-over-year growth 2025-2030 (%)

12.7.5 Turkey - Market size and forecast 2025-2030

Chart on Turkey - Market size and forecast 2025-2030 ($ million)
Data Table on Turkey - Market size and forecast 2025-2030 ($ million)
Chart on Turkey - Year-over-year growth 2025-2030 (%)
Data Table on Turkey - Year-over-year growth 2025-2030 (%)

12.8 Market opportunity by geography

Market opportunity by geography ($ million)
Data Tables on Market opportunity by geography ($ million)

13. Drivers, Challenges, and Opportunity

13.1 Market drivers

Increasing demand for automation in manufacturing
Growing need for high precision and efficiency
Adoption of industry 4.0 and smart technologies

13.2 Market challenges

High initial investment and maintenance costs
Shortage of skilled CNC programmers and operators
Complexity of integrating CNC systems with new technologies

13.3 Impact of drivers and challenges

Impact of drivers and challenges in 2025 and 2030

13.4 Market opportunities

Integration of artificial intelligence and machine learning
Adoption of IIoT and smart manufacturing
Increasing adoption of multi axis and hybrid CNC machines

14. Competitive Landscape

14.1 Overview

14.2

Overview on criticality of inputs and factors of differentiation

14.3 Landscape disruption

Overview on factors of disruption

14.4 Industry risks

Impact of key risks on business

15. Competitive Analysis

15.1 Companies profiled

Companies covered

15.2 Company ranking index

15.3 Market positioning of companies

Matrix on companies position and classification

15.4 Bosch Rexroth AG

Bosch Rexroth AG - Overview
Bosch Rexroth AG - Product / Service
Bosch Rexroth AG - Key offerings
SWOT

15.5 Delta Electronics Inc.

Delta Electronics Inc. - Overview
Delta Electronics Inc. - Business segments
Delta Electronics Inc. - Key news
Delta Electronics Inc. - Key offerings
Delta Electronics Inc. - Segment focus
SWOT

15.6 DMG MORI Co. Ltd.

DMG MORI Co. Ltd. - Overview
DMG MORI Co. Ltd. - Business segments
DMG MORI Co. Ltd. - Key offerings
DMG MORI Co. Ltd. - Segment focus
SWOT

15.7 FANUC Corp.

FANUC Corp. - Overview
FANUC Corp. - Business segments
FANUC Corp. - Key offerings
FANUC Corp. - Segment focus
SWOT

15.8 Haas Automation Inc.

Haas Automation Inc. - Overview
Haas Automation Inc. - Product / Service
Haas Automation Inc. - Key offerings
SWOT

15.9 HEIDENHAIN

HEIDENHAIN - Overview
HEIDENHAIN - Product / Service
HEIDENHAIN - Key offerings
SWOT

15.10 Hurco Companies Inc.

Hurco Companies Inc. - Overview
Hurco Companies Inc. - Product / Service
Hurco Companies Inc. - Key offerings
SWOT

15.11 KEBA Group AG

KEBA Group AG - Overview
KEBA Group AG - Product / Service
KEBA Group AG - Key offerings
SWOT

15.12 Makino Inc.

Makino Inc. - Overview
Makino Inc. - Business segments
Makino Inc. - Key offerings
Makino Inc. - Segment focus
SWOT

15.13 Minitech Machinery Corp.

Minitech Machinery Corp. - Overview
Minitech Machinery Corp. - Product / Service
Minitech Machinery Corp. - Key offerings
SWOT

15.14 Mitsubishi Electric Corp.

Mitsubishi Electric Corp. - Overview
Mitsubishi Electric Corp. - Business segments
Mitsubishi Electric Corp. - Key offerings
Mitsubishi Electric Corp. - Segment focus
SWOT

15.15 Okuma Corp.

Okuma Corp. - Overview
Okuma Corp. - Business segments
Okuma Corp. - Key offerings
Okuma Corp. - Segment focus
SWOT

15.16 Rockwell Automation Inc.

Rockwell Automation Inc. - Overview
Rockwell Automation Inc. - Business segments
Rockwell Automation Inc. - Key news
Rockwell Automation Inc. - Key offerings
Rockwell Automation Inc. - Segment focus
SWOT

15.17 Sandvik AB

Sandvik AB - Overview
Sandvik AB - Product / Service
Sandvik AB - Key offerings
SWOT

15.18 Yamazaki Mazak Corp.

Yamazaki Mazak Corp. - Overview
Yamazaki Mazak Corp. - Product / Service
Yamazaki Mazak Corp. - Key offerings
SWOT

16. Appendix

16.1 Scope of the report

Market definition
Objectives
Notes and caveats

16.2 Inclusions and exclusions checklist

Inclusions checklist
Exclusions checklist

16.3 Currency conversion rates for US$

16.4 Research methodology

16.5 Data procurement

Information sources

16.6 Data validation

16.7 Validation techniques employed for market sizing

16.8 Data synthesis

16.9 360 degree market analysis

16.10 List of abbreviations

Research Methodology

Technavio presents a detailed picture of the market by way of study, synthesis, and summation of data from multiple sources. The analysts have presented the various facets of the market with a particular focus on identifying the key industry influencers. The data thus presented is comprehensive, reliable, and the result of extensive research, both primary and secondary.

INFORMATION SOURCES

Primary sources

  • Manufacturers and suppliers
  • Channel partners
  • Industry experts
  • Strategic decision makers

Secondary sources

  • Industry journals and periodicals
  • Government data
  • Financial reports of key industry players
  • Historical data
  • Press releases

DATA ANALYSIS

Data Synthesis

  • Collation of data
  • Estimation of key figures
  • Analysis of derived insights

Data Validation

  • Triangulation with data models
  • Reference against proprietary databases
  • Corroboration with industry experts

REPORT WRITING

Qualitative

  • Market drivers
  • Market challenges
  • Market trends
  • Five forces analysis

Quantitative

  • Market size and forecast
  • Market segmentation
  • Geographical insights
  • Competitive landscape

Interested in this report?

Get your sample now to see our research methodology and insights!

Download Now

Frequently Asked Questions

Computer Numerical Control Solutions market growth will increase by USD 13161.7 million during 2026-2030.

The Computer Numerical Control Solutions market is expected to grow at a CAGR of 8.4% during 2026-2030.

Computer Numerical Control Solutions market is segmented by Solution (Servo drives, Servo motors, Controllers) End-user (Automotive, Aerospace and defense, Industrial machinery, Others) Type (Milling machine, Laser machine, Grinding machine, Others)

Bosch Rexroth AG, Delta Electronics Inc., DMG MORI Co. Ltd., FANUC Corp., Haas Automation Inc., HEIDENHAIN, Hurco Companies Inc., JTEKT Corp., KEBA Group AG, Makino Inc., Minitech Machinery Corp., Mitsubishi Electric Corp., Okuma Corp., Rockwell Automation Inc., Sandvik AB, SIEB and MEYER AG, TRUMPF SE Co. KG, Yamazaki Mazak Corp., Yaskawa Electric Corp. are a few of the key vendors in the Computer Numerical Control Solutions market.

APAC will register the highest growth rate of 45.7% among the other regions. Therefore, the Computer Numerical Control Solutions market in APAC is expected to garner significant business opportunities for the vendors during the forecast period.

China, Japan, India, South Korea, Australia, Indonesia, US, Canada, Mexico, Germany, UK, France, Italy, Spain, The Netherlands, Brazil, Argentina, Colombia, Saudi Arabia, UAE, South Africa, Israel, Turkey

  • Increasing demand for automation in manufacturing is the driving factor this market.

The Computer Numerical Control Solutions market vendors should focus on grabbing business opportunities from the Solution segment as it accounted for the largest market share in the base year.