
Computer Power Supply Market For PC Gaming Size 2024-2028
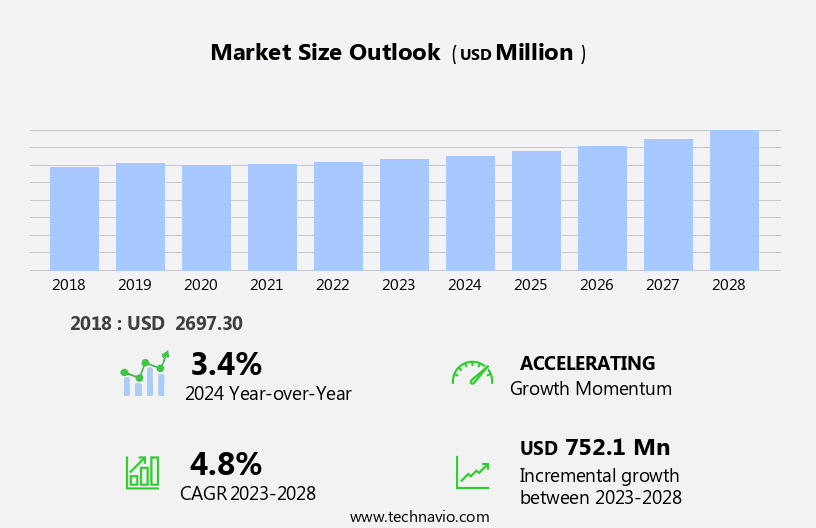
The computer power supply market for PC gaming size is forecast to increase by USD 752.1 million at a CAGR of 4.8% between 2023 and 2028.
- The market is experiencing significant growth, driven by several key factors. The increasing popularity of e-sports events is leading to a growth in demand for high-performance gaming systems, which require advanced power supplies to operate effectively. Enhanced cooling systems, such as liquid cooling and customizable RGB lighting, are becoming more common in specialized gaming PSUs. These features not only improve system performance but also add aesthetic appeal. Modular designs and safety certifications, such as UL, further enhance the appeal of high-wattage computer power supplies in the Computer Power Supply Market For PC Gaming. Moreover, companies are responding to this trend by introducing new products with enhanced features and capabilities. Regulatory compliance is also playing a crucial role in market growth, as manufacturers strive to meet energy efficiency and safety standards. These factors, among others, are shaping the future of the market.
What will be the Size of the Computer Power Supply Market For PC Gaming During the Forecast Period?
- The Computer Power Supply Market For PC Gaming continues to evolve, driven by the demand for high-performance gaming rigs. Power Supply Units (PSUs), a critical component of these systems, have become increasingly important. Advanced power supplies, also known as specialized gaming PSUs, cater to the unique needs of high-end graphics cards, processors, multi-GPU setups, and overclocking. With the rise of esports and streaming, the requirement for reliable and efficient power supplies is paramount. These modern gaming systems, comprised of motherboards, graphics cards, storage devices, and cooling solutions, necessitate substantial electrical power. As electronic devices become more integrated into smart homes and cities, the importance of e-waste reduction and energy efficiency in power supplies also gains significance.
How is this Computer Power Supply For PC Gaming Industry segmented and which is the largest segment?
The Market research report provides comprehensive data (region-wise segment analysis), with forecasts and estimates in "USD million" for the period 2024-2028, as well as historical data from 2018-2022 for the following segments.
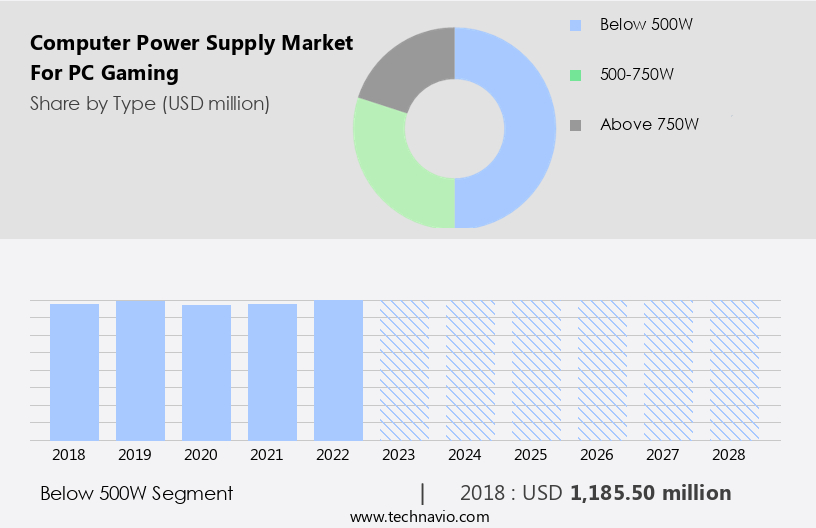
- Type
- Below 500W
- 500-750W
- Above 750W
- Distribution Channel
- Offline
- Online
- Geography
- APAC
- China
- India
- Japan
- Singapore
- North America
- Canada
- US
- Europe
- Germany
- UK
- France
- Middle East and Africa
- South America
- APAC
By Type Insights
- The below 500w segment is estimated to witness significant growth during the forecast period.
The market caters to various segments, with the 500W segment primarily serving entry-level gaming systems and basic computer setups. These power supplies offer less than 500 watts of output, making them suitable for systems without demanding graphics or intensive processing tasks. Notably, FSP GROUP introduced the FSP400-50AMB, a 400W industrial power supply, on April 11, 2023, expanding the options for budget-friendly gaming setups. Enhancements in this segment include MultiGPU setups, overclocking capabilities, and specialized cooling systems. Additionally, eSports participants and streamers may require power supplies with enhanced features for uninterrupted performance. Customizable RGB lighting is another trend in this market, adding aesthetic value to gaming rigs.
Get a glance at the Computer Power Supply For PC Gaming Industry report of share of various segments Request Free Sample
The below 500W segment was valued at USD 1.19 billion in 2018 and showed a gradual increase during the forecast period.
Regional Analysis
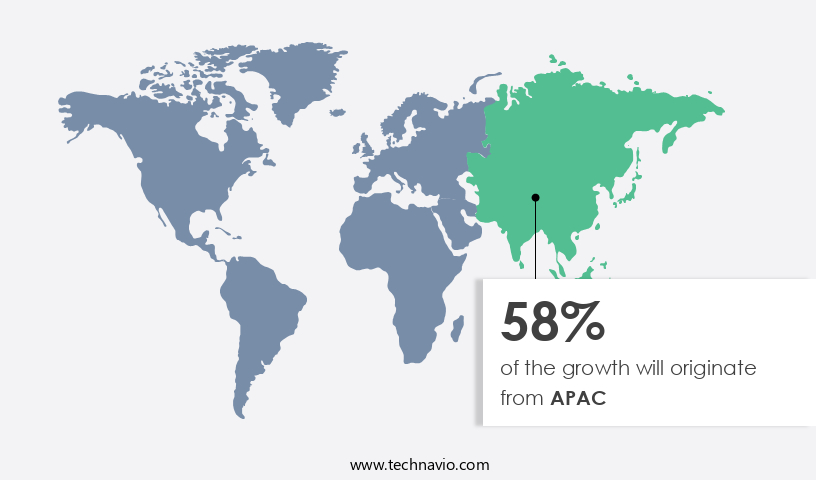
- APAC is estimated to contribute 58% to the growth of the global market during the forecast period.
Technavio's analysts have elaborately explained the regional trends and drivers that shape the market during the forecast period.
For more insights on the market share of various regions, Request Free Sample
The Asia-Pacific (APAC) region is a major contributor to The market, driven by the largest and most active gaming communities in countries such as China, Japan, South Korea, and India. Factors fueling this growth include increasing disposable income, greater access to high-performance gaming hardware, and a growing enthusiasm for e-sports and competitive gaming. China, in particular, stands out with its massive video game player population, which reached a record 668 million as of June 30, 2023.
Moreover, this figure represents nearly half of China's total population, highlighting the pervasive popularity of gaming in the region. In response to the demands of modern gaming hardware, power supplies for PC gaming in APAC feature modular designs for customizable configurations, advanced cooling solutions, and high wattages for multi-GPU setups. Energy efficiency is also a priority, with gaming power supplies incorporating the latest gaming technologies to minimize power consumption while maximizing performance.
Market Dynamics
Our computer power supply market for PC gaming researchers analyzed the data with 2023 as the base year, along with the key drivers, trends, and challenges. A holistic analysis of drivers will help companies refine their marketing strategies to gain a competitive advantage.
What are the key market drivers leading to the rise in the adoption of Computer Power Supply For PC Gaming Industry?
Increasing number of e-sports events is the key driver of the market.
- The Computer Power Supply Market For PC Gaming experiences continuous growth due to the increasing popularity of high-performance gaming rigs. Power supply units (PSUs), a crucial component of these systems, play a vital role in delivering the electrical power required by advanced graphics cards, processors, and other modern gaming hardware. High-end graphics cards and multi-GPU setups, in particular, necessitate specialized gaming PSUs capable of handling high wattages and providing enhanced cooling systems. Moreover, overclocking, a common practice among competitive gamers and streamers, further increases the power demands. Consequently, energy efficiency and Platinum certifications have become essential features for gaming PSUs, ensuring both performance and cost savings.
- Moreover, customizable RGB lighting and modular designs add aesthetic appeal, catering to the preferences of gamers. Counterfeit products pose a significant threat to the market, necessitating safety certifications such as UL Certification. As the demand for high-performance systems continues to rise, the market for computer power supplies is expected to grow. The increasing integration of gaming technologies into smart homes and cities, as well as the expanding e-waste issue, further influence the market dynamics. In summary, the market is a critical sector driven by the needs of the gaming community, with a focus on high-performance systems, energy efficiency, and safety.
What are the market trends shaping the Computer Power Supply For PC Gaming Industry?
The introduction of new products by vendors is the upcoming market trend.
- The Computer Power Supply Market For PC Gaming is experiencing a notable trend as companies release advanced power supply units (PSUs) to cater to the power requirements of high-performance gaming rigs. These specialized gaming PSUs are essential for supporting multi-GPU setups, high-end graphics cards, processors, and other modern gaming hardware. The increasing popularity of eSports and streaming has further fueled the demand for reliable and efficient power supplies. ASUSTeK, a leading company, introduced the ROG Strix Platinum PSU series on September 12, 2024. This series includes power supplies with 1200-watt, 1000-watt, and 850-watt capacities. These high-wattage PSUs feature gallium-nitride MOSFETs, which improve energy efficiency by up to 30% and enhance thermal performance.
- Additionally, they come with modular designs, enhanced cooling systems, and customizable RGB lighting for aesthetic appeal. The importance of safety certifications, such as UL Certification, is a crucial factor in the computer power supply market. These certifications ensure the safety and reliability of the power supplies, protecting both the user and the electronic devices from potential electrical hazards. Furthermore, energy efficiency and platinum certifications are becoming increasingly important as the world moves towards smart homes and cities and the issue of e-waste becomes more pressing. In summary, the market is experiencing significant growth as companies introduce advanced PSUs to cater to the power requirements of high-performance gaming systems. These power supplies offer improved energy efficiency, enhanced thermal performance, and customizable features, making them an essential component of modern gaming rigs. Safety certifications and energy efficiency are key considerations for companies and consumers alike as the market continues to evolve.
What challenges does the Computer Power Supply For PC Gaming Industry face during its growth?
Regulatory compliance is a key challenge affecting the industry's growth.
- The market in the US is driven by the demand for high-performance gaming systems that can support advanced graphics cards, processors, and multi-GPU setups. These gaming rigs require specialized power supplies, or PSUs, with enhanced cooling systems and modular designs to ensure reliable and efficient power delivery. High-end graphics cards and processors consume substantial electrical power, necessitating power supplies with high wattages and energy efficiency certifications, such as Platinum. Moreover, overclocking, eSports, and streaming further increase the power demands of gaming rigs. Consequently, manufacturers must produce power supplies that can handle these power-intensive applications while maintaining optimal cooling and energy efficiency.
- Additionally, safety certifications, such as UL, are essential to ensure the safety and reliability of gaming power supplies. Customizable RGB lighting and aesthetic appeal have become popular features in modern gaming hardware, and power supplies are no exception. Modular power supplies, which allow users to selectively connect only the cables they need, offer both functional and aesthetic benefits. However, the market is also plagued by counterfeit products, which can pose safety risks and compromise system performance. As the demand for high-performance computers continues to grow, regulatory compliance poses a significant challenge for the computer power supply market. The 80 Plus certification program sets energy efficiency standards for power supplies, while the WEEE Directive mandates the proper disposal of electronic waste. Manufacturers must balance the need for high performance and energy efficiency with regulatory requirements and consumer demand for safety and reliability.
Exclusive Customer Landscape
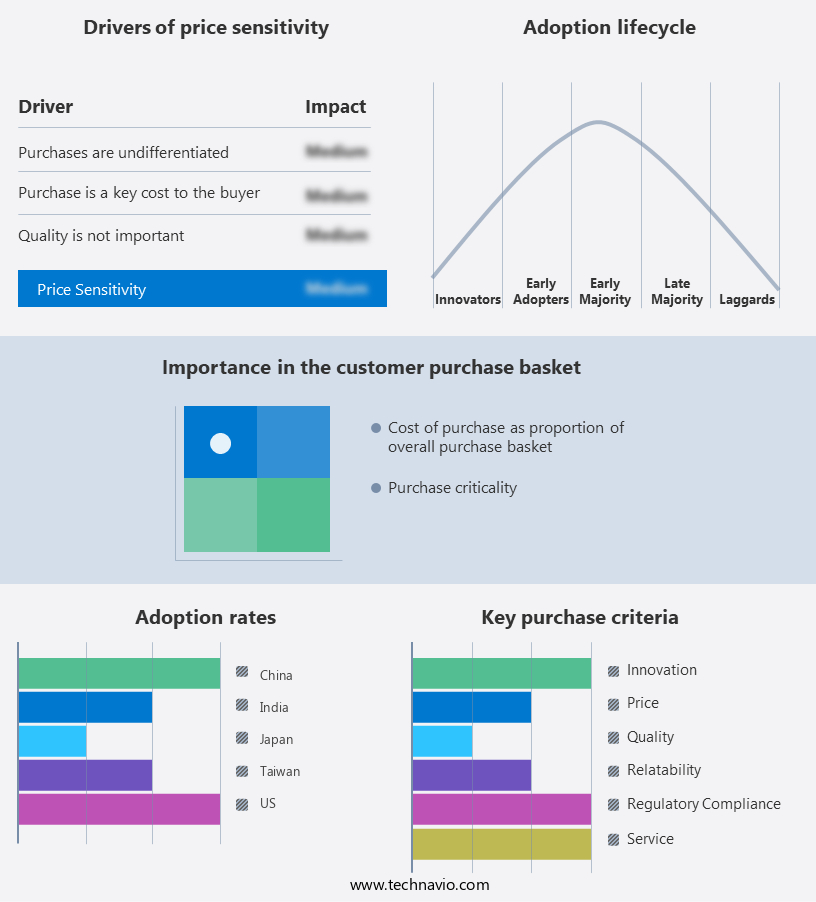
The market forecasting report includes the adoption lifecycle of the market, covering from the innovator's stage to the laggard's stage. It focuses on adoption rates in different regions based on penetration. Furthermore, the market report also includes key purchase criteria and drivers of price sensitivity to help companies evaluate and develop their market growth analysis strategies.
Customer Landscape
Key Companies & Market Insights
Companies are implementing various strategies, such as strategic alliances, market forecast, partnerships, mergers and acquisitions, geographical expansion, and product/service launches, to enhance their presence in the industry. The industry research and growth report includes detailed analyses of the competitive landscape of the market and information about key companies, including:
- ADATA Technology Co. Ltd.
- Aerocool Advanced Technologies Inc.
- ASUSTeK Computer Inc.
- Be Quiet
- Chicony Power Technology Co. Ltd.
- Cooler Master Technology Inc.
- Corsair Gaming Inc.
- COUGAR
- Delta Electronics Inc.
- DONGGUAN GOLDEN FIELD INDUSTRIAL CO. LTD.
- EVGA Corp.
- FSP GROUP
- GameMax
- Gigabyte Technology Co. Ltd.
- Lenovo Group Ltd.
- LITE ON Technology Corp.
- Sea Sonic
- Segotep
- SilverStone Technology Co. Ltd.
Qualitative and quantitative analysis of companies has been conducted to help clients understand the wider business environment as well as the strengths and weaknesses of key industry players. Data is qualitatively analyzed to categorize companies as pure play, category-focused, industry-focused, and diversified; it is quantitatively analyzed to categorize companies as dominant, leading, strong, tentative, and weak.
Research Analyst Overview
The Computer Power Supply Market For PC Gaming continues to evolve, with high-performance gaming rigs becoming increasingly popular among enthusiasts. At the heart of these systems are power supply units (PSUs), also known as advanced power supplies or specialized gaming PSUs. These components play a crucial role in delivering the electrical power required to operate modern gaming hardware, including high-end graphics cards, processors, and multigpu setups. As gaming technologies advance, the demand for more power and efficient energy consumption grows. High-performance gaming systems often require substantial wattages to operate, making energy efficiency a significant consideration. Platinum certifications, such as the UL 1950 standard, are increasingly important for gamers seeking reliable and efficient power supplies. Modern gaming hardware, including high-end graphics cards and processors, generates significant heat during operation.
However, the Computer Power Supply Market For PC Gaming is not without challenges. Counterfeit products pose a significant threat to consumers, with some unscrupulous sellers offering inferior or even dangerous power supplies. Safety certifications, such as UL certification, are essential to ensure the safety and reliability of gaming components. Modular designs are another trend in the gaming PSU market, offering flexibility and ease of installation. These systems allow users to connect only the cables they need, reducing clutter and improving airflow. Modular power supplies also offer better compatibility with modern gaming hardware, including motherboards, graphics cards, storage devices, and cooling solutions. The rise of esports and streaming has further fueled the demand for high-performance gaming systems. Gamers require reliable and efficient power supplies to ensure uninterrupted gameplay and high-quality streams. Energy efficiency is also essential for reducing e-waste and minimizing the carbon footprint of gaming rigs.
In summary, the Computer Power Supply Market For PC Gaming continues to evolve, with power supplies playing a crucial role in delivering the electrical power required to operate high-performance gaming systems. Energy efficiency, safety certifications, and aesthetic appeal are key considerations for gamers seeking the best possible experience. The market for specialized gaming PSUs is expected to grow as the demand for more powerful and efficient systems continues to increase.
|
Computer Power Supply Market For PC Gaming Scope |
|
|
Report Coverage |
Details |
|
Page number |
202 |
|
Base year |
2023 |
|
Historic period |
2018-2022 |
|
Forecast period |
2024-2028 |
|
Growth momentum & CAGR |
Accelerate at a CAGR of 4.8% |
|
Market growth 2024-2028 |
USD 752.1 million |
|
Market structure |
Fragmented |
|
YoY growth 2023-2024(%) |
3.4 |
|
Key countries |
China, US, Japan, Taiwan, India, Germany, Singapore, Canada, UK, and France |
|
Competitive landscape |
Leading Companies, Market Positioning of Companies, Competitive Strategies, and Industry Risks |
What are the Key Data Covered in this Computer Power Supply Market For PC Gaming Research and Growth Report?
- CAGR of the Computer Power Supply For PC Gaming industry during the forecast period
- Detailed information on factors that will drive the Computer Power Supply For PC Gaming market growth and forecasting between 2024 and 2028
- Precise estimation of the size of the market and its contribution of the industry in focus to the parent market
- Accurate predictions about market growth and trends and changes in consumer behaviour
- Growth of the market across APAC, North America, Europe, Middle East and Africa, and South America
- A thorough market research and growth analysis of the market's competitive landscape and detailed information about companies
- Comprehensive analysis of factors that will challenge the computer power supply market for PC gaming growth of industry companies
We can help! Our analysts can customize this computer power supply market for PC gaming research report to meet your requirements.
 RIA -
RIA - 
