Southeast Asia Construction Chemicals Market Size and Trends
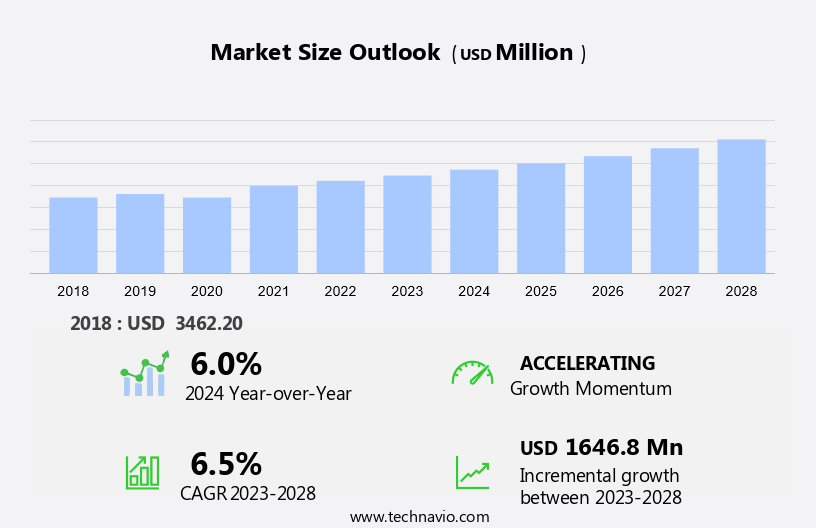
The Southeast Asia construction chemicals market size is forecast to increase by USD 1.65 billion, at a CAGR of 6.5% between 2023 and 2028. The market is experiencing significant growth due to several key drivers. One of the primary factors is the increasing demand for retrofitting existing structures with epoxy resins and protective coatings for corrosion protection and weather resistance. Building codes are increasingly mandating the use of fire resistance and thermal insulation materials, leading to a rise in demand for admixtures and other construction chemicals. Additionally, there is a growing emphasis on eco-friendly and energy-efficient products, which is driving innovation in the market. However, the market is also facing challenges such as the volatility in raw material prices and the need for cost-effective solutions. Overall, the market is expected to continue growing as construction projects prioritize durability, sustainability, and compliance with regulations.
Market Analysis
The market is a significant sector, contributing significantly to the region's infrastructure development. This market encompasses a wide range of products, including cement, concrete, coatings, concrete performance enhancers, prefabrication and modular construction materials, adhesives and sealants, quick curing agents, concrete admixtures, waterproofing solutions, plaster, asphalt additives, and various specialty chemical compounds. Construction projects, whether residential or commercial, require a vast array of materials to ensure their success. Cement and concrete are fundamental building blocks, while concrete performance enhancers enable the production of stronger, more durable structures. Prefabrication and modular construction materials streamline the building process, reducing the need for extensive on-site labor and increasing efficiency. Adhesives and sealants play a crucial role in bonding various materials together, ensuring structural integrity and weather resistance. Quick curing agents expedite the construction process, allowing projects to be completed more quickly. Concrete repair mortars and plaster are essential for maintaining and restoring existing structures. Asphalt additives enhance the performance and durability of roads and other paved surfaces.
Furthermore, speciality chemical compounds cater to specific construction needs, such as water and cement additives for green construction and sustainable materials, thermal insulation for energy efficiency, building protection against environmental factors, and cool roof treatments for energy savings. The construction materials market in North America is driven by the demand for infrastructure development and the ongoing modernization of existing structures. The availability of skilled manpower and the increasing adoption of technology usage in the sector further fuel market growth. Green construction and sustainable materials are becoming increasingly important in the construction chemicals and building materials market. Water and cement additives, thermal insulation, and building protection solutions are key areas where eco-friendly alternatives are gaining traction. The use of sustainable materials not only benefits the environment but also contributes to the overall cost savings and efficiency of construction projects.
Market Segmentation
The market research report provides comprehensive data (region-wise segment analysis), with forecasts and estimates in "USD billion" for the period 2024-2028, as well as historical data from 2018 - 2022 for the following segments.
- Application
- Non-residential
- Residential
- Geography
- Southeast Asia
- Singapore
- Malaysia
- Thailand
- Indonesia
- Rest of Southeast Asia
- Southeast Asia
By Application Insights
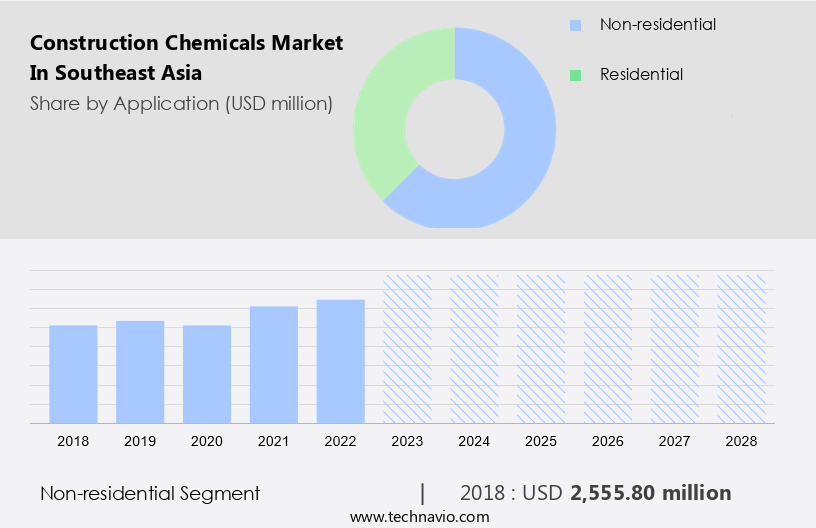
The non-residential segment is estimated to witness significant growth during the forecast period. The non-residential construction sector encompasses corporations, banks, food establishments, retail outlets, healthcare facilities, laundry services, hotels, and other related structures. The demand for construction chemicals in this segment is projected to persist, as factors such as expanding economic activities and globalization lead to an increase in the construction of commercial spaces. The opening of numerous corporate offices and the growing urbanization in countries like Vietnam, the Philippines, and Singapore are major contributors to the rise in commercial construction.
Get a glance at the market share of various segments Download the PDF Sample
The non-residential segment was valued at USD 2.56 billion in 2018. Construction chemicals play a crucial role in retrofitting existing structures, enhancing fire resistance and thermal insulation, and providing corrosion inhibitors, protective coatings, and wear protection. Epoxy resins and admixtures are commonly used for enhancing the durability and strength of structures, while weather protection is essential for maintaining the longevity of buildings in this region. Building codes and regulations mandate the use of these chemicals to ensure safety and compliance, further fueling the demand for construction chemicals in Southeast Asia.
Market Dynamics
Our researchers analyzed the data with 2023 as the base year, along with the key drivers, trends, and challenges. A holistic analysis of drivers will help companies refine their marketing strategies to gain a competitive advantage.
Southeast Asia Construction Chemicals Market Driver
Increasing demand for concrete admixtures is notably driving market growth. Concrete admixtures are essential components added to the concrete mix to improve its performance during various stages of construction. These specialty chemical compounds, including Master Builder Solutions' Polycarboxylates (PCE), enhance concrete's properties such as workability, strength, and durability. The increasing urban population and housing shortage in countries like Malaysia, Indonesia, and the Philippines have led to a rise in affordable housing unit construction, thereby fueling the demand for these admixtures. Manufacturers, recognizing this trend, are investing in research and development to introduce innovative products and expand their offerings. Green construction and sustainable materials are gaining popularity, leading to an increased focus on eco-friendly concrete admixtures.
Furthermore, logistics and efficient transportation of these chemicals are crucial factors that manufacturers must consider to ensure timely delivery and maintain competitiveness in the market. The demand for concrete admixtures is expected to grow as construction activities continue to increase. Manufacturers are focusing on providing high-quality, cost-effective solutions to meet the evolving needs of the industry. By staying updated on the latest trends and regulations, these companies can maintain their competitive edge and cater to the growing demand for better-performing, sustainable construction materials. Thus, such factors are driving the growth of the market during the forecast period.
Southeast Asia Construction Chemicals Market Trends
Rising support for eco-friendly and energy-efficient products is the key trend in the market. Construction chemicals play a crucial role in the building industry, particularly in the production of cement, concrete, coatings, and various other materials. Regulations promoting the construction of energy-efficient and eco-friendly buildings are driving the demand for construction chemicals that adhere to these standards. Water-based reactive formulations are gaining popularity over solvent-based ones due to their compliance with VOC emission regulations. Manufacturers are also working on reformulating solvent-based products to make them more environmentally friendly. Polyurethane- and silicone-based adhesives and sealants are anticipated to experience increased demand due to their superior performance. In addition, hotmelt products are expected to see strong growth due to their quick curing properties, which expedite the processing of chemicals and contribute to faster project completion times.
Moreover, these trends are shaping the market. The construction industry's shift towards prefabrication and modular construction methods is also impacting the demand for construction chemicals. These methods require chemicals that can withstand transportation and storage, as well as those that can be applied in controlled environments. As such, the market for construction chemicals is expected to remain dynamic and innovative, with a focus on delivering high-performance, eco-friendly, and cost-effective solutions. Thus, such trends will shape the growth of the market during the forecast period.
Southeast Asia Construction Chemicals Market Challenge
Volatility in raw material prices is the major challenge that affects the growth of the market. The market faces significant challenges due to the volatile pricing of raw materials used in manufacturing protective coatings, adhesives, and sealants. Raw materials, including polymers, cellulosic, adhesion promoters, titanium dioxide, epoxy resins, and related solvents, have experienced frequent price fluctuations in recent years. For example, the cost of titanium dioxide (TiO2), a crucial raw material for construction additives, has seen significant price changes. Additionally, the scarcity of base chemicals essential for resin production contributes to the increased cost of additives utilized in concrete and paints. In the realm of building protection, construction chemicals play a vital role. Cool roof treatments, corrosion resistance, and waterproofing chemicals are essential components in ensuring the longevity and durability of structures. Structural tapes, thermoset hot melts, and multi-purpose adhesives provide the necessary bonding strength for various construction applications.
In addition, flooring chemicals and concrete admixtures contribute significantly to the aesthetic appeal and functionality of buildings. VOC emissions from these chemicals must be carefully managed to ensure indoor air quality and comply with environmental regulations. In conclusion, the market is subject to the price volatility of raw materials, which impacts the production costs of various construction chemicals. Despite these challenges, the market continues to grow, driven by the demand for building protection, structural integrity, and aesthetic appeal. Hence, the above factors will impede the growth of the market during the forecast period.
Exclusive Customer Landscape
The market forecasting report includes the adoption lifecycle of the market, covering from the innovator's stage to the laggard's stage. It focuses on adoption rates in different regions based on penetration. Furthermore, the report also includes key purchase criteria and drivers of price sensitivity to help companies evaluate and develop their market growth analysis strategies.

Customer Landscape
Key Companies & Market Insights
Companies are implementing various strategies, such as strategic alliances, partnerships, mergers and acquisitions, geographical expansion, and product/service launches, to enhance their presence in the market.
Adani Group - The company offers construction chemicals such as concrete admixtures, waterproofing solutions, and repair products designed to enhance the durability and performance of construction materials.
The market research and growth report also includes detailed analyses of the competitive landscape of the market and information about key companies, including:
- 3M Co.
- Akzo Nobel NV
- Arkema
- Ashland Inc.
- BASF SE
- CHRYSO SAS
- Croda International Plc
- Dow Inc.
- Evonik Industries AG
- Fosroc International Ltd.
- Henkel AG and Co. KGaA
- Knopp gmbh
- Pidilite Industries Ltd
- RPM International Inc.
- Sika AG
- SWC BROTHERS CO. LTD.
- Tata Chemicals Ltd.
- Tremco Inc.
- W. R. Grace and Co.
Qualitative and quantitative analysis of companies has been conducted to help clients understand the wider business environment as well as the strengths and weaknesses of key market players. Data is qualitatively analyzed to categorize companies as pure play, category-focused, industry-focused, and diversified; it is quantitatively analyzed to categorize companies as dominant, leading, strong, tentative, and weak.
Construction chemicals play a vital role in enhancing the performance and durability of building materials such as cement, concrete, and coatings. These specialized chemicals offer benefits like quick curing, retrofitting, and improved concrete performance for various construction applications. Prefabrication and modular construction have gained popularity, leading to increased demand for advanced construction chemicals like epoxy resins, corrosion inhibitors, and adhesives. Building codes require fire resistance, thermal insulation, and weather protection, making the use of protective coatings essential. Sustainable buildings and infrastructure development prioritize eco-friendly products, including non-residential commercial buildings, industrial facilities, and public infrastructure.
In addition, skilled manpower and technology usage are crucial in commercial building development, with master builder solutions providing efficient, cost-effective alternatives. Affordable housing units, urban population growth, and housing shortages necessitate the use of advanced construction chemicals for residential construction projects. Specialty chemical compounds like polycarboxyles (PCE) and logistics optimization are essential in the construction materials industry, which includes water and cement, green construction, and sustainable materials. Construction chemicals cater to various applications, including concrete repair mortar, plaster, asphalt additives, flooring chemicals, waterproofing chemicals, and aesthetic appeal enhancers. VOC emissions, structural tapes, thermoset hot melts, and multi-purpose adhesives are other essential categories in the market.
|
Market Scope |
|
|
Report Coverage |
Details |
|
Page number |
146 |
|
Base year |
2023 |
|
Historic period |
2018 - 2022 |
|
Forecast period |
2024-2028 |
|
Growth momentum & CAGR |
Accelerate at a CAGR of 6.5% |
|
Market Growth 2024-2028 |
USD 1.65 billion |
|
Market structure |
Fragmented |
|
YoY growth 2023-2024(%) |
6.0 |
|
Competitive landscape |
Leading Companies, Market Positioning of Companies, Competitive Strategies, and Industry Risks |
|
Key companies profiled |
3M Co., Adani Group, Akzo Nobel NV, Arkema, Ashland Inc., BASF SE, CHRYSO SAS, Croda International Plc, Dow Inc., Evonik Industries AG, Fosroc International Ltd., Henkel AG and Co. KGaA, Knopp gmbh, Pidilite Industries Ltd, RPM International Inc., Sika AG, SWC BROTHERS CO. LTD., Tata Chemicals Ltd., Tremco Inc., and W. R. Grace and Co. |
|
Market dynamics |
Parent market analysis, Market growth inducers and obstacles, Fast-growing and slow-growing segment analysis, COVID-19 impact and recovery analysis and future consumer dynamics, Market condition analysis for market forecast period |
|
Customization purview |
If our market report has not included the data that you are looking for, you can reach out to our analysts and get segments customized. |
What are the Key Data Covered in this Market Research Report?
- CAGR of the market during the forecast period
- Detailed information on factors that will drive the market growth and forecasting between 2024 and 2028
- Precise estimation of the size of the market and its contribution of the market in focus to the parent market
- Accurate predictions about upcoming market growth and trends and changes in consumer behaviour
- Growth of the market across Southeast Asia
- Thorough analysis of the market's competitive landscape and detailed information about companies
- Comprehensive analysis of factors that will challenge the growth of market companies
We can help! Our analysts can customize this market research report to meet your requirements.
 RIA -
RIA - 
