
Construction Waste Management Market Size 2024-2028
The construction waste management market size is forecast to increase by USD 34.38 billion at a CAGR of 6.5% between 2023 and 2028.
- Construction waste management has emerged as a significant concern for municipal authorities and construction industry players. The market is driven by the increasing initiative to manage construction waste sustainably, with a focus on recycling and diversion. Innovations in construction waste management, such as advanced technologies for sorting and processing waste, are also contributing to market growth. Strict regulations related to construction waste management, including penalties for illegal dumping and resource hoarding, are further propelling the market forward. The challenge lies in effectively implementing these regulations and encouraging industry-wide adoption of sustainable practices. By focusing on these trends and addressing the challenges, the market is poised for continued growth.
What will be the Size of the Market During the Forecast Period?

- The construction industry generates a significant amount of waste each year. According to the Environmental Protection Agency (EPA), construction and demolition activities accounted for over 600 million tons of waste in the United States alone in 2018. This waste includes concrete and gravel, clay bricks and ceramics, asphalt and tar, and other materials. Effective construction waste management is crucial for reducing the environmental impact of these activities and promoting a circular economy. One of the primary challenges is the labor scarcity in sorting and separating waste materials on construction sites. This issue can lead to inefficient waste management practices and increased costs. However, advancements in technology, such as AI-powered robots, are helping to address this challenge by automating waste sorting and separation processes.
- Moreover, this issue can lead to inefficient practices and increased costs. However, advancements in technology, such as AI-powered robots, are helping to address this challenge by automating waste sorting and separation processes. Another challenge is supply chain disruption. Delays in the delivery of recycling equipment or the transportation of waste to recycling plants can hinder the progress of construction projects and increase costs. To mitigate this challenge, it is essential to establish reliable partnerships with waste management service providers and implement contingency plans. The circular economy is gaining momentum in the construction industry as stakeholders recognize the importance of reducing waste and promoting resource efficiency.
How is this market segmented and which is the largest segment?
The market research report provides comprehensive data (region-wise segment analysis), with forecasts and estimates in "USD billion" for the period 2024-2028, as well as historical data from 2018-2022 for the following segments.
- Service Type
- Collection and transportation
- Recycling
- Disposal
- Application
- Commercial
- Residential
- Industrial
- Geography
- APAC
- China
- Europe
- Germany
- France
- North America
- US
- Middle East and Africa
- South America
- APAC
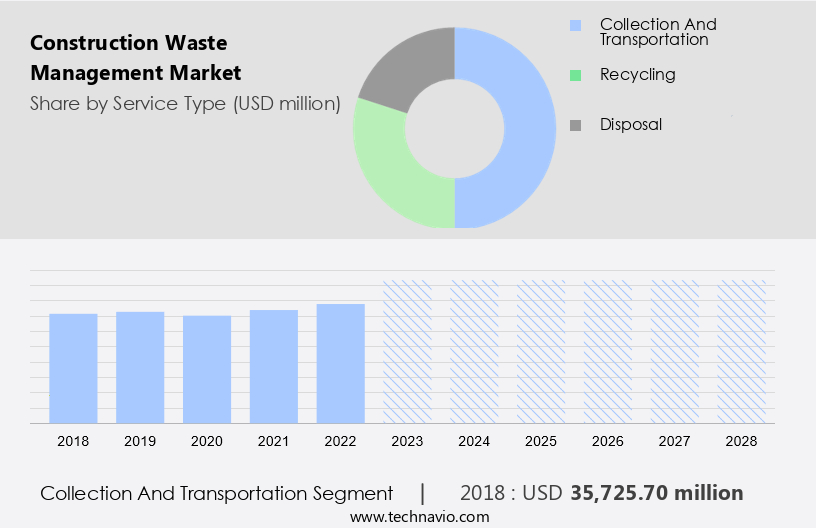
By Service Type Insights
- The collection and transportation segment is estimated to witness significant growth during the forecast period.
The market encompasses the process of collecting and transporting construction waste from various sites to recycling or disposal facilities. Furthermore, the company manages a transfer station in Fareham and a fleet of 91 collection vehicles. These assets enable L and S to cater to major urban areas along the South Coast of England, including Southampton, Portsmouth, Fareham, and Chichester.
Furthermore, the acquisition signifies the increasing demand for effective construction waste management solutions as construction activities and renovation projects continue to generate significant amounts of waste material. By focusing on reuse and reducing the reliance on landfills, this market plays a crucial role in promoting sustainability within the construction industry.
Get a glance at the market report of share of various segments Request Free Sample
The collection and transportation segment was valued at USD 35.72 billion in 2018 and showed a gradual increase during the forecast period.
Regional Analysis
- APAC is estimated to contribute 40% to the growth of the global market during the forecast period.
Technavio's analysts have elaborately explained the regional trends and drivers that shape the market during the forecast period.

For more insights on the market share of various regions Request Free Sample
The market in the Asia Pacific region, with a focus on India, is experiencing significant growth due to the country's rapid urbanization and industrial expansion. The Indian construction industry generates an estimated 150-500 million tonnes of waste annually, creating challenges such as unauthorized disposal and improper dumping. The Indian government recognizes the construction industry's critical role in the economy, as it is the second-largest employer in the country and has extensive connections to over 250 sectors. By 2025, India is projected to have the third-largest construction market globally, highlighting the need for effective waste management solutions. To address these challenges, advanced recycling machines and AI-powered robots are being implemented in recycling plants to increase circular economy practices.
Further, labor scarcity and supply chain disruptions have made it essential to adopt innovative technologies to streamline recycling activities and reduce the environmental impact of construction waste. Concrete and gravel, two of the most common types of construction waste, can be effectively recycled and reused in new projects, contributing to cost savings and sustainability efforts. In conclusion, the market in India and the Asia Pacific region presents significant opportunities for growth, driven by urbanization, industrial expansion, and the need for sustainable waste management solutions. Recycling machines, AI-powered robots, and circular economy practices are key areas of focus to address labor scarcity, supply chain disruptions, and the environmental impact of construction waste.
Market Dynamics
Our researchers analyzed the data with 2023 as the base year, along with the key drivers, trends, and challenges. A holistic analysis of drivers will help companies refine their marketing strategies to gain a competitive advantage.
What are the key market drivers leading to the rise in adoption of Construction Waste Management Market?
Increasing initiative for construction waste management is the key driver of the market.
- The market in India is undergoing a transformation due to growing efforts to address the long-standing issue of construction debris. Historically, stakeholders including builders, developers, and property purchasers have paid scant attention to repurposing construction waste into valuable resources that could lower building expenses. However, recent initiatives are starting to alter this perspective, leading to a renewed emphasis on eco-friendly practices.
- The European Union's Waste Framework Directives have set stringent guidelines for managing construction waste, and similar regulations could soon be implemented in India. As a result, construction companies and stakeholders are increasingly recognizing the importance of adhering to these standards to minimize their environmental footprint and comply with future regulations. Bricks and ceramics, asphalt and tar, metals, and demolition and renovation debris are among the primary types of construction waste. Effective management of these materials can lead to substantial cost savings and environmental benefits. By implementing sustainable practices, the construction industry can reduce its carbon footprint and contribute to a greener future.
What are the market trends shaping the Construction Waste Management Market?
Innovation in construction waste management is the upcoming trend in the market.
- The market in the United States is experiencing notable progress due to technological innovations, particularly in the areas of sensor technology and artificial intelligence (AI). These advancements are addressing age-old issues in managing construction site waste, leading to more efficient and sustainable practices. One significant development is the integration of Internet of Things (IoT) connectivity with sensor technology. Modern sensors installed in waste containers now provide real-time fill-level measurements, which are transmitted to AI-driven systems. This data enables optimized waste collection schedules, minimizing unnecessary pickups and ensuring containers are serviced only when necessary. This not only streamlines operations but also supports the broader objective of achieving a circular economy by reducing waste and promoting recycling.
- Municipal authorities are increasingly recognizing the importance of sustainable waste management practices in demolition projects. Resource hoarding and dumping are becoming less common as recycling and diversion become more viable options. The adoption of these practices not only benefits the environment but also reduces the overall cost of waste disposal. In conclusion, the market in the US is undergoing a transformation, driven by technological advancements and a growing focus on sustainability. The integration of IoT and AI is leading to more efficient operations and a reduced environmental footprint. Municipal authorities are embracing these practices, leading to a shift towards a circular economy in demolition projects.
What challenges does Construction Waste Management Market face during its growth?
Stringent regulations related to construction waste management is a key challenge affecting the market growth.
- The market is subject to stringent regulations set by regulatory bodies to minimize environmental harm. Regulations such as the Resource Conservation and Recovery Act (RCRA) and the Environmental Protection Agency's (EPA) acts establish guidelines for managing construction waste. These regulations prioritize waste minimization, proper disposal, and recycling. Compliance with environmental stewardship requirements is a significant challenge for companies in the industry. To meet these standards, firms must adopt these practices that minimize their ecological footprint. Advanced disposal services, including landfill operations and recycling capacity, play a crucial role in ensuring compliance. Nonhazardous debris from building construction and deconstruction processes must be handled and disposed of in an environmentally responsible manner.
- Smart Cities and infrastructure development initiatives are driving the need for more efficient solutions. Infrastructure development projects require large amounts of construction waste, making it essential to have effective waste management systems in place. By implementing advanced waste management practices, companies can contribute to the sustainability goals of these initiatives while also ensuring regulatory compliance. In conclusion, the market in the US faces challenges in complying with environmental regulations while also meeting the demands of Smart Cities and infrastructure development projects. Companies must prioritize waste minimization, proper disposal, and recycling to meet these challenges and contribute to a more sustainable future.
Exclusive Customer Landscape
The market forecasting report includes the adoption lifecycle of the market, covering from the innovator's stage to the laggard's stage. It focuses on adoption rates in different regions based on penetration. Furthermore, the market report also includes key purchase criteria and drivers of price sensitivity to help companies evaluate and develop their market growth analysis strategies.

Customer Landscape
Key Companies & Market Insights
Companies are implementing various strategies, such as strategic alliances, market forecast, partnerships, mergers and acquisitions, geographical expansion, and product/service launches, to enhance their presence in the market. The market research and growth report includes detailed analyses of the competitive landscape of the market and information about key companies, including:
- Biffa Plc
- Bywaters
- Casella Waste Systems Inc.
- Clean Harbors Inc.
- corpseed ites Pvt Ltd.
- Enterclimate
- FCC Group
- Fluid Constructions
- GFL Environmental Inc.
- Kiverco Ltd
- Metso Outotec Corp.
- Paprec Group
- Remondis SE and Co. KG
- Renewi Plc
- Republic Services Inc.
- SAAHAS WASTE MANAGEMENT Pvt. Ltd.
- Veolia Environnement SA
- Waste Connections Inc.
- Waste Management Inc.
Qualitative and quantitative analysis of companies has been conducted to help clients understand the wider business environment as well as the strengths and weaknesses of key market players. Data is qualitatively analyzed to categorize companies as pure play, category-focused, industry-focused, and diversified; it is quantitatively analyzed to categorize companies as dominant, leading, strong, tentative, and weak.
Research Analyst Overview
The construction industry generates a significant amount of waste, with demolition, renovation, and building construction being the primary sources. This waste includes concrete and gravel, bricks and ceramics asphalt and tar, metals, and other nonhazardous debris. With an increasing focus on sustainable practices and the circular economy, there is a growing need for efficient solutions. Labor scarcity and supply chain disruptions in the construction sector can lead to delays and increased costs. AI-powered robots and advanced disposal services are being adopted to streamline these processes and improve recycling activities. Recycling plants play a crucial role in processing construction waste into reusable materials.
Furthermore, the environmental benefits of recycling are substantial, as it reduces the need for landfill operations and the generation of hazardous waste. Municipal authorities are implementing waste framework directives to promote sustainable waste management practices. Waste diversion through reuse and recycling is becoming a priority, with pilot programs being launched to test the effectiveness of these initiatives. Smart cities and infrastructure development require advanced waste management systems to accommodate the increased waste generation. Waste type plays a significant role in determining the most effective waste management solution, with hazardous waste requiring specialized handling and disposal methods. Collection and disposal services are essential for managing construction waste effectively. Construction activities generate a large volume of waste material, making it essential to have a well-organized waste management system in place to ensure efficient and sustainable waste management practices.
|
Market Scope |
|
|
Report Coverage |
Details |
|
Page number |
207 |
|
Base year |
2023 |
|
Historic period |
2018-2022 |
|
Forecast period |
2024-2028 |
|
Growth momentum & CAGR |
Accelerate at a CAGR of 6.5% |
|
Market growth 2024-2028 |
USD 34.38 billion |
|
Market structure |
Fragmented |
|
YoY growth 2023-2024(%) |
6.3 |
|
Key countries |
US, China, France, and Germany |
|
Competitive landscape |
Leading Companies, Market Positioning of Companies, Competitive Strategies, and Industry Risks |
What are the Key Data Covered in this Market Research and Growth Report?
- CAGR of the market during the forecast period
- Detailed information on factors that will drive the market growth and forecasting between 2024 and 2028
- Precise estimation of the size of the market and its contribution of the market in focus to the parent market
- Accurate predictions about upcoming market growth and trends and changes in consumer behaviour
- Growth of the market across APAC, Europe, North America, Middle East and Africa, and South America
- Thorough analysis of the market's competitive landscape and detailed information about companies
- Comprehensive analysis of factors that will challenge the growth of market companies
We can help! Our analysts can customize this market research report to meet your requirements. Get in touch
 RIA -
RIA - 
