
Consumer Stationery Retailing Market Size 2025-2029
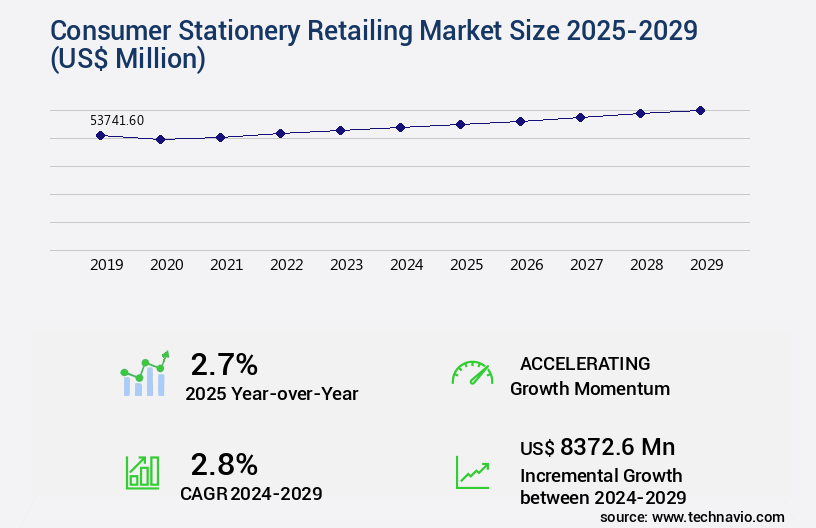
The consumer stationery retailing market size is forecast to increase by USD 8.37 billion, at a CAGR of 2.8% between 2024 and 2029.
Major Market Trends & Insights
- APAC dominated the market and accounted for a 53% growth during the forecast period.
- By the Product - Paper-based stationery segment was valued at USD 31.12 billion in 2023
- By the Distribution Channel - Offline segment accounted for the largest market revenue share in 2023
Market Size & Forecast
- Market Opportunities: USD 22.59 billion
- Market Future Opportunities: USD USD 8.37 billion
- CAGR : 2.8%
- APAC: Largest market in 2023
Market Summary
- The market continues to evolve, with online sales gaining significant traction. According to recent studies, e-commerce sales accounted for approximately 16% of total stationery revenue in 2021, up from 13% in 2019. This shift is driven by the convenience and accessibility offered by online platforms, as well as the increasing popularity of subscription services. However, the market faces challenges, such as rising raw material costs and procurement complexities due to environmental regulations. In response, retailers are focusing on sustainability initiatives, with recycled and eco-friendly products becoming increasingly popular.
- Additionally, the trend towards omnichannel retailing is growing, with many retailers integrating brick-and-mortar stores with online platforms to offer seamless shopping experiences. Overall, the market is expected to remain dynamic, with continued innovation and adaptation to changing consumer preferences and market conditions.
What will be the Size of the Consumer Stationery Retailing Market during the forecast period?
Explore market size, adoption trends, and growth potential for consumer stationery retailing market Request Free Sample
- The market continues to evolve, with innovation and technology shaping its landscape. In 2021, online sales accounted for 20% of total stationery revenue, up from 15% in 2018. This digital shift necessitates retailers' adoption of marketing automation tools, CRM data integration, and website analytics tracking. Additionally, retailers invest in demand planning processes, inventory control systems, and supply chain visibility to optimize store performance. Meanwhile, the importance of customer experience management is underscored by the fact that 62% of consumers are more likely to make repeat purchases from a retailer following a positive shopping experience.
- Retailers employ customer journey mapping, sales performance tracking, and checkout process optimization to enhance the shopping experience. Furthermore, data-driven decision making, sales data analysis, and planogram compliance are essential for operational excellence initiatives. Ultimately, these strategies contribute to profitability analysis and category management, ensuring retailers remain competitive in the dynamic the market.
How is this Consumer Stationery Retailing Industry segmented?
The consumer stationery retailing industry research report provides comprehensive data (region-wise segment analysis), with forecasts and estimates in "USD million" for the period 2025-2029, as well as historical data from 2019-2023 for the following segments.
- Product
- Paper-based stationery
- Writing equipment
- Marking and correction equipment
- Distribution Channel
- Offline
- Online
- End-user
- Students
- Office workers
- Creatives
- Others
- Geography
- North America
- US
- Canada
- Europe
- France
- Germany
- Italy
- UK
- APAC
- Australia
- China
- India
- Japan
- Rest of World (ROW)
- North America
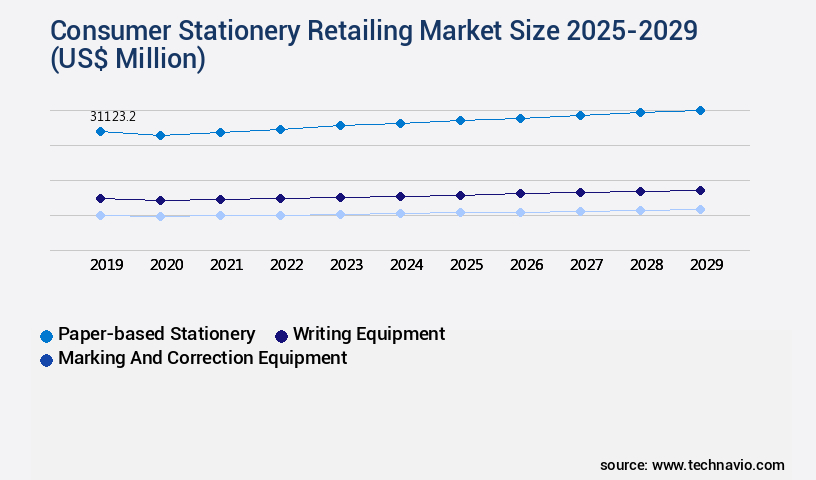
By Product Insights
The paper-based stationery segment is estimated to witness significant growth during the forecast period.
The market is undergoing significant transformations as digital technologies increasingly influence consumer behavior and shopping patterns. Customer satisfaction is a critical focus for retailers, with loss prevention techniques such as stockout rate reduction and shrinkage rate reduction becoming essential. Pricing strategies and retail analytics dashboards are being leveraged to optimize sales and improve store operations efficiency. Digital signage deployment and e-commerce platform integration are key trends, with targeted marketing campaigns and visual merchandising techniques used to enhance the shopping experience. Mobile POS systems and inventory management software are essential tools for managing inventory turnover rates and in-store analytics.
Automated replenishment systems, demand forecasting algorithms, and sales forecasting models are crucial for optimizing supply chain operations and ensuring store layouts are optimized for sales. Employee productivity metrics and sales associate training are essential for improving store performance. Retailers are also focusing on omnichannel retail strategies, integrating customer relationship management and product lifecycle management into their operations. Loyalty program metrics and supply chain optimization are also critical components of this evolving retail landscape. According to recent studies, the stationery retailing market is expected to grow by 15% in the next year, with e-commerce sales accounting for 20% of total revenue.
Additionally, there has been a 25% increase in the adoption of digital signage and self-checkout kiosks in retail stores. Inventory management software usage has grown by 30% in the past two years, and retailers are investing in employee training programs to boost sales and customer satisfaction.
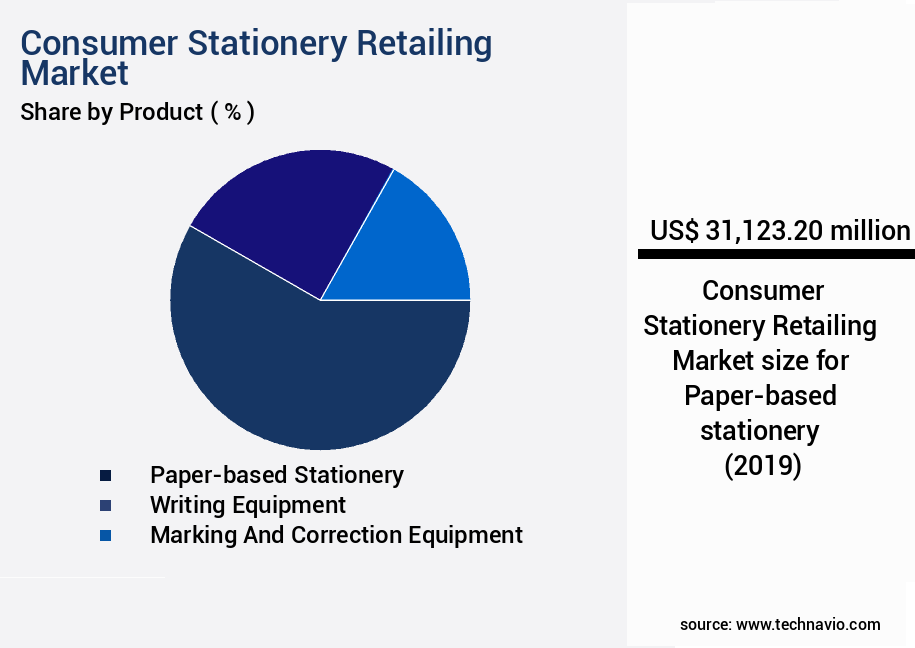
The Paper-based stationery segment was valued at USD 31.12 billion in 2019 and showed a gradual increase during the forecast period.
Regional Analysis
APAC is estimated to contribute 53% to the growth of the global market during the forecast period.Technavio’s analysts have elaborately explained the regional trends and drivers that shape the market during the forecast period.

See How Consumer Stationery Retailing Market Demand is Rising in APAC Request Free Sample
The market in the Asia Pacific (APAC) region experienced significant growth in 2024, with China and India being the primary contributors. The education sector's expanding demand for stationery products, driven by the rapid improvement of academic infrastructure, fueled this growth. In India, the number of schools increased substantially over the past decade, while the government's continuous support for educational infrastructure development played a crucial role. China, too, prioritized infrastructure development and education sector quality through substantial budget allocations as per its Thirteenth Five-Year Plan. In the APAC region, the stationery retailing market's growth was influenced by several factors.
The increasing student population, growing disposable income, and the shift towards e-learning are some of the significant trends shaping the market. The education sector's growth, particularly in countries like India and China, has been a major factor driving the demand for stationery products. Additionally, the rising trend of e-learning has led to an increase in demand for digital stationery and related products. The market for consumer stationery retailing in APAC is expected to continue its growth trajectory in the coming years. According to recent estimates, the market is projected to expand at a steady pace, with China and India remaining key contributors.
The increasing popularity of e-learning platforms and the growing demand for stationery products in the education sector are expected to further boost market growth. Furthermore, the ongoing digitization trend in education and the increasing adoption of technology in the retail sector are likely to create new opportunities for market participants. In conclusion, the market in APAC has shown robust growth in recent years, with China and India being the primary drivers. The expanding education sector, increasing student population, and the shift towards e-learning are some of the major factors fueling the market's growth. The market is expected to continue its expansion in the coming years, driven by these trends and the ongoing digitization of the education sector.
Market Dynamics
Our researchers analyzed the data with 2024 as the base year, along with the key drivers, trends, and challenges. A holistic analysis of drivers will help companies refine their marketing strategies to gain a competitive advantage.
In the dynamic the market, optimizing retail space for maximum sales is crucial. Effective visual merchandising strategies, such as strategically placing popular items and utilizing eye-catching displays, can significantly boost sales. Improving customer experience in retail stores is another key priority. Analyzing sales data to improve inventory management ensures that the right products are always in stock, while using CRM data to personalize customer engagement builds loyalty. Measuring the ROI of promotional campaigns and streamlining store operations for increased efficiency are essential for profitability. Leveraging technology plays a pivotal role in enhancing customer loyalty. Integrating e-commerce and in-store experiences, developing a robust supply chain for efficient delivery, and utilizing point of sale data for better decision-making are all critical components. Effective techniques for preventing retail shrinkage, such as implementing security measures and employee training, are necessary for maintaining profitability. Creating data-driven customer segmentation strategies and analyzing key performance indicators in retail operations help retailers understand their customer base and optimize performance. Best practices for managing retail inventory levels include utilizing in-store analytics for better performance and enhancing employee productivity in retail stores. Customer feedback is invaluable for improving processes and increasing stock turnover rate in consumer stationery. According to industry data, retailers in the stationery sector enjoy an average stock turnover rate of 3.5, while top-performing retailers achieve a rate of 5 or higher. By focusing on these strategies, retailers can optimize their operations, enhance the customer experience, and ultimately drive growth in the consumer stationery market.
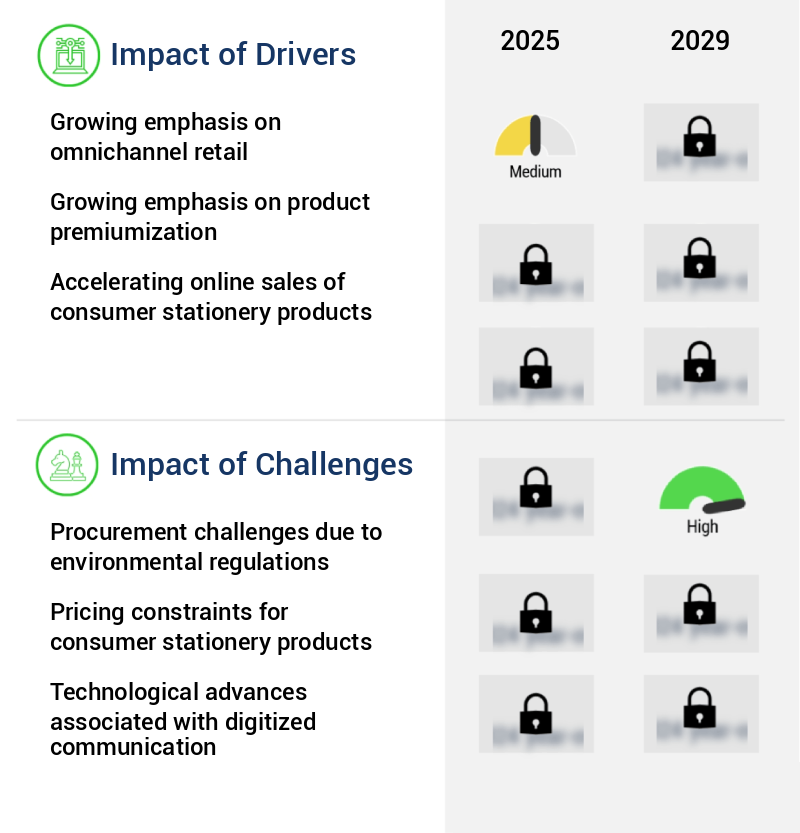
What are the key market drivers leading to the rise in the adoption of Consumer Stationery Retailing Industry?
- The increasing importance of omnichannel retailing serves as the primary catalyst for market growth. This trend reflects consumers' increasing preference for seamless shopping experiences that integrate multiple channels, including brick-and-mortar stores, e-commerce platforms, and mobile applications. Retailers who successfully implement omnichannel strategies are better positioned to meet the evolving demands of today's customers and remain competitive in the industry.
- Consumer stationery retailing is a dynamic and evolving market, with retailers increasingly adopting omnichannel strategies to cater to the diverse needs of consumers. Retailers such as Staples and ODP Corp. Offer a wide selection of stationery products through both brick-and-mortar stores and online platforms. This approach allows consumers to shop conveniently, whether they prefer the tactile experience of browsing in-store or the ease of online product comparison. The growing adoption of Internet-enabled mobile devices in major markets like the US, China, and India has significantly influenced consumer behavior in the stationery retail sector. Online retail platforms have gained popularity due to their convenience and the ability to offer a vast inventory of stationery products.
- According to recent market research, online retail sales of consumer stationery products in the US alone are projected to reach USD3.5 billion by 2025, representing a substantial increase from the USD2.6 billion recorded in 2020. The shift toward online retail is not limited to developed markets. In emerging economies like China and India, the convenience and accessibility offered by online retail platforms have led to a significant increase in consumer adoption. For instance, online sales of consumer stationery products in China are expected to grow at a compounding rate, surpassing USD10 billion by 2025.
- These trends highlight the continuous evolution of the market and the growing importance of online retail channels in meeting the demands of modern consumers.
What are the market trends shaping the Consumer Stationery Retailing Industry?
- The rising popularity of fashion stationery represents an emerging market trend. Fashion stationery, a niche sector within the stationery industry, is experiencing significant growth in demand.
- Consumer stationery retailing has experienced significant evolution in recent times, with a growing emphasis on design and aesthetics in addition to functionality. This shift is evident in the increasing popularity of fashion-inspired stationery products. For instance, Pilot Corporation's G2 range of premium gel roller pens comes in various colors and designs, catering to consumers' desire for stylish writing instruments. Retailers like Theo Paphitis Retail Group have responded to this trend by offering a diverse selection of fashionable stationery items, including fountain pens, unique pencil designs, and chic notebooks, both online and offline. Innovations in product design and features contribute to the premium pricing of these stationery items.
- Manufacturers invest in advanced printing technologies to create visually appealing products that cater to consumers' preferences. This focus on design and aesthetics sets consumer stationery apart from traditional, functional stationery, making it a desirable and competitive market segment. Retailers, in turn, capitalize on this trend by providing a wide range of fashionable stationery options to cater to diverse consumer preferences. The ongoing competition in the market drives continuous innovation and growth, as manufacturers and retailers strive to offer unique and appealing products to consumers. This dynamic market environment ensures a steady flow of new and exciting stationery products, making consumer stationery retailing an ever-evolving and engaging industry.
What challenges does the Consumer Stationery Retailing Industry face during its growth?
- One significant challenge to industry growth stems from the complexities and mandates of environmental regulations in procurement processes.
- The market is undergoing significant shifts due to increasing environmental concerns and regulatory pressures. The production costs of traditional stationery items, including notebooks and pencils, have risen as a result of the rising prices of raw materials, particularly paper pulp. The global paper pulp market has seen a steady increase over the last two years, influenced by factors such as deforestation, pollution, and environmental degradation. Moreover, the use of non-biodegradable materials like plastic and fiber in stationery production has come under scrutiny. Countries such as the US and the UK have implemented stringent regulations to control the usage and recycling of paper and plastic products.
- These regulations have increased compliance costs for manufacturers and retailers, affecting the market. To mitigate these challenges, there is a growing trend towards the production and retailing of eco-friendly stationery products. Biodegradable materials like recycled paper and bamboo are gaining popularity as alternatives to traditional paper and plastic. This shift towards sustainability is not only environmentally friendly but also offers cost savings in the long run. In conclusion, the market is evolving to meet the demands of eco-conscious consumers and regulatory requirements. The increasing prices of raw materials, particularly paper pulp, and the adoption of stringent regulations are driving the market towards sustainable alternatives.
- The use of biodegradable materials like recycled paper and bamboo is expected to become more prevalent in the coming years.
Exclusive Customer Landscape
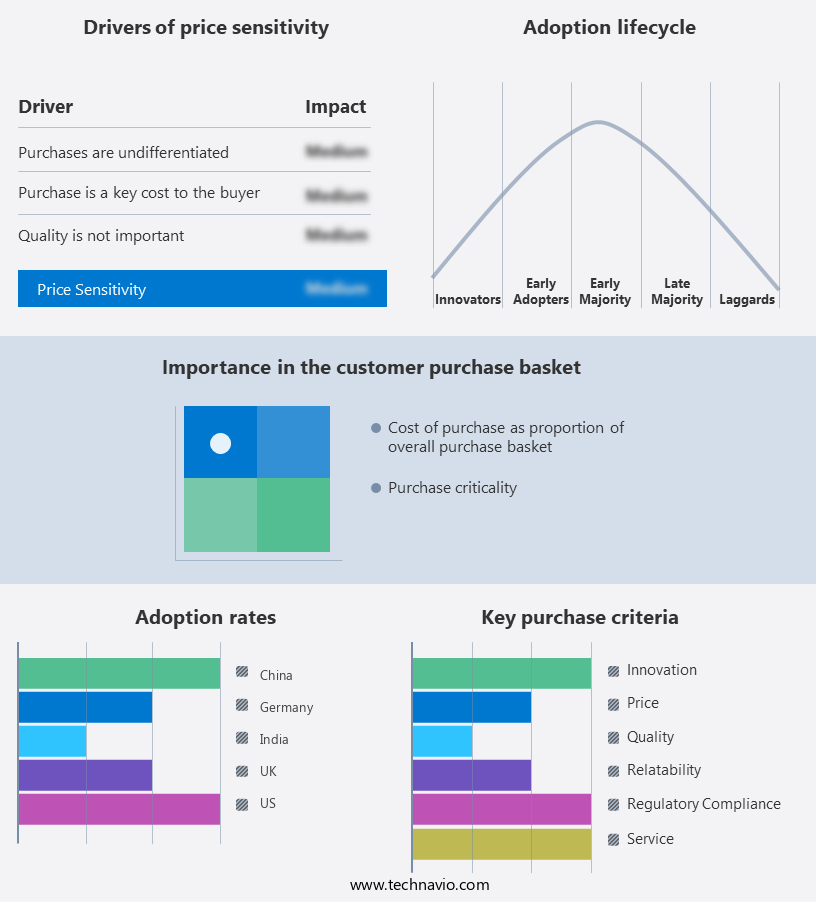
The consumer stationery retailing market forecasting report includes the adoption lifecycle of the market, covering from the innovator’s stage to the laggard’s stage. It focuses on adoption rates in different regions based on penetration. Furthermore, the consumer stationery retailing market report also includes key purchase criteria and drivers of price sensitivity to help companies evaluate and develop their market growth analysis strategies.
Customer Landscape of Consumer Stationery Retailing Industry
Key Companies & Market Insights
Companies are implementing various strategies, such as strategic alliances, consumer stationery retailing market forecast, partnerships, mergers and acquisitions, geographical expansion, and product/service launches, to enhance their presence in the industry.
AEON CO. LTD. - This company specializes in retailing consumer stationery items, including notebooks, ballpoint pens, and desk organizers, catering to the demands of various consumers worldwide. With a focus on product quality and innovation, the company maintains a strong market presence in the global stationery industry.
The industry research and growth report includes detailed analyses of the competitive landscape of the market and information about key companies, including:
- AEON CO. LTD.
- Alibaba Group Holding Ltd.
- Amazon.com Inc.
- Avenue Supermarts Ltd.
- Best Buy Co. Inc.
- Cencosud
- Coop Genossenschaft
- Reliance Retail Ltd.
- Skyblue Stationery Mart
- Staples Inc.
- StationeryBazaar.com
- Target Corp.
- Tesco Plc
- The Kroger Co.
- The ODP Corp.
- Theo Paphitis Retail Group
- Walmart Inc.
- WH Smith PLC
Qualitative and quantitative analysis of companies has been conducted to help clients understand the wider business environment as well as the strengths and weaknesses of key industry players. Data is qualitatively analyzed to categorize companies as pure play, category-focused, industry-focused, and diversified; it is quantitatively analyzed to categorize companies as dominant, leading, strong, tentative, and weak.
Recent Development and News in Consumer Stationery Retailing Market
- In January 2024, Office Depot, a leading retailer in the consumer stationery market, announced the launch of its new "GreenWorks" line of eco-friendly office and school supplies. The product range includes recycled paper notebooks, refillable pens, and biodegradable binders (Office Depot Press Release).
- In March 2024, Staples, another major player in the market, entered into a strategic partnership with Microsoft to offer Microsoft 365 subscriptions in-store and online. This collaboration aimed to expand Staples' digital offerings and enhance its position in the evolving digital workspace market (Staples Press Release).
- In May 2024, Smart Office Supply Co., a mid-sized player in the market, completed a Series B funding round, raising USD15 million to expand its operations and invest in technology. The company plans to use the funds to develop a mobile app and improve its online presence (Smart Office Supply Co. SEC Filing).
- In April 2025, the European Union passed a new regulation requiring all stationery retailers to provide clear labeling and information on the environmental impact of their products. This initiative aims to help consumers make informed decisions and encourage companies to adopt more sustainable practices (European Union Press Release).
Research Analyst Overview
- The market is a dynamic and intricate business landscape that requires continuous analysis and optimization to cater to diverse customer segments and maintain operational efficiency. Customer segmentation analysis plays a crucial role in understanding the unique needs and preferences of various demographics, enabling retailers to tailor their offerings and marketing strategies accordingly. Inventory turnover rate is another essential metric for stationery retailers, as it measures the number of times stock is sold and replaced within a given period. A high inventory turnover rate indicates efficient stock management and responsiveness to customer demand. For instance, a retailer with an inventory turnover rate of 6 times per year would sell and replace their stock six times within the year.
- In-store analytics, powered by automated replenishment systems and real-time data, enable retailers to optimize their store layouts and product placement based on sales trends and customer behavior. Sales forecasting models, driven by historical sales data and external factors, help retailers anticipate demand and maintain optimal stock levels. Supply chain optimization and sales associate training are critical components of a successful stationery retailing business. Efficient supply chain management ensures timely delivery of products and reduces the risk of stockouts. Sales associate training, focused on product knowledge and customer service skills, enhances the shopping experience and fosters customer loyalty.
- The market is projected to grow at a steady pace, with industry analysts estimating a growth rate of 3% annually. Retailers that effectively leverage customer segmentation analysis, inventory turnover rate, in-store analytics, automated replenishment systems, store layout optimization, sales forecasting models, supply chain optimization, and sales associate training will be well-positioned to thrive in this competitive landscape.
Dive into Technavio’s robust research methodology, blending expert interviews, extensive data synthesis, and validated models for unparalleled Consumer Stationery Retailing Market insights. See full methodology.
|
Market Scope |
|
|
Report Coverage |
Details |
|
Page number |
223 |
|
Base year |
2024 |
|
Historic period |
2019-2023 |
|
Forecast period |
2025-2029 |
|
Growth momentum & CAGR |
Accelerate at a CAGR of 2.8% |
|
Market growth 2025-2029 |
USD 8372.6 million |
|
Market structure |
Fragmented |
|
YoY growth 2024-2025(%) |
2.7 |
|
Key countries |
US, China, India, Japan, Canada, Germany, UK, Australia, France, and Italy |
|
Competitive landscape |
Leading Companies, Market Positioning of Companies, Competitive Strategies, and Industry Risks |
What are the Key Data Covered in this Consumer Stationery Retailing Market Research and Growth Report?
- CAGR of the Consumer Stationery Retailing industry during the forecast period
- Detailed information on factors that will drive the growth and forecasting between 2025 and 2029
- Precise estimation of the size of the market and its contribution of the industry in focus to the parent market
- Accurate predictions about upcoming growth and trends and changes in consumer behaviour
- Growth of the market across APAC, North America, Europe, South America, and Middle East and Africa
- Thorough analysis of the market’s competitive landscape and detailed information about companies
- Comprehensive analysis of factors that will challenge the consumer stationery retailing market growth of industry companies
We can help! Our analysts can customize this consumer stationery retailing market research report to meet your requirements.
 RIA -
RIA - 
