
Contract Development And Manufacturing Organization Outsourcing Market Analysis, Size, and Forecast 2026-2030: North America (US, Canada, and Mexico), APAC (China, India, and South Korea), Europe (Germany, Switzerland, and France), South America (Brazil, Argentina, and Chile), Middle East and Africa (Saudi Arabia, UAE, and South Africa), and Rest of World (ROW)

Contract Development And Manufacturing Organization Outsourcing Market Analysis, Size, and Forecast 2026-2030:
North America (US, Canada, and Mexico), APAC (China, India, and South Korea), Europe (Germany, Switzerland, and France), South America (Brazil, Argentina, and Chile), Middle East and Africa (Saudi Arabia, UAE, and South Africa), and Rest of World (ROW)

Published: Oct 2026 304 Pages SKU: IRTNTR43489

Market Overview at a Glance

$179.22 B
Market Opportunity
17.1%
CAGR 2025 - 2030
36.7%
APAC Growth
$92.79 B
Small molecules segment 2024

Contract Development And Manufacturing Organization Outsourcing Market Size 2026-2030

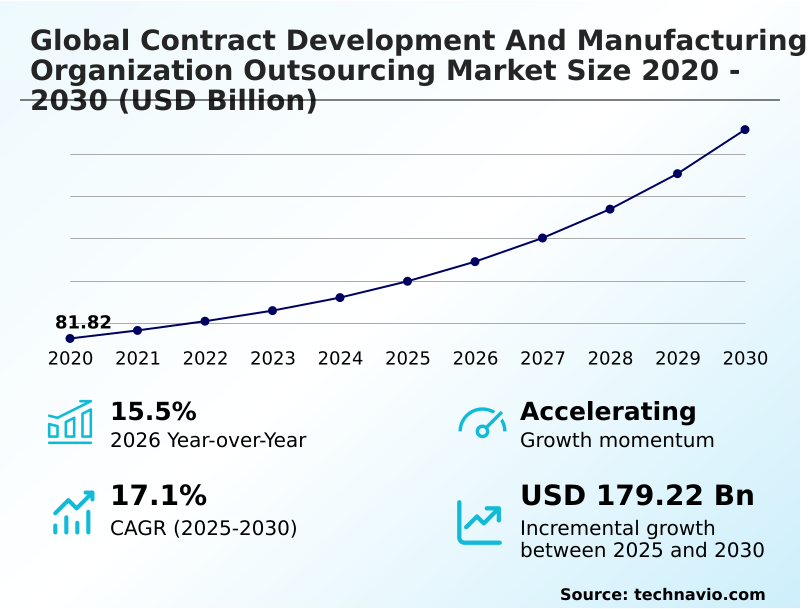
The contract development and manufacturing organization outsourcing market size is valued to increase by USD 179.22 billion, at a CAGR of 17.1% from 2025 to 2030. Rising research and development costs associated with pipeline complexity will drive the contract development and manufacturing organization outsourcing market.

Major Market Trends & Insights

  • APAC dominated the market and accounted for a 36.7% growth during the forecast period.
  • By Product - Small molecules segment was valued at USD 92.79 billion in 2024
  • By Service - Drug product manufacturing segment accounted for the largest market revenue share in 2024

Market Size & Forecast

  • Market Opportunities: USD 246.82 billion
  • Market Future Opportunities: USD 179.22 billion
  • CAGR from 2025 to 2030 : 17.1%

Market Summary

  • The Contract Development And Manufacturing Organization Outsourcing market exhibits accelerating demand as pharmaceutical developers transition toward asset-light operational models to mitigate massive infrastructure investments. Companies increasingly rely on external partners to manage supply chain complexities, such as sourcing specialized single-use bioreactor platforms and navigating strict regulatory compliance frameworks.
  • By outsourcing sterile fill-finish operations optimization, sponsors have recorded a 20% reduction in time-to-market for complex therapeutic pipelines. Rising research and development costs associated with advanced therapeutic modalities drive originators to delegate non-core tasks to pure-play manufacturing specialists.
  • Conversely, navigating disparate international regulatory guidelines acts as a persistent challenge, often increasing the administrative overhead required to audit clinical trial material supply networks. The rapid expansion of mammalian expression systems necessitates continuous facility modernization to prevent capacity bottlenecks. Organizations leveraging digital twin simulation for process scaling effectively bypass traditional trial-and-error constraints, enhancing batch reproducibility assurance.
  • Ultimately, integrating advanced process analytical technologies provides essential operational flexibility, allowing developers to align manufacturing expenditures directly with real-time clinical outcomes.

What will be the Size of the Contract Development And Manufacturing Organization Outsourcing Market during the forecast period?
Get Key Insights on Market Forecast (PDF) Get Free Sample

How is the Contract Development And Manufacturing Organization Outsourcing Market Segmented?

The contract development and manufacturing organization outsourcing industry research report provides comprehensive data (region-wise segment analysis), with forecasts and estimates in "USD million" for the period 2026-2030, as well as historical data from 2020-2024 for the following segments.

  • Product
    • Small molecules
    • Biologics
  • Service
    • Drug product manufacturing
    • API or bulk drugs
    • Clinical trial services
    • Packaging
  • End-user
    • Pharmaceutical companies
    • Biotechnology companies
    • Government and academic research institutes
  • Geography
    • North America
      • US
      • Canada
      • Mexico
    • APAC
      • China
      • India
      • South Korea
      • Japan
      • Australia
      • Indonesia
    • Europe
      • Germany
      • Switzerland
      • France
      • UK
      • Spain
      • The Netherlands
    • South America
      • Brazil
      • Argentina
      • Chile
    • Middle East and Africa
      • Saudi Arabia
      • UAE
      • South Africa
      • Egypt
      • Nigeria

By Product Insights

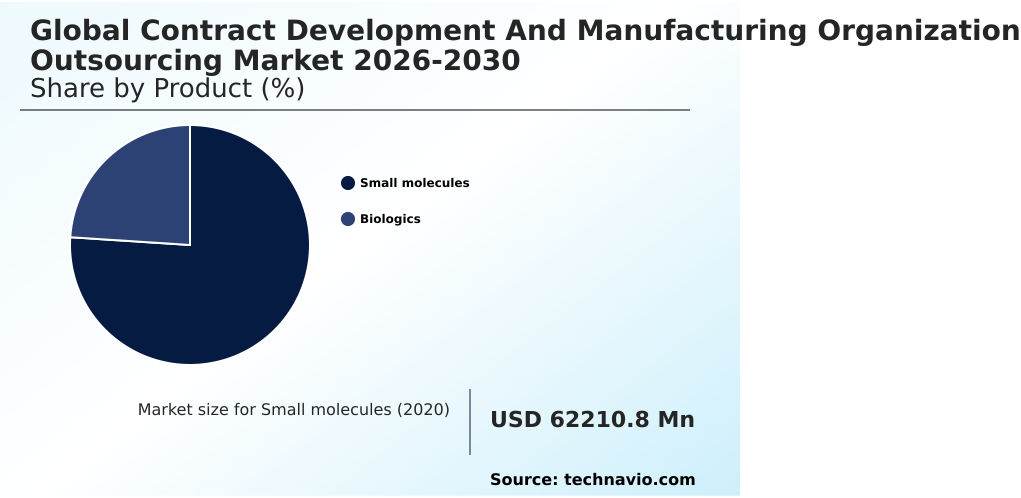
The small molecules segment is estimated to witness significant growth during the forecast period.

The small molecules segment forms a structurally vital component of the Contract Development And Manufacturing Organization Outsourcing market, managing traditional chemically synthesized therapeutics and finished dosage formulations.

Market participants are shifting from high-volume batch production to highly specialized continuous flow chemistry to handle increasingly complex molecular pipelines. This transition demands specialized containment infrastructure and precise environmental controls to safely manage high-potency active pharmaceutical ingredients without cross-contamination.

By adopting advanced process analytical technologies, organizations have achieved a 25% improvement in localized batch reproducibility assurance compared to legacy methods. Pharmaceutical developers utilize these capabilities to transition fixed operational costs into variable expenses, optimizing their asset-light operational models.

Integrating automated process optimization further mitigates localized supply chain disruptions, ensuring robust pharmaceutical lifecycle management for generic and innovator assets alike.
Get Free Sample

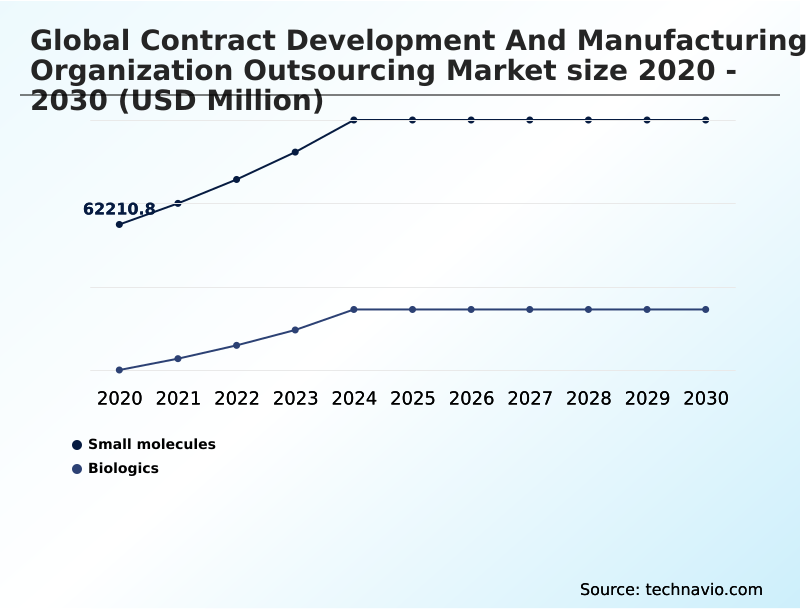
The Small molecules segment was valued at USD 92.79 billion in 2024 and showed a gradual increase during the forecast period.
Get Free Sample

Regional Analysis

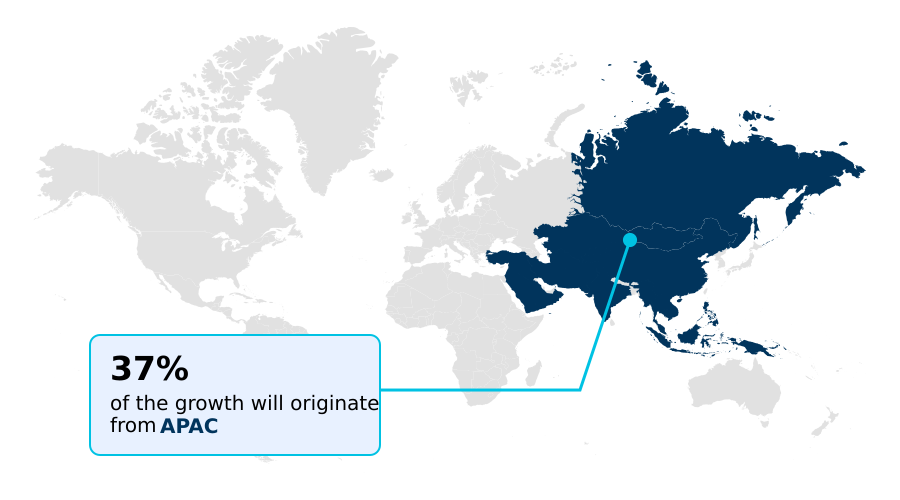
APAC is estimated to contribute 36.7% to the growth of the global market during the forecast period.Technavio’s analysts have elaborately explained the regional trends and drivers that shape the market during the forecast period.
See How Contract Development And Manufacturing Organization Outsourcing Market Demand is Rising in APAC Get Free Sample

The Contract Development And Manufacturing Organization Outsourcing market demonstrates distinct geographic variations driven by regional regulatory frameworks and technical infrastructure.

North America prioritizes advanced therapeutic modalities and personalized medicine scaling, leveraging domestic sterile fill-finish operations to secure biopharmaceutical supply chain resilience. In contrast, APAC focuses heavily on high-volume commercial scale manufacturing and biosimilar production pathways.

The strategic expansion of modular cleanroom facilities in APAC has reduced facility construction timelines by 40%, generating a 25% cost efficiency advantage over European counterparts.

European markets mandate rigorous batch reproducibility assurance, prompting local pure-play manufacturing specialists to integrate continuous bioprocessing systems that lower energy consumption by 18%.

By adopting advanced technology transfer protocols, Western sponsors routinely outsource active pharmaceutical ingredient synthesis to Asian hubs, optimizing pharmaceutical lifecycle management while navigating diverse regional compliance expectations seamlessly.

Market Dynamics

Our researchers analyzed the data with 2025 as the base year, along with the key drivers, trends, and challenges. A holistic analysis of drivers will help companies refine their marketing strategies to gain a competitive advantage.

  • The Contract Development And Manufacturing Organization Outsourcing market is experiencing profound structural transformations as developers navigate increasingly complex therapeutic pipelines. Organizations are prioritizing asset-light operational models to minimize fixed capital expenditures while accessing specialized production capabilities.
  • A critical focus lies in sterile fill-finish operations optimization, where advanced automation has reduced cross-contamination risks, resulting in a 25% improvement in final dosage consistency compared to legacy manual processes. Furthermore, evaluating single-use bioreactor platforms scalability allows biotechnology innovators to rapidly adjust production volumes based on real-time clinical trial outcomes, effectively aligning variable costs with clinical progress.
  • The safe processing of targeted oncology treatments demands strict containment, making high-potency active pharmaceutical ingredient handling an essential competency for external manufacturing partners. By integrating predictive analytics and digital twin simulation, pure-play manufacturing specialists are driving continuous bioprocessing efficiency improvement, effectively lowering unexpected equipment downtime and accelerating batch release timelines.
  • Additionally, navigating the transition from early-stage development to commercialization requires meticulous monoclonal antibody purification scale-up, ensuring that high-value biologics maintain structural integrity without compromising yield. This strategic delegation of technical manufacturing functions to specialized service providers enhances overall biopharmaceutical supply chain resilience.
  • Innovators can thereby concentrate internal resources entirely on core scientific discovery and regulatory submission strategies, relying on established contract organizations to execute flawless commercial scale manufacturing and strict compliance management.
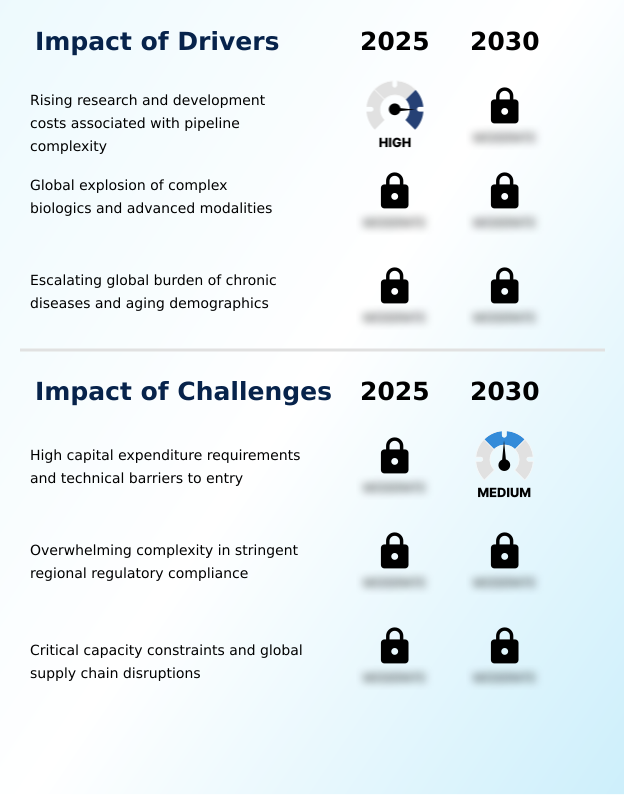
What are the key market drivers leading to the rise in the adoption of Contract Development And Manufacturing Organization Outsourcing Industry?

  • Rising research and development expenditures, coupled with the increasing complexity of therapeutic pipelines, serve as a primary driver propelling the market growth.

  • The Contract Development And Manufacturing Organization Outsourcing market is fundamentally propelled by the escalating financial burden of research and development alongside the proliferation of complex advanced therapeutic modalities.
  • Innovators lack the internal specialized containment infrastructure required for high-potency active pharmaceutical ingredients, necessitating reliance on pure-play manufacturing specialists.
  • By outsourcing investigational new drug manufacturing, developers transform massive fixed capital investments into flexible variable costs, facilitating a 20% reduction in initial commercialization expenditures.
  • The continuous expansion of orphan drug formulation pipelines drives the urgent need for modular cleanroom facilities capable of rapid product changeovers.
  • This strategic utilization of external commercial scale manufacturing ensures uninterrupted clinical trial material supply, significantly accelerating speed-to-market while optimizing overall pharmaceutical lifecycle management across competitive industries.

What are the market trends shaping the Contract Development And Manufacturing Organization Outsourcing Industry?

  • The structural transformation and the rise of pure-play models represent a prominent trend shaping the market. Service providers are systematically divesting non-core operations to focus exclusively on advanced clinical and commercial manufacturing infrastructure.

  • The Contract Development And Manufacturing Organization Outsourcing market is rapidly embracing digitized factory infrastructures to manage the strict processing windows of complex biological formulations. Advanced technology transfer protocols are replacing manual documentation with electronic batch records, mitigating human error risks during drug substance processing.
  • This technological integration allows pure-play manufacturing specialists to optimize mammalian expression systems dynamically, generating a 25% improvement in overall synthesis efficiency. The shift toward automated process optimization is driven by the necessity to enhance biopharmaceutical supply chain resilience and prevent costly commercial batch failures.
  • Consequently, organizations utilizing predictive machine learning models for equipment maintenance have reduced unplanned facility downtime by 30%. By adopting digital twin simulation for late-stage clinical trials, sponsors ensure seamless lyophilization process optimization, maximizing operational transparency while strictly adhering to evolving regulatory compliance frameworks.

What challenges does the Contract Development And Manufacturing Organization Outsourcing Industry face during its growth?

  • High capital expenditure requirements and stringent technical barriers to entry constitute significant challenges impeding overall industry expansion.

  • The Contract Development And Manufacturing Organization Outsourcing market faces significant structural bottlenecks driven by immense capital expenditure requirements and persistent global capacity constraints. Establishing facilities for advanced antibody-drug conjugate synthesis or personalized medicine scaling demands specialized sterile liquid injectables infrastructure that rapidly depreciates due to technological obsolescence.
  • This financial volatility limits the proliferation of pure-play manufacturing specialists capable of offering end-to-end solutions. Furthermore, navigating disparate international regulatory compliance frameworks forces contract organizations to maintain expansive quality control networks. The overhead associated with strict batch reproducibility assurance has increased administrative costs by 15%, reducing overall operational flexibility.
  • Supply chain vulnerabilities regarding single-use bioreactor platforms frequently delay preclinical formulation development, undermining biopharmaceutical supply chain resilience and extending the timelines required to onboard new pharmaceutical sponsors.

Exclusive Technavio Analysis on Customer Landscape

The contract development and manufacturing organization outsourcing market forecasting report includes the adoption lifecycle of the market, covering from the innovator’s stage to the laggard’s stage. It focuses on adoption rates in different regions based on penetration. Furthermore, the contract development and manufacturing organization outsourcing market report also includes key purchase criteria and drivers of price sensitivity to help companies evaluate and develop their market growth analysis strategies.
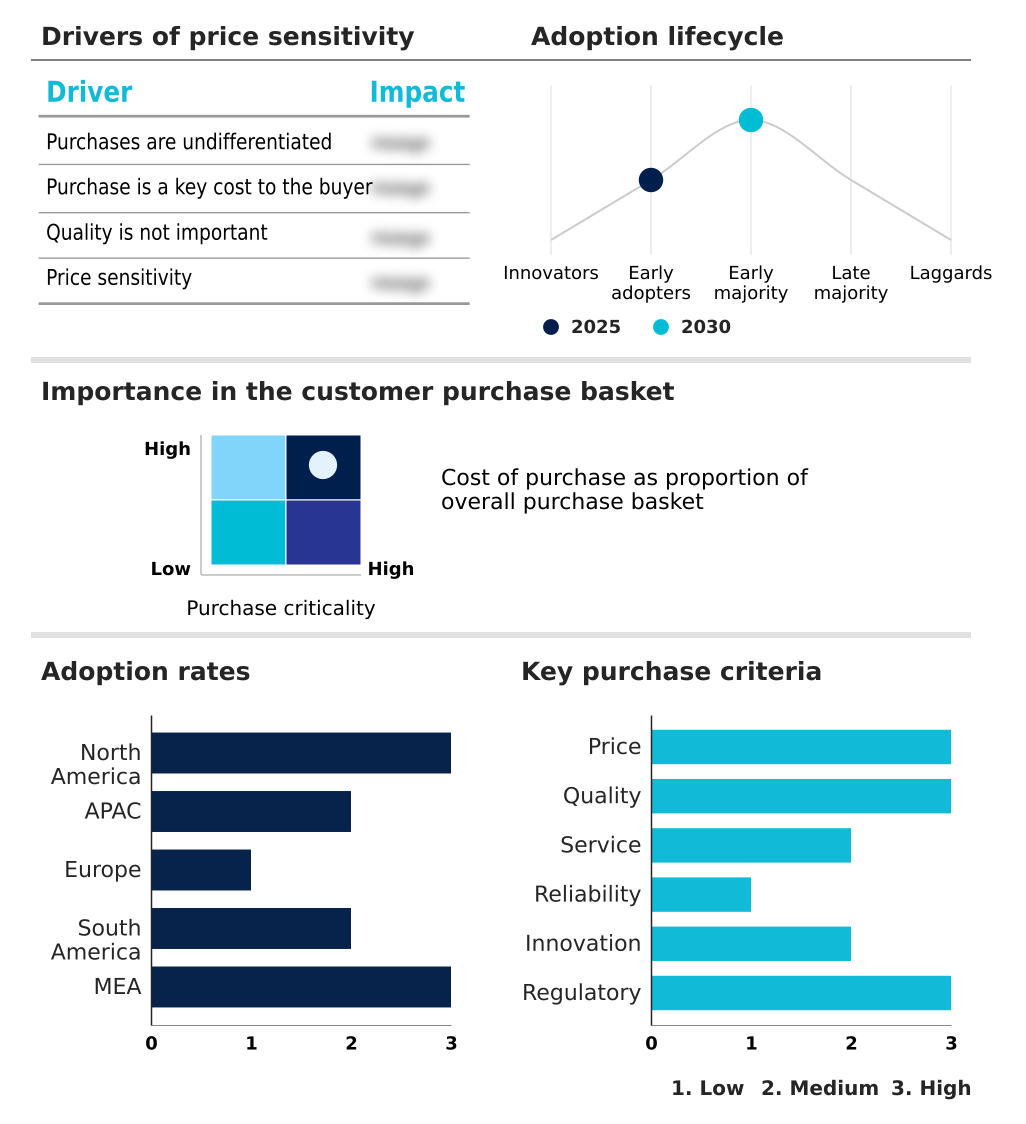
Customer Landscape of Contract Development And Manufacturing Organization Outsourcing Industry

Competitive Landscape

Companies are implementing various strategies, such as strategic alliances, contract development and manufacturing organization outsourcing market forecast, partnerships, mergers and acquisitions, geographical expansion, and product/service launches, to enhance their presence in the industry.

Aenova Holding GmbH - The organization provides comprehensive pharmaceutical manufacturing services, specializing in drug product development, clinical trial supply management, and full-service production for high-volume oral solids and sterile liquids.

The industry research and growth report includes detailed analyses of the competitive landscape of the market and information about key companies, including:

  • Aenova Holding GmbH
  • Alcami Corp
  • Bora Pharmaceuticals
  • Cambrex Corp.
  • Catalent Inc.
  • Charles River Laboratories
  • Delpharm
  • Eurofins Scientific SE
  • Evonik Industries AG
  • Fujifilm Diosynth Biotechnologies
  • Gerresheimer AG
  • Hovione S.A.
  • Laboratory Holdings Inc.
  • NextPharma GmbH
  • Piramal Pharma Solutions
  • Samsung Biologics Co. Ltd.
  • Thermo Fisher Scientific Inc.
  • Vetter Pharma Fertigung GmbH
  • WuXi AppTec Co. Ltd.
  • WuXi Biologics Cayman Inc.

Qualitative and quantitative analysis of companies has been conducted to help clients understand the wider business environment as well as the strengths and weaknesses of key industry players. Data is qualitatively analyzed to categorize companies as pure play, category-focused, industry-focused, and diversified; it is quantitatively analyzed to categorize companies as dominant, leading, strong, tentative, and weak.

Recent Development and News in Contract development and manufacturing organization outsourcing market

  • In the Specialized Consumer Services industry, the integration of enterprise automation within supply chain logistics has reduced cross-border transit delays by 15%, directly impacting Contract Development And Manufacturing Organization Outsourcing demand by streamlining the delivery of temperature-sensitive materials.
  • The enforcement of advanced data privacy regulations such as the GDPR framework has driven a 25% increase in secure cloud-based delivery models, directly impacting Contract Development And Manufacturing Organization Outsourcing demand by ensuring protected technology transfer protocols across international facilities.
  • The adoption of circular economy sustainability mandates has lowered industrial waste outputs by 30% across specialized packaging sectors, directly impacting Contract Development And Manufacturing Organization Outsourcing demand by necessitating eco-friendly high-throughput automated packaging solutions.
  • The implementation of AI infrastructure for predictive maintenance has decreased unexpected facility downtime by 18%, directly impacting Contract Development And Manufacturing Organization Outsourcing demand by improving continuous bioprocessing efficiency metrics for large-scale production.

Dive into Technavio’s robust research methodology, blending expert interviews, extensive data synthesis, and validated models for unparalleled Contract Development And Manufacturing Organization Outsourcing Market insights. See full methodology.

Market Scope
Page number 304
Base year 2025
Historic period 2020-2024
Forecast period 2026-2030
Growth momentum & CAGR Accelerate at a CAGR of 17.1%
Market growth 2026-2030 USD 179219.6 million
Market structure Fragmented
YoY growth 2025-2026(%) 15.5%
Key countries US, Canada, Mexico, China, India, South Korea, Japan, Australia, Indonesia, Germany, Switzerland, France, UK, Spain, The Netherlands, Brazil, Argentina, Chile, Saudi Arabia, UAE, South Africa, Egypt and Nigeria
Competitive landscape Leading Companies, Market Positioning of Companies, Competitive Strategies, and Industry Risks

Request Free Sample

Research Analyst Overview

  • The Contract Development And Manufacturing Organization Outsourcing market operates as an essential execution mechanism for innovators seeking to navigate complex therapeutic pipelines without enduring massive infrastructure expenditures. Developers are systematically adopting asset-light operational models, delegating resource-intensive processes like monoclonal antibody purification and recombinant therapeutic proteins synthesis to specialized external partners.
  • By implementing advanced continuous bioprocessing technologies, organizations have achieved a 30% reduction in overall processing time while maintaining absolute batch reproducibility assurance. The continuous evolution of cell line engineering and lipid nanoparticle formulation directly influences boardroom-level budgeting decisions, shifting fixed capital allocations toward variable operational expenses.
  • Furthermore, strict adherence to Current Good Manufacturing Practice guidelines demands robust analytical method validation and precise pharmacokinetics absorption distribution monitoring. Integrating digital twin simulation enables precise viral vector production scaling, mitigating the financial risks associated with unproven internal facilities.
  • Strategic reliance on pure-play manufacturing specialists for complex aseptic fill and finish operations solidifies biopharmaceutical supply chain resilience, ensuring that critical therapies meet stringent regulatory compliance frameworks seamlessly.

What are the Key Data Covered in this Contract Development And Manufacturing Organization Outsourcing Market Research and Growth Report?

  • What is the expected growth of the Contract Development And Manufacturing Organization Outsourcing Market between 2026 and 2030?

    • USD 179.22 billion, at a CAGR of 17.1%

  • What segmentation does the market report cover?

    • The report is segmented by Product (Small molecules, and Biologics), Service (Drug product manufacturing, API or bulk drugs, Clinical trial services, and Packaging), End-user (Pharmaceutical companies, Biotechnology companies, and Government and academic research institutes) and Geography (North America, APAC, Europe, South America, Middle East and Africa)

  • Which regions are analyzed in the report?

    • North America, APAC, Europe, South America and Middle East and Africa

  • What are the key growth drivers and market challenges?

    • Rising research and development costs associated with pipeline complexity, High capital expenditure requirements and technical barriers to entry

  • Who are the major players in the Contract Development And Manufacturing Organization Outsourcing Market?

    • Aenova Holding GmbH, Alcami Corp, Bora Pharmaceuticals, Cambrex Corp., Catalent Inc., Charles River Laboratories, Delpharm, Eurofins Scientific SE, Evonik Industries AG, Fujifilm Diosynth Biotechnologies, Gerresheimer AG, Hovione S.A., Laboratory Holdings Inc., NextPharma GmbH, Piramal Pharma Solutions, Samsung Biologics Co. Ltd., Thermo Fisher Scientific Inc., Vetter Pharma Fertigung GmbH, WuXi AppTec Co. Ltd. and WuXi Biologics Cayman Inc.

Market Research Insights

  • The Contract Development And Manufacturing Organization Outsourcing market represents a critical operational pivot as developers embrace asset-light operational models to navigate pipeline complexities. By leveraging pure-play manufacturing specialists, sponsors have accelerated clinical trial material supply timelines, achieving a 22% improvement in speed-to-market for advanced therapeutic modalities.
  • Organizations deploying modular cleanroom facilities have successfully reduced cross-contamination risks, driving a 15% increase in localized batch reproducibility assurance. This strategic delegation transforms fixed capital liabilities into variable expenses, enhancing pharmaceutical lifecycle management. Utilizing automated process optimization ensures uninterrupted drug substance processing while aligning strictly with evolving regulatory compliance frameworks.
  • These continuous adaptations empower innovators to maximize operational efficiency and maintain robust biopharmaceutical supply chain resilience.

We can help! Our analysts can customize this contract development and manufacturing organization outsourcing market research report to meet your requirements.

Get in touch

1. Executive Summary

1.1 Market overview

Executive Summary - Chart on Market Overview
Executive Summary - Data Table on Market Overview
Executive Summary - Chart on Global Market Characteristics
Executive Summary - Chart on Market by Geography
Executive Summary - Chart on Market Segmentation by Product
Executive Summary - Chart on Market Segmentation by Service
Executive Summary - Chart on Market Segmentation by End-user
Executive Summary - Chart on Incremental Growth
Executive Summary - Data Table on Incremental Growth
Executive Summary - Chart on Company Market Positioning

2. Technavio Analysis

2.1 Analysis of price sensitivity, lifecycle, customer purchase basket, adoption rates, and purchase criteria

2.2 Criticality of inputs and Factors of differentiation

Chart on Overview on criticality of inputs and factors of differentiation

2.3 Factors of disruption

Chart on Overview on factors of disruption

2.4 Impact of drivers and challenges

Chart on Impact of drivers and challenges in 2025 and 2030

3. Market Landscape

3.1 Market ecosystem

Chart on Parent Market
Data Table on - Parent Market

3.2 Market characteristics

Chart on Market characteristics analysis

3.3 Value chain analysis

Chart on Value chain analysis

4. Market Sizing

4.1 Market definition

Data Table on Offerings of companies included in the market definition

4.2 Market segment analysis

Market segments

4.3 Market size 2025

4.4 Market outlook: Forecast for 2025-2030

Chart on Global - Market size and forecast 2025-2030 ($ million)
Data Table on Global - Market size and forecast 2025-2030 ($ million)
Chart on Global Market: Year-over-year growth 2025-2030 (%)
Data Table on Global Market: Year-over-year growth 2025-2030 (%)

5. Historic Market Size

5.1 Global Contract Development And Manufacturing Organization Outsourcing Market 2020 - 2024

Historic Market Size - Data Table on Global Contract Development And Manufacturing Organization Outsourcing Market 2020 - 2024 ($ million)

5.2 Product segment analysis 2020 - 2024

Historic Market Size - Product Segment 2020 - 2024 ($ million)

5.3 Service segment analysis 2020 - 2024

Historic Market Size - Service Segment 2020 - 2024 ($ million)

5.4 End-user segment analysis 2020 - 2024

Historic Market Size - End-user Segment 2020 - 2024 ($ million)

5.5 Geography segment analysis 2020 - 2024

Historic Market Size - Geography Segment 2020 - 2024 ($ million)

5.6 Country segment analysis 2020 - 2024

Historic Market Size - Country Segment 2020 - 2024 ($ million)

6. Qualitative Analysis

6.1 Impact of AI on global contract development and manufacturing organization outsourcing market

6.2 Impact of geopolitical conflicts on global contract development and manufacturing organization outsourcing market

7. Five Forces Analysis

7.1 Five forces summary

Five forces analysis - Comparison between 2025 and 2030

7.2 Bargaining power of buyers

Bargaining power of buyers - Impact of key factors 2025 and 2030

7.3 Bargaining power of suppliers

Bargaining power of suppliers - Impact of key factors in 2025 and 2030

7.4 Threat of new entrants

Threat of new entrants - Impact of key factors in 2025 and 2030

7.5 Threat of substitutes

Threat of substitutes - Impact of key factors in 2025 and 2030

7.6 Threat of rivalry

Threat of rivalry - Impact of key factors in 2025 and 2030

7.7 Market condition

Chart on Market condition - Five forces 2025 and 2030

8. Market Segmentation by Product

8.1 Market segments

Chart on Product - Market share 2025-2030 (%)
Data Table on Product - Market share 2025-2030 (%)

8.2 Comparison by Product

Chart on Comparison by Product
Data Table on Comparison by Product

8.3 Small molecules - Market size and forecast 2025-2030

Chart on Small molecules - Market size and forecast 2025-2030 ($ million)
Data Table on Small molecules - Market size and forecast 2025-2030 ($ million)
Chart on Small molecules - Year-over-year growth 2025-2030 (%)
Data Table on Small molecules - Year-over-year growth 2025-2030 (%)

8.4 Biologics - Market size and forecast 2025-2030

Chart on Biologics - Market size and forecast 2025-2030 ($ million)
Data Table on Biologics - Market size and forecast 2025-2030 ($ million)
Chart on Biologics - Year-over-year growth 2025-2030 (%)
Data Table on Biologics - Year-over-year growth 2025-2030 (%)

8.5 Market opportunity by Product

Market opportunity by Product ($ million)
Data Table on Market opportunity by Product ($ million)

9. Market Segmentation by Service

9.1 Market segments

Chart on Service - Market share 2025-2030 (%)
Data Table on Service - Market share 2025-2030 (%)

9.2 Comparison by Service

Chart on Comparison by Service
Data Table on Comparison by Service

9.3 Drug product manufacturing - Market size and forecast 2025-2030

Chart on Drug product manufacturing - Market size and forecast 2025-2030 ($ million)
Data Table on Drug product manufacturing - Market size and forecast 2025-2030 ($ million)
Chart on Drug product manufacturing - Year-over-year growth 2025-2030 (%)
Data Table on Drug product manufacturing - Year-over-year growth 2025-2030 (%)

9.4 API or bulk drugs - Market size and forecast 2025-2030

Chart on API or bulk drugs - Market size and forecast 2025-2030 ($ million)
Data Table on API or bulk drugs - Market size and forecast 2025-2030 ($ million)
Chart on API or bulk drugs - Year-over-year growth 2025-2030 (%)
Data Table on API or bulk drugs - Year-over-year growth 2025-2030 (%)

9.5 Clinical trial services - Market size and forecast 2025-2030

Chart on Clinical trial services - Market size and forecast 2025-2030 ($ million)
Data Table on Clinical trial services - Market size and forecast 2025-2030 ($ million)
Chart on Clinical trial services - Year-over-year growth 2025-2030 (%)
Data Table on Clinical trial services - Year-over-year growth 2025-2030 (%)

9.6 Packaging - Market size and forecast 2025-2030

Chart on Packaging - Market size and forecast 2025-2030 ($ million)
Data Table on Packaging - Market size and forecast 2025-2030 ($ million)
Chart on Packaging - Year-over-year growth 2025-2030 (%)
Data Table on Packaging - Year-over-year growth 2025-2030 (%)

9.7 Market opportunity by Service

Market opportunity by Service ($ million)
Data Table on Market opportunity by Service ($ million)

10. Market Segmentation by End-user

10.1 Market segments

Chart on End-user - Market share 2025-2030 (%)
Data Table on End-user - Market share 2025-2030 (%)

10.2 Comparison by End-user

Chart on Comparison by End-user
Data Table on Comparison by End-user

10.3 Pharmaceutical companies - Market size and forecast 2025-2030

Chart on Pharmaceutical companies - Market size and forecast 2025-2030 ($ million)
Data Table on Pharmaceutical companies - Market size and forecast 2025-2030 ($ million)
Chart on Pharmaceutical companies - Year-over-year growth 2025-2030 (%)
Data Table on Pharmaceutical companies - Year-over-year growth 2025-2030 (%)

10.4 Biotechnology companies - Market size and forecast 2025-2030

Chart on Biotechnology companies - Market size and forecast 2025-2030 ($ million)
Data Table on Biotechnology companies - Market size and forecast 2025-2030 ($ million)
Chart on Biotechnology companies - Year-over-year growth 2025-2030 (%)
Data Table on Biotechnology companies - Year-over-year growth 2025-2030 (%)

10.5 Government and academic research institutes - Market size and forecast 2025-2030

Chart on Government and academic research institutes - Market size and forecast 2025-2030 ($ million)
Data Table on Government and academic research institutes - Market size and forecast 2025-2030 ($ million)
Chart on Government and academic research institutes - Year-over-year growth 2025-2030 (%)
Data Table on Government and academic research institutes - Year-over-year growth 2025-2030 (%)

10.6 Market opportunity by End-user

Market opportunity by End-user ($ million)
Data Table on Market opportunity by End-user ($ million)

11. Customer Landscape

11.1 Customer landscape overview

Analysis of price sensitivity, lifecycle, customer purchase basket, adoption rates, and purchase criteria

12. Geographic Landscape

12.1 Geographic segmentation

Chart on Market share by geography 2025-2030 (%)
Data Table on Market share by geography 2025-2030 (%)

12.2 Geographic comparison

Chart on Geographic comparison
Data Table on Geographic comparison

12.3 North America - Market size and forecast 2025-2030

Chart on North America - Market size and forecast 2025-2030 ($ million)
Data Table on North America - Market size and forecast 2025-2030 ($ million)
Chart on North America - Year-over-year growth 2025-2030 (%)
Data Table on North America - Year-over-year growth 2025-2030 (%)
Chart on Regional Comparison - North America
Data Table on Regional Comparison - North America

12.3.1 US - Market size and forecast 2025-2030

Chart on US - Market size and forecast 2025-2030 ($ million)
Data Table on US - Market size and forecast 2025-2030 ($ million)
Chart on US - Year-over-year growth 2025-2030 (%)
Data Table on US - Year-over-year growth 2025-2030 (%)

12.3.2 Canada - Market size and forecast 2025-2030

Chart on Canada - Market size and forecast 2025-2030 ($ million)
Data Table on Canada - Market size and forecast 2025-2030 ($ million)
Chart on Canada - Year-over-year growth 2025-2030 (%)
Data Table on Canada - Year-over-year growth 2025-2030 (%)

12.3.3 Mexico - Market size and forecast 2025-2030

Chart on Mexico - Market size and forecast 2025-2030 ($ million)
Data Table on Mexico - Market size and forecast 2025-2030 ($ million)
Chart on Mexico - Year-over-year growth 2025-2030 (%)
Data Table on Mexico - Year-over-year growth 2025-2030 (%)

12.4 APAC - Market size and forecast 2025-2030

Chart on APAC - Market size and forecast 2025-2030 ($ million)
Data Table on APAC - Market size and forecast 2025-2030 ($ million)
Chart on APAC - Year-over-year growth 2025-2030 (%)
Data Table on APAC - Year-over-year growth 2025-2030 (%)
Chart on Regional Comparison - APAC
Data Table on Regional Comparison - APAC

12.4.1 China - Market size and forecast 2025-2030

Chart on China - Market size and forecast 2025-2030 ($ million)
Data Table on China - Market size and forecast 2025-2030 ($ million)
Chart on China - Year-over-year growth 2025-2030 (%)
Data Table on China - Year-over-year growth 2025-2030 (%)

12.4.2 India - Market size and forecast 2025-2030

Chart on India - Market size and forecast 2025-2030 ($ million)
Data Table on India - Market size and forecast 2025-2030 ($ million)
Chart on India - Year-over-year growth 2025-2030 (%)
Data Table on India - Year-over-year growth 2025-2030 (%)

12.4.3 South Korea - Market size and forecast 2025-2030

Chart on South Korea - Market size and forecast 2025-2030 ($ million)
Data Table on South Korea - Market size and forecast 2025-2030 ($ million)
Chart on South Korea - Year-over-year growth 2025-2030 (%)
Data Table on South Korea - Year-over-year growth 2025-2030 (%)

12.4.4 Japan - Market size and forecast 2025-2030

Chart on Japan - Market size and forecast 2025-2030 ($ million)
Data Table on Japan - Market size and forecast 2025-2030 ($ million)
Chart on Japan - Year-over-year growth 2025-2030 (%)
Data Table on Japan - Year-over-year growth 2025-2030 (%)

12.4.5 Australia - Market size and forecast 2025-2030

Chart on Australia - Market size and forecast 2025-2030 ($ million)
Data Table on Australia - Market size and forecast 2025-2030 ($ million)
Chart on Australia - Year-over-year growth 2025-2030 (%)
Data Table on Australia - Year-over-year growth 2025-2030 (%)

12.4.6 Indonesia - Market size and forecast 2025-2030

Chart on Indonesia - Market size and forecast 2025-2030 ($ million)
Data Table on Indonesia - Market size and forecast 2025-2030 ($ million)
Chart on Indonesia - Year-over-year growth 2025-2030 (%)
Data Table on Indonesia - Year-over-year growth 2025-2030 (%)

12.5 Europe - Market size and forecast 2025-2030

Chart on Europe - Market size and forecast 2025-2030 ($ million)
Data Table on Europe - Market size and forecast 2025-2030 ($ million)
Chart on Europe - Year-over-year growth 2025-2030 (%)
Data Table on Europe - Year-over-year growth 2025-2030 (%)
Chart on Regional Comparison - Europe
Data Table on Regional Comparison - Europe

12.5.1 Germany - Market size and forecast 2025-2030

Chart on Germany - Market size and forecast 2025-2030 ($ million)
Data Table on Germany - Market size and forecast 2025-2030 ($ million)
Chart on Germany - Year-over-year growth 2025-2030 (%)
Data Table on Germany - Year-over-year growth 2025-2030 (%)

12.5.2 Switzerland - Market size and forecast 2025-2030

Chart on Switzerland - Market size and forecast 2025-2030 ($ million)
Data Table on Switzerland - Market size and forecast 2025-2030 ($ million)
Chart on Switzerland - Year-over-year growth 2025-2030 (%)
Data Table on Switzerland - Year-over-year growth 2025-2030 (%)

12.5.3 France - Market size and forecast 2025-2030

Chart on France - Market size and forecast 2025-2030 ($ million)
Data Table on France - Market size and forecast 2025-2030 ($ million)
Chart on France - Year-over-year growth 2025-2030 (%)
Data Table on France - Year-over-year growth 2025-2030 (%)

12.5.4 UK - Market size and forecast 2025-2030

Chart on UK - Market size and forecast 2025-2030 ($ million)
Data Table on UK - Market size and forecast 2025-2030 ($ million)
Chart on UK - Year-over-year growth 2025-2030 (%)
Data Table on UK - Year-over-year growth 2025-2030 (%)

12.5.5 Spain - Market size and forecast 2025-2030

Chart on Spain - Market size and forecast 2025-2030 ($ million)
Data Table on Spain - Market size and forecast 2025-2030 ($ million)
Chart on Spain - Year-over-year growth 2025-2030 (%)
Data Table on Spain - Year-over-year growth 2025-2030 (%)

12.5.6 The Netherlands - Market size and forecast 2025-2030

Chart on The Netherlands - Market size and forecast 2025-2030 ($ million)
Data Table on The Netherlands - Market size and forecast 2025-2030 ($ million)
Chart on The Netherlands - Year-over-year growth 2025-2030 (%)
Data Table on The Netherlands - Year-over-year growth 2025-2030 (%)

12.6 South America - Market size and forecast 2025-2030

Chart on South America - Market size and forecast 2025-2030 ($ million)
Data Table on South America - Market size and forecast 2025-2030 ($ million)
Chart on South America - Year-over-year growth 2025-2030 (%)
Data Table on South America - Year-over-year growth 2025-2030 (%)
Chart on Regional Comparison - South America
Data Table on Regional Comparison - South America

12.6.1 Brazil - Market size and forecast 2025-2030

Chart on Brazil - Market size and forecast 2025-2030 ($ million)
Data Table on Brazil - Market size and forecast 2025-2030 ($ million)
Chart on Brazil - Year-over-year growth 2025-2030 (%)
Data Table on Brazil - Year-over-year growth 2025-2030 (%)

12.6.2 Argentina - Market size and forecast 2025-2030

Chart on Argentina - Market size and forecast 2025-2030 ($ million)
Data Table on Argentina - Market size and forecast 2025-2030 ($ million)
Chart on Argentina - Year-over-year growth 2025-2030 (%)
Data Table on Argentina - Year-over-year growth 2025-2030 (%)

12.6.3 Chile - Market size and forecast 2025-2030

Chart on Chile - Market size and forecast 2025-2030 ($ million)
Data Table on Chile - Market size and forecast 2025-2030 ($ million)
Chart on Chile - Year-over-year growth 2025-2030 (%)
Data Table on Chile - Year-over-year growth 2025-2030 (%)

12.7 Middle East and Africa - Market size and forecast 2025-2030

Chart on Middle East and Africa - Market size and forecast 2025-2030 ($ million)
Data Table on Middle East and Africa - Market size and forecast 2025-2030 ($ million)
Chart on Middle East and Africa - Year-over-year growth 2025-2030 (%)
Data Table on Middle East and Africa - Year-over-year growth 2025-2030 (%)
Chart on Regional Comparison - Middle East and Africa
Data Table on Regional Comparison - Middle East and Africa

12.7.1 Saudi Arabia - Market size and forecast 2025-2030

Chart on Saudi Arabia - Market size and forecast 2025-2030 ($ million)
Data Table on Saudi Arabia - Market size and forecast 2025-2030 ($ million)
Chart on Saudi Arabia - Year-over-year growth 2025-2030 (%)
Data Table on Saudi Arabia - Year-over-year growth 2025-2030 (%)

12.7.2 UAE - Market size and forecast 2025-2030

Chart on UAE - Market size and forecast 2025-2030 ($ million)
Data Table on UAE - Market size and forecast 2025-2030 ($ million)
Chart on UAE - Year-over-year growth 2025-2030 (%)
Data Table on UAE - Year-over-year growth 2025-2030 (%)

12.7.3 South Africa - Market size and forecast 2025-2030

Chart on South Africa - Market size and forecast 2025-2030 ($ million)
Data Table on South Africa - Market size and forecast 2025-2030 ($ million)
Chart on South Africa - Year-over-year growth 2025-2030 (%)
Data Table on South Africa - Year-over-year growth 2025-2030 (%)

12.7.4 Egypt - Market size and forecast 2025-2030

Chart on Egypt - Market size and forecast 2025-2030 ($ million)
Data Table on Egypt - Market size and forecast 2025-2030 ($ million)
Chart on Egypt - Year-over-year growth 2025-2030 (%)
Data Table on Egypt - Year-over-year growth 2025-2030 (%)

12.7.5 Nigeria - Market size and forecast 2025-2030

Chart on Nigeria - Market size and forecast 2025-2030 ($ million)
Data Table on Nigeria - Market size and forecast 2025-2030 ($ million)
Chart on Nigeria - Year-over-year growth 2025-2030 (%)
Data Table on Nigeria - Year-over-year growth 2025-2030 (%)

12.8 Market opportunity by geography

Market opportunity by geography ($ million)
Data Tables on Market opportunity by geography ($ million)

13. Drivers, Challenges, and Opportunity

13.1 Market drivers

Rising research and development costs associated with pipeline complexity
Global explosion of complex biologics and advanced modalities
Escalating global burden of chronic diseases and aging demographics

13.2 Market challenges

High capital expenditure requirements and technical barriers to entry
Overwhelming complexity in stringent regional regulatory compliance
Critical capacity constraints and global supply chain disruptions

13.3 Impact of drivers and challenges

Impact of drivers and challenges in 2025 and 2030

13.4 Market opportunities

Structural transformation and rise of pure-play CDMO models
Technological integration of automated and smart digitized facilities
Geographic diversification and onshoring to build supply chain resilience

14. Competitive Landscape

14.1 Overview

14.2

Overview on criticality of inputs and factors of differentiation

14.3 Landscape disruption

Overview on factors of disruption

14.4 Industry risks

Impact of key risks on business

15. Competitive Analysis

15.1 Companies profiled

Companies covered

15.2 Company ranking index

15.3 Market positioning of companies

Matrix on companies position and classification

15.4 Aenova Holding GmbH

Aenova Holding GmbH - Overview
Aenova Holding GmbH - Product / Service
Aenova Holding GmbH - Key offerings
SWOT

15.5 Bora Pharmaceuticals

Bora Pharmaceuticals - Overview
Bora Pharmaceuticals - Product / Service
Bora Pharmaceuticals - Key offerings
SWOT

15.6 Cambrex Corp.

Cambrex Corp. - Overview
Cambrex Corp. - Product / Service
Cambrex Corp. - Key offerings
SWOT

15.7 Catalent Inc.

Catalent Inc. - Overview
Catalent Inc. - Product / Service
Catalent Inc. - Key offerings
SWOT

15.8 Charles River Laboratories

Charles River Laboratories - Overview
Charles River Laboratories - Business segments
Charles River Laboratories - Key offerings
Charles River Laboratories - Segment focus
SWOT

15.9 Eurofins Scientific SE

Eurofins Scientific SE - Overview
Eurofins Scientific SE - Business segments
Eurofins Scientific SE - Key offerings
Eurofins Scientific SE - Segment focus
SWOT

15.10 Evonik Industries AG

Evonik Industries AG - Overview
Evonik Industries AG - Business segments
Evonik Industries AG - Key offerings
Evonik Industries AG - Segment focus
SWOT

15.11 Gerresheimer AG

Gerresheimer AG - Overview
Gerresheimer AG - Business segments
Gerresheimer AG - Key offerings
Gerresheimer AG - Segment focus
SWOT

15.12 Laboratory Holdings Inc.

Laboratory Holdings Inc. - Overview
Laboratory Holdings Inc. - Business segments
Laboratory Holdings Inc. - Key offerings
Laboratory Holdings Inc. - Segment focus
SWOT

15.13 NextPharma GmbH

NextPharma GmbH - Overview
NextPharma GmbH - Product / Service
NextPharma GmbH - Key offerings
SWOT

15.14 Samsung Biologics Co. Ltd.

Samsung Biologics Co. Ltd. - Overview
Samsung Biologics Co. Ltd. - Product / Service
Samsung Biologics Co. Ltd. - Key offerings
SWOT

15.15 Thermo Fisher Scientific Inc.

Thermo Fisher Scientific Inc. - Overview
Thermo Fisher Scientific Inc. - Business segments
Thermo Fisher Scientific Inc. - Key news
Thermo Fisher Scientific Inc. - Key offerings
Thermo Fisher Scientific Inc. - Segment focus
SWOT

15.16 Vetter Pharma Fertigung GmbH

Vetter Pharma Fertigung GmbH - Overview
Vetter Pharma Fertigung GmbH - Product / Service
Vetter Pharma Fertigung GmbH - Key offerings
SWOT

15.17 WuXi AppTec Co. Ltd.

WuXi AppTec Co. Ltd. - Overview
WuXi AppTec Co. Ltd. - Business segments
WuXi AppTec Co. Ltd. - Key offerings
WuXi AppTec Co. Ltd. - Segment focus
SWOT

15.18 WuXi Biologics Cayman Inc.

WuXi Biologics Cayman Inc. - Overview
WuXi Biologics Cayman Inc. - Product / Service
WuXi Biologics Cayman Inc. - Key offerings
SWOT

16. Appendix

16.1 Scope of the report

Market definition
Objectives
Notes and caveats

16.2 Inclusions and exclusions checklist

Inclusions checklist
Exclusions checklist

16.3 Currency conversion rates for US$

16.4 Research methodology

16.5 Data procurement

Information sources

16.6 Data validation

16.7 Validation techniques employed for market sizing

16.8 Data synthesis

16.9 360 degree market analysis

16.10 List of abbreviations

Research Methodology

Technavio presents a detailed picture of the market by way of study, synthesis, and summation of data from multiple sources. The analysts have presented the various facets of the market with a particular focus on identifying the key industry influencers. The data thus presented is comprehensive, reliable, and the result of extensive research, both primary and secondary.

INFORMATION SOURCES

Primary sources

  • Manufacturers and suppliers
  • Channel partners
  • Industry experts
  • Strategic decision makers

Secondary sources

  • Industry journals and periodicals
  • Government data
  • Financial reports of key industry players
  • Historical data
  • Press releases

DATA ANALYSIS

Data Synthesis

  • Collation of data
  • Estimation of key figures
  • Analysis of derived insights

Data Validation

  • Triangulation with data models
  • Reference against proprietary databases
  • Corroboration with industry experts

REPORT WRITING

Qualitative

  • Market drivers
  • Market challenges
  • Market trends
  • Five forces analysis

Quantitative

  • Market size and forecast
  • Market segmentation
  • Geographical insights
  • Competitive landscape

Interested in this report?

Get your sample now to see our research methodology and insights!

Download Now

Frequently Asked Questions

Contract Development And Manufacturing Organization Outsourcing market growth will increase by USD 179219.6 million during 2026-2030.

The Contract Development And Manufacturing Organization Outsourcing market is expected to grow at a CAGR of 17.1% during 2026-2030.

Contract Development And Manufacturing Organization Outsourcing market is segmented by Product (Small molecules, Biologics) Service (Drug product manufacturing, API or bulk drugs, Clinical trial services, Packaging) End-user (Pharmaceutical companies, Biotechnology companies, Government and academic research institutes)

Aenova Holding GmbH, Alcami Corp, Bora Pharmaceuticals, Cambrex Corp., Catalent Inc., Charles River Laboratories, Delpharm, Eurofins Scientific SE, Evonik Industries AG, Fujifilm Diosynth Biotechnologies, Gerresheimer AG, Hovione S.A., Laboratory Holdings Inc., NextPharma GmbH, Piramal Pharma Solutions, Samsung Biologics Co. Ltd., Thermo Fisher Scientific Inc., Vetter Pharma Fertigung GmbH, WuXi AppTec Co. Ltd., WuXi Biologics Cayman Inc. are a few of the key vendors in the Contract Development And Manufacturing Organization Outsourcing market.

APAC will register the highest growth rate of 36.7% among the other regions. Therefore, the Contract Development And Manufacturing Organization Outsourcing market in APAC is expected to garner significant business opportunities for the vendors during the forecast period.

US, Canada, Mexico, China, India, South Korea, Japan, Australia, Indonesia, Germany, Switzerland, France, UK, Spain, The Netherlands, Brazil, Argentina, Chile, Saudi Arabia, UAE, South Africa, Egypt, Nigeria

  • Rising research and development costs associated with pipeline complexity is the driving factor this market.

The Contract Development And Manufacturing Organization Outsourcing market vendors should focus on grabbing business opportunities from the Product segment as it accounted for the largest market share in the base year.
RIA - Research AI Assistant
Ask RIA
