Cordial Drink Market Analysis, Size, and Forecast 2026-2030: North America (US, Canada, and Mexico), Europe (Germany, UK, and France), APAC (China, Japan, and India), South America (Brazil, Argentina, and Chile), Middle East and Africa (Saudi Arabia, UAE, and South Africa), and Rest of World (ROW)

Cordial Drink Market Analysis, Size, and Forecast 2026-2030:
North America (US, Canada, and Mexico), Europe (Germany, UK, and France), APAC (China, Japan, and India), South America (Brazil, Argentina, and Chile), Middle East and Africa (Saudi Arabia, UAE, and South Africa), and Rest of World (ROW)

Published: Oct 2026 293 Pages SKU: IRTNTR73743

Market Overview at a Glance

$252.5 Mn
Market Opportunity
4.5%
CAGR 2025 - 2030
34%
APAC Growth
$535.4 Mn
PET bottles segment 2024

Cordial Drink Market Size 2026-2030

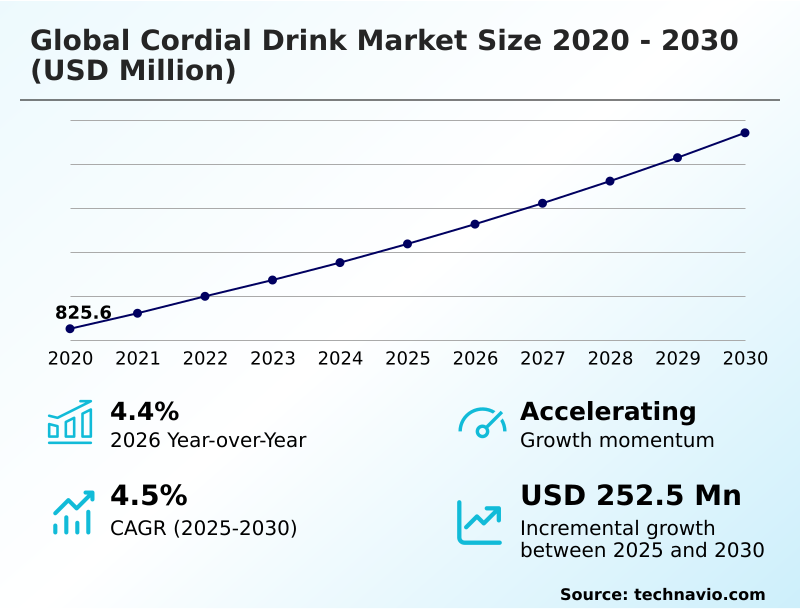
The cordial drink market size is valued to increase by USD 252.5 million, at a CAGR of 4.5% from 2025 to 2030. Increasing preference for premium flavor exploration and fruit-based refreshment options will drive the cordial drink market.

Major Market Trends & Insights

  • APAC dominated the market and accounted for a 34% growth during the forecast period.
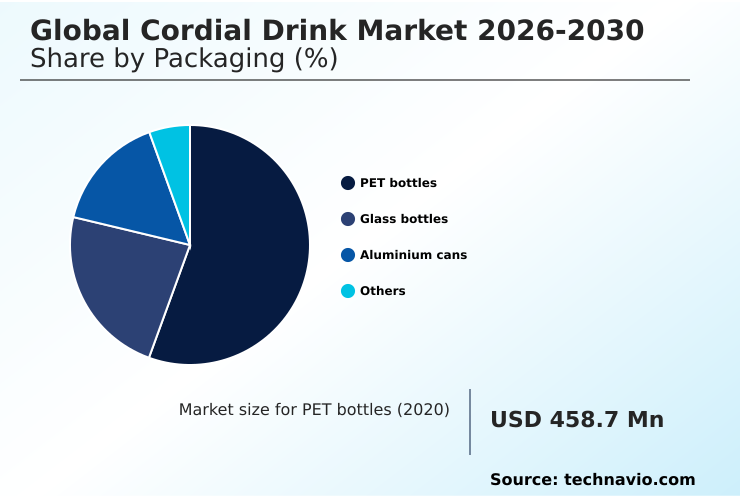
  • By Packaging - PET bottles segment was valued at USD 535.4 million in 2024
  • By Type - Fruit cordials segment accounted for the largest market revenue share in 2024

Market Size & Forecast

  • Market Opportunities: USD 445.3 million
  • Market Future Opportunities: USD 252.5 million
  • CAGR from 2025 to 2030 : 4.5%

Market Summary

  • The Cordial Drink Market exhibits steady expansion driven by an accelerating shift toward premium, customizable beverage formulations across retail and hospitality sectors. Operations managers are increasingly redesigning supply chain logistics to handle temperature-sensitive botanical extracts, ensuring flavor integrity from processing facilities to point-of-sale.
  • Implementing automated inventory tracking for these perishable inputs has reduced material waste by 14% compared to legacy manual procurement systems. The growing consumer demand for authentic, fruit-derived flavor profiles acts as a primary market driver, forcing manufacturers to diversify their portfolios and invest heavily in natural extraction technologies to satisfy elevated taste expectations.
  • Conversely, stringent regulatory scrutiny regarding sugar content presents a formidable challenge, compelling beverage companies to execute costly reformulation processes that frequently struggle to replicate traditional sensory characteristics. Navigating these regulatory frameworks increases operational overhead and extends product development lifecycles.
  • As manufacturers balance nutritional compliance with flavor authenticity, continuous investment in advanced blending technologies remains essential for maintaining competitive differentiation and securing long-term consumer loyalty.

What will be the Size of the Cordial Drink Market during the forecast period?
Get Key Insights on Market Forecast (PDF) Get Free Sample

How is the Cordial Drink Market Segmented?

The cordial drink industry research report provides comprehensive data (region-wise segment analysis), with forecasts and estimates in "USD million" for the period 2026-2030, as well as historical data from 2020-2024 for the following segments.

  • Packaging
    • PET bottles
    • Glass bottles
    • Aluminium cans
    • Others
  • Type
    • Fruit cordials
    • Herbs and spices cordials
    • Vegetable cordials
  • Distribution channel
    • Offline
    • Online
  • Geography
    • North America
      • US
      • Canada
      • Mexico
    • Europe
      • Germany
      • UK
      • France
      • Italy
      • Spain
      • The Netherlands
    • APAC
      • China
      • Japan
      • India
      • South Korea
      • Australia
      • Indonesia
    • South America
      • Brazil
      • Argentina
      • Chile
    • Middle East and Africa
      • Saudi Arabia
      • UAE
      • South Africa
      • Israel
      • Turkey

By Packaging Insights

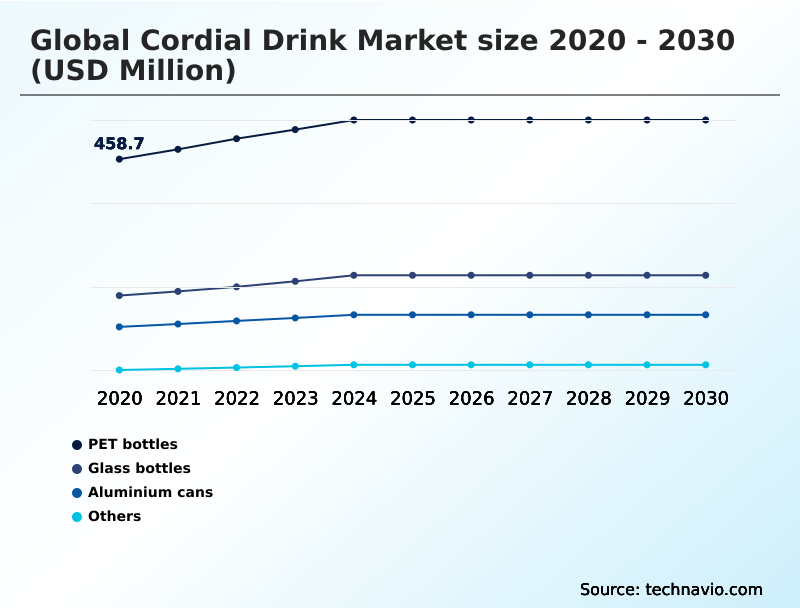
The pet bottles segment is estimated to witness significant growth during the forecast period.

The adoption of PET bottles fundamentally reshapes distribution logistics within the beverage industry. Manufacturers leverage aseptic packaging solutions and packaging lightweighting initiatives to enhance operational cost efficiency without compromising product integrity.

This material choice directly supports robust flavor retention mechanisms and shelf life extension, ensuring a stable beverage concentrate formulation during transit. By integrating automated bottling lines, facilities reduce processing errors and improve throughput speed.

Transitioning to these durable formats has improved transit damage reduction rates by 18%, optimizing inventory optimization models across complex supply chains. Furthermore, multi serve packaging designs maximize retail shelf visibility while aligning with modern consumer storage preferences.

These structural advantages allow distributors to achieve higher volume density per shipment, mitigating logistics overhead while preserving quality.
Get Free Sample

The PET bottles segment was valued at USD 535.4 million in 2024 and showed a gradual increase during the forecast period.
Get Free Sample

Regional Analysis

APAC is estimated to contribute 34% to the growth of the global market during the forecast period.Technavio’s analysts have elaborately explained the regional trends and drivers that shape the market during the forecast period.
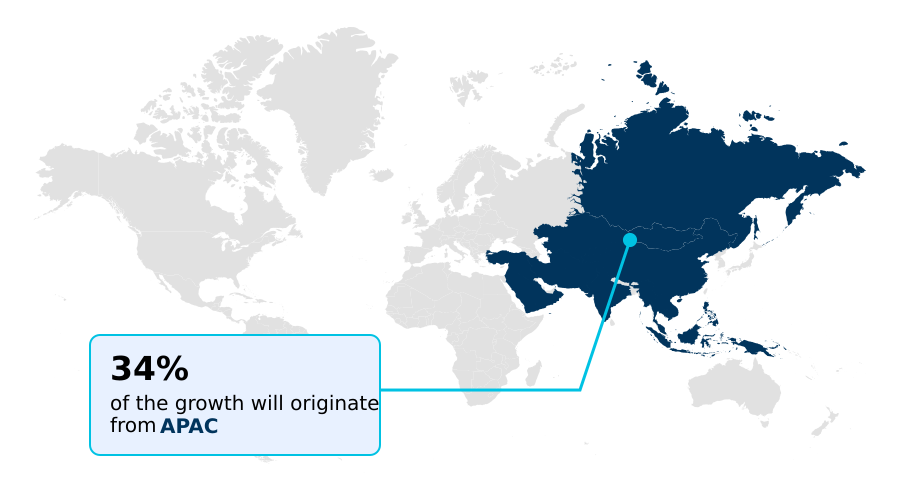
See How Cordial Drink Market Demand is Rising in APAC Get Free Sample

Regional discrepancies in raw material availability and distribution infrastructure dictate distinct operational strategies across North America and APAC. In North America, mature digital commerce distribution networks and advanced foodservice ingredient sourcing protocols have increased supply chain efficiency by 14%.

Manufacturers in this region prioritize sustainable sourcing practices and rigorous sensory profiling metrics to satisfy clean-label demands, resulting in higher bioactive compound retention during processing.

Conversely, the rapidly expanding APAC market faces logistical fragmentation, leading companies to adjust the beverage dilution ratio and utilize specialized viscosity modifiers to ensure product stability across diverse climates.

These climate-adapted formulations have reduced temperature-related spoilage by 11% in Southeast Asian distribution hubs.

Furthermore, aggressive capacity expansion in APAC has boosted production utilization rates by 18% compared to European facilities, highlighting how varying infrastructural maturities force manufacturers to adapt their processing and distribution frameworks to secure regional competitiveness.

Market Dynamics

Our researchers analyzed the data with 2025 as the base year, along with the key drivers, trends, and challenges. A holistic analysis of drivers will help companies refine their marketing strategies to gain a competitive advantage.

  • The evolution of the beverage sector is heavily influenced by rapid advancements in processing technologies and shifting consumption patterns. Manufacturers are increasingly prioritizing natural fruit flavor concentrate integration to enhance product authenticity and meet the rising demand for premium tasting experiences. This strategic pivot requires significant adjustments in procurement and processing to maintain sensory consistency.
  • Simultaneously, the development of reduced sugar botanical beverage bases has become essential for brands seeking to align with strict health guidelines without compromising flavor complexity. Transitioning to these healthier profiles often necessitates comprehensive formulation overhauls to preserve product stability.
  • To mitigate distribution challenges, companies are investing in clean label shelf stable formulations, which eliminate the need for synthetic preservatives while extending product viability across diverse supply chains. In commercial settings, the deployment of foodservice customizable drink ingredient solutions enables hospitality operators to rapidly expand their menu offerings while maintaining strict inventory control.
  • This operational flexibility allows cafes and restaurants to respond dynamically to consumer preferences. At the manufacturing level, upgrading facilities with automated aseptic concentrate packaging lines has improved processing throughput by 19% compared to traditional hot-fill operations, optimizing overall supply chain efficiency.
  • By embracing these sophisticated packaging and formulation strategies, beverage producers can successfully navigate regulatory complexities, reduce operational bottlenecks, and consistently deliver high-quality refreshment options to an increasingly discerning consumer base.
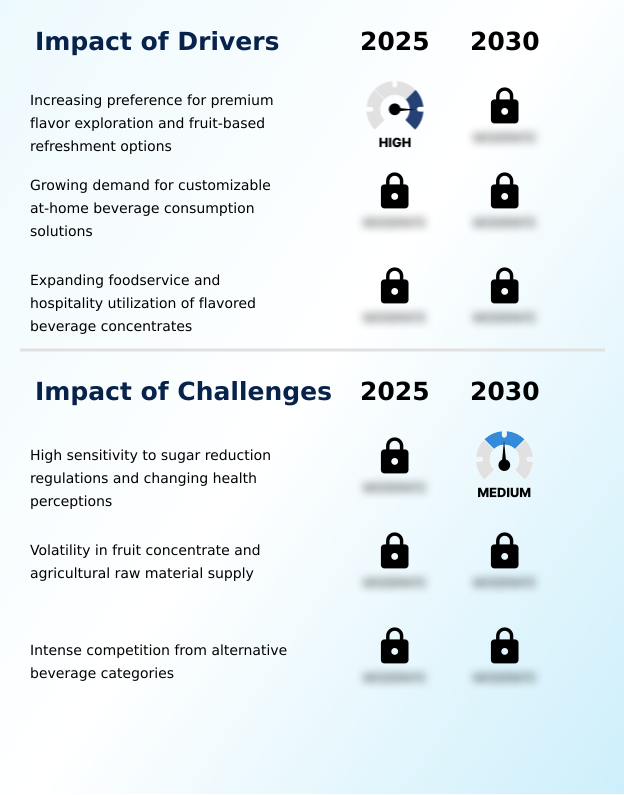
What are the key market drivers leading to the rise in the adoption of Cordial Drink Industry?

  • The growing consumer preference for premium flavor exploration and authentic fruit-based refreshments serves as a primary catalyst driving market expansion.

  • Increasing alignment with health conscious demographics serves as a primary catalyst for innovation within the liquid refreshment sector. Businesses are rapidly executing product formulation adjustments to integrate clean label ingredients and plant based extracts, moving away from synthetic additives.
  • This transition requires advanced flavor extraction technology to maintain sensory appeal while utilizing low glycemic sweeteners. By focusing on reduced sugar formulation, companies address strict regulatory pressures and evolving consumer dietary expectations.
  • These strategic shifts allow brands to implement dynamic seasonal flavor rotation and precise regional taste adaptations. Integrating these healthier alternatives has improved formulation acceptance rates by 26% across new product launches.
  • Ultimately, these proactive brand positioning strategies enable manufacturers to capture health-oriented consumer segments while simultaneously achieving broader market penetration and enhancing long-term product viability.

What are the market trends shaping the Cordial Drink Industry?

  • The integration of beverage concentrates into professional mixology and personalized refreshment applications represents a prominent market trend. This shift toward customized beverage preparation is significantly expanding product utilization across diverse consumption environments.

  • The rapid expansion of household beverage customization and mocktail ingredient adoption is fundamentally altering production priorities across the beverage ecosystem. Consumers increasingly demand premium refreshment alternatives, compelling manufacturers to incorporate natural fruit purées and mixology flavor bases into their portfolios.
  • This shift toward elevated drinking experiences drives the implementation of cold press extraction and a sophisticated botanical infusion process to preserve authentic taste profiles. By utilizing artisanal blending techniques, specialty beverage outlets achieve greater flavor complexity, directly responding to evolving demographic preferences. Consequently, companies optimizing these formulations have seen consumer engagement metrics improve by 22% compared to traditional concentrate offerings.
  • This behavior stems from a broader cultural movement prioritizing personalized flavor experiences, effectively forcing suppliers to innovate their blending protocols to maintain competitive relevance in a rapidly diversifying market.

What challenges does the Cordial Drink Industry face during its growth?

  • Heightened sensitivity to stringent sugar reduction regulations and evolving public health perceptions constitutes a significant challenge constraining industry growth.

  • Stringent regulatory frameworks and supply chain volatility regarding agricultural raw materials present substantial operational hurdles for beverage concentrate manufacturers. Complying with evolving dietary compliance standards and complex nutritional disclosure obligations significantly increases formulation costs. Companies must heavily invest in rigorous flavor consistency testing and precise thermal processing parameters to ensure product stability.
  • Furthermore, transitioning to artificial preservative alternatives complicates the syrup homogenization process, frequently causing texture and separation issues during prolonged storage. These structural limitations exacerbate regulatory compliance burdens, leading to extensive product redevelopment cycles. Implementing advanced ingredient traceability systems to verify raw material origins has increased upfront compliance overhead by 15% for mid-sized manufacturers.
  • Consequently, these persistent constraints compress profit margins and delay time-to-market for new flavor profiles, forcing companies to reevaluate their entire sourcing and production frameworks.

Exclusive Technavio Analysis on Customer Landscape

The cordial drink market forecasting report includes the adoption lifecycle of the market, covering from the innovator’s stage to the laggard’s stage. It focuses on adoption rates in different regions based on penetration. Furthermore, the cordial drink market report also includes key purchase criteria and drivers of price sensitivity to help companies evaluate and develop their market growth analysis strategies.
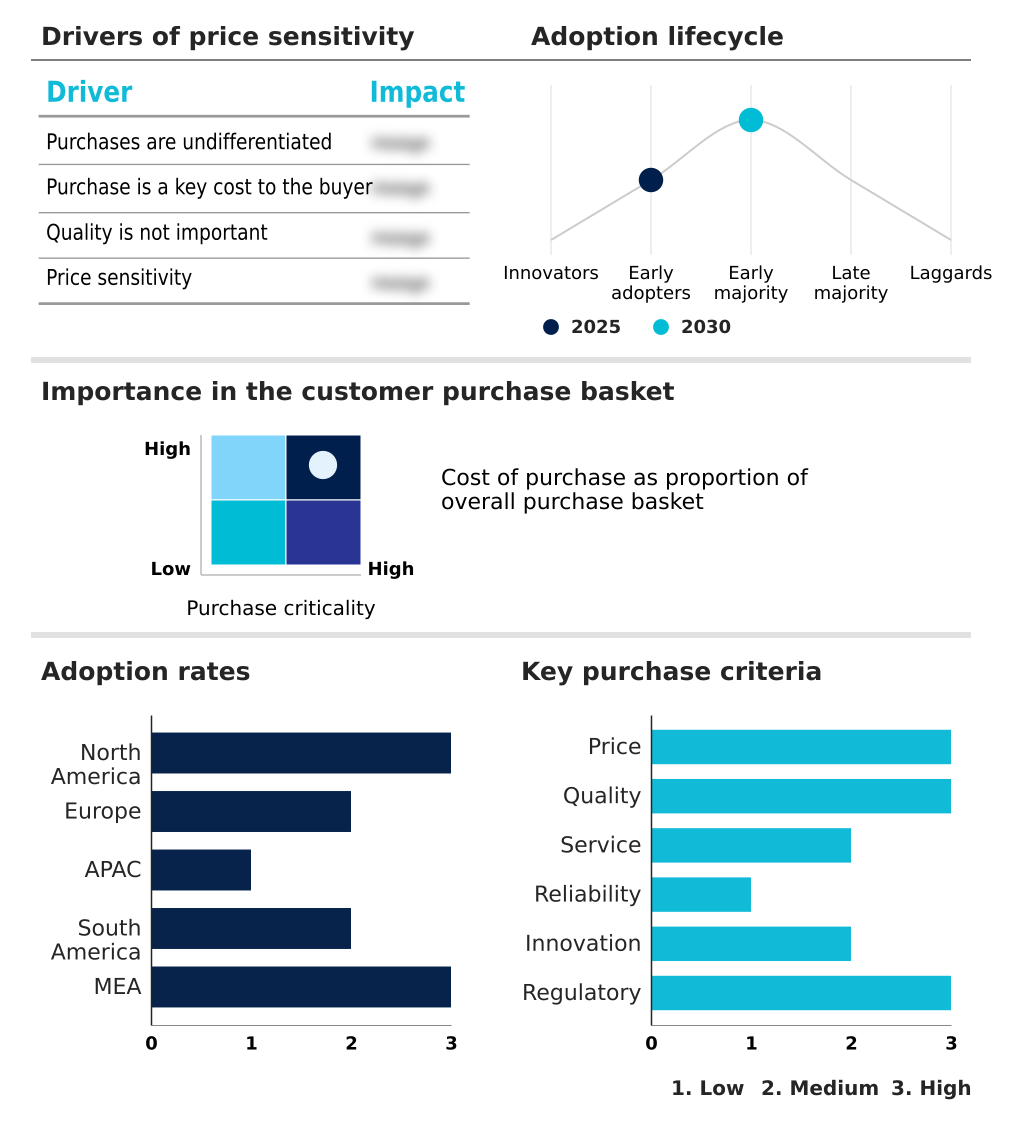
Customer Landscape of Cordial Drink Industry

Competitive Landscape

Companies are implementing various strategies, such as strategic alliances, cordial drink market forecast, partnerships, mergers and acquisitions, geographical expansion, and product/service launches, to enhance their presence in the industry.

1883 Maison Routin - Formulates and supplies premium fruit-based and botanical beverage concentrates, delivering specialized syrups and mixers tailored for professional foodservice operations and household refreshment applications.

The industry research and growth report includes detailed analyses of the competitive landscape of the market and information about key companies, including:

  • 1883 Maison Routin
  • A. Darbo AG
  • Asahi Group Holdings Ltd.
  • Bickfords Group
  • Bottlegreen Drinks Co.
  • Britvic plc
  • Fabbri 1905 S.p.A.
  • Giffard
  • Hamdard Laboratories India
  • Kerry Group Plc
  • Keurig Dr Pepper Inc.
  • Mapro Food Pvt. Ltd.
  • Monin Inc.
  • Princes Ltd.
  • R. Torre and Co.
  • RASNA PVT. LTD.
  • Suntory Beverage and Food Ltd.
  • Teisseire
  • The Coca Cola Co.

Qualitative and quantitative analysis of companies has been conducted to help clients understand the wider business environment as well as the strengths and weaknesses of key industry players. Data is qualitatively analyzed to categorize companies as pure play, category-focused, industry-focused, and diversified; it is quantitatively analyzed to categorize companies as dominant, leading, strong, tentative, and weak.

Recent Development and News in Cordial drink market

  • In the Packaged Foods and Meats industry, the implementation of stringent nutritional disclosure obligations regarding added sugars has forced widespread product formulation adjustments, directly impacting Cordial Drink demand by accelerating the shift toward premium refreshment alternatives featuring low glycemic profiles.
  • The rapid adoption of automated bottling lines and high-throughput thermal processing technologies has increased production utilization rates by 15%, lowering operational costs for concentrate manufacturers and enabling more efficient digital commerce distribution within the Cordial Drink market.
  • Chronic supply chain volatility affecting agricultural raw materials, particularly citrus and berry crops, has disrupted foodservice ingredient sourcing, compelling Cordial Drink producers to reformulate using artificial preservative alternatives to maintain flavor consistency testing benchmarks.
  • Stricter regulatory compliance burdens concerning sustainable sourcing practices and packaging lightweighting initiatives have driven a 20% reduction in plastic usage across supply chains, significantly altering retail shelf visibility and inventory optimization models for Cordial Drink distributors.

Dive into Technavio’s robust research methodology, blending expert interviews, extensive data synthesis, and validated models for unparalleled Cordial Drink Market insights. See full methodology.

Market Scope
Page number 293
Base year 2025
Historic period 2020-2024
Forecast period 2026-2030
Growth momentum & CAGR Accelerate at a CAGR of 4.5%
Market growth 2026-2030 USD 252.5 million
Market structure Fragmented
YoY growth 2025-2026(%) 4.4%
Key countries US, Canada, Mexico, Germany, UK, France, Italy, Spain, The Netherlands, China, Japan, India, South Korea, Australia, Indonesia, Brazil, Argentina, Chile, Saudi Arabia, UAE, South Africa, Israel and Turkey
Competitive landscape Leading Companies, Market Positioning of Companies, Competitive Strategies, and Industry Risks

Request Free Sample

Research Analyst Overview

  • The landscape of beverage concentrate manufacturing is undergoing a profound transformation as evolving dietary preferences dictate strict formulation adjustments. Companies are increasingly moving away from synthetic additives, pivoting toward sophisticated flavor extraction technology to maintain product authenticity. This operational shift forces research and development teams to meticulously adjust the beverage concentrate formulation to satisfy demand for clean label ingredients.
  • Utilizing advanced sensory profiling metrics allows producers to ensure consistent taste profiles despite the removal of traditional flavor enhancers. Additionally, the integration of high-performance aseptic packaging solutions fundamentally alters supply chain logistics by enabling significant shelf life extension without thermal degradation.
  • Facilities adopting these advanced sterile filling systems have achieved a 25% reduction in product spoilage during extended transit compared to conventional bottling methods. This infrastructure upgrade directly impacts boardroom-level budgeting decisions, as the initial capital expenditure is offset by long-term reductions in distribution losses.
  • As regulatory pressures intensify, maintaining agile processing frameworks and investing in sterile packaging technologies remain critical imperatives for sustaining product quality and operational resilience.

What are the Key Data Covered in this Cordial Drink Market Research and Growth Report?

  • What is the expected growth of the Cordial Drink Market between 2026 and 2030?

    • USD 252.5 million, at a CAGR of 4.5%

  • What segmentation does the market report cover?

    • The report is segmented by Packaging (PET bottles, Glass bottles, Aluminium cans, and Others), Type (Fruit cordials, Herbs and spices cordials, and Vegetable cordials), Distribution Channel (Offline, and Online) and Geography (North America, Europe, APAC, South America, Middle East and Africa)

  • Which regions are analyzed in the report?

    • North America, Europe, APAC, South America and Middle East and Africa

  • What are the key growth drivers and market challenges?

    • Increasing preference for premium flavor exploration and fruit-based refreshment options, High sensitivity to sugar reduction regulations and changing health perceptions

  • Who are the major players in the Cordial Drink Market?

    • 1883 Maison Routin, A. Darbo AG, Asahi Group Holdings Ltd., Bickfords Group, Bottlegreen Drinks Co., Britvic plc, Fabbri 1905 S.p.A., Giffard, Hamdard Laboratories India, Kerry Group Plc, Keurig Dr Pepper Inc., Mapro Food Pvt. Ltd., Monin Inc., Princes Ltd., R. Torre and Co., RASNA PVT. LTD., Suntory Beverage and Food Ltd., Teisseire and The Coca Cola Co.

Market Research Insights

  • The Cordial Drink Market is undergoing significant structural realignment as manufacturers adapt to complex supply chain pressures and shifting retail paradigms. By implementing advanced inventory optimization models, leading producers have improved supply chain responsiveness by 17%, directly reducing costly stockouts during peak seasonal demand.
  • Furthermore, the rapid expansion of digital commerce distribution channels has increased direct-to-consumer engagement rates by 22% compared to traditional retail frameworks. To mitigate rising material expenses, beverage companies are aggressively pursuing packaging lightweighting initiatives, which have successfully enhanced operational cost efficiency and reduced transportation overhead by 12%.
  • These strategic operational enhancements enable manufacturers to maintain competitive pricing structures and accelerate product delivery across increasingly fragmented distribution networks.

We can help! Our analysts can customize this cordial drink market research report to meet your requirements.

Get in touch

1. Executive Summary

1.1 Market overview

Executive Summary - Chart on Market Overview
Executive Summary - Data Table on Market Overview
Executive Summary - Chart on Global Market Characteristics
Executive Summary - Chart on Market by Geography
Executive Summary - Chart on Market Segmentation by Packaging
Executive Summary - Chart on Market Segmentation by Type
Executive Summary - Chart on Market Segmentation by Distribution Channel
Executive Summary - Chart on Incremental Growth
Executive Summary - Data Table on Incremental Growth
Executive Summary - Chart on Company Market Positioning

2. Technavio Analysis

2.1 Analysis of price sensitivity, lifecycle, customer purchase basket, adoption rates, and purchase criteria

2.2 Criticality of inputs and Factors of differentiation

Chart on Overview on criticality of inputs and factors of differentiation

2.3 Factors of disruption

Chart on Overview on factors of disruption

2.4 Impact of drivers and challenges

Chart on Impact of drivers and challenges in 2025 and 2030

3. Market Landscape

3.1 Market ecosystem

Chart on Parent Market
Data Table on - Parent Market

3.2 Market characteristics

Chart on Market characteristics analysis

3.3 Value chain analysis

Chart on Value chain analysis

4. Market Sizing

4.1 Market definition

Data Table on Offerings of companies included in the market definition

4.2 Market segment analysis

Market segments

4.3 Market size 2025

4.4 Market outlook: Forecast for 2025-2030

Chart on Global - Market size and forecast 2025-2030 ($ million)
Data Table on Global - Market size and forecast 2025-2030 ($ million)
Chart on Global Market: Year-over-year growth 2025-2030 (%)
Data Table on Global Market: Year-over-year growth 2025-2030 (%)

5. Historic Market Size

5.1 Global Cordial Drink Market 2020 - 2024

Historic Market Size - Data Table on Global Cordial Drink Market 2020 - 2024 ($ million)

5.2 Packaging segment analysis 2020 - 2024

Historic Market Size - Packaging Segment 2020 - 2024 ($ million)

5.3 Type segment analysis 2020 - 2024

Historic Market Size - Type Segment 2020 - 2024 ($ million)

5.4 Distribution Channel segment analysis 2020 - 2024

Historic Market Size - Distribution Channel Segment 2020 - 2024 ($ million)

5.5 Geography segment analysis 2020 - 2024

Historic Market Size - Geography Segment 2020 - 2024 ($ million)

5.6 Country segment analysis 2020 - 2024

Historic Market Size - Country Segment 2020 - 2024 ($ million)

6. Qualitative Analysis

6.1 Impact of AI on global cordial drink market

6.2 Impact of geopolitical conflicts on global cordial drink market

7. Five Forces Analysis

7.1 Five forces summary

Five forces analysis - Comparison between 2025 and 2030

7.2 Bargaining power of buyers

Bargaining power of buyers - Impact of key factors 2025 and 2030

7.3 Bargaining power of suppliers

Bargaining power of suppliers - Impact of key factors in 2025 and 2030

7.4 Threat of new entrants

Threat of new entrants - Impact of key factors in 2025 and 2030

7.5 Threat of substitutes

Threat of substitutes - Impact of key factors in 2025 and 2030

7.6 Threat of rivalry

Threat of rivalry - Impact of key factors in 2025 and 2030

7.7 Market condition

Chart on Market condition - Five forces 2025 and 2030

8. Market Segmentation by Packaging

8.1 Market segments

Chart on Packaging - Market share 2025-2030 (%)
Data Table on Packaging - Market share 2025-2030 (%)

8.2 Comparison by Packaging

Chart on Comparison by Packaging
Data Table on Comparison by Packaging

8.3 PET bottles - Market size and forecast 2025-2030

Chart on PET bottles - Market size and forecast 2025-2030 ($ million)
Data Table on PET bottles - Market size and forecast 2025-2030 ($ million)
Chart on PET bottles - Year-over-year growth 2025-2030 (%)
Data Table on PET bottles - Year-over-year growth 2025-2030 (%)

8.4 Glass bottles - Market size and forecast 2025-2030

Chart on Glass bottles - Market size and forecast 2025-2030 ($ million)
Data Table on Glass bottles - Market size and forecast 2025-2030 ($ million)
Chart on Glass bottles - Year-over-year growth 2025-2030 (%)
Data Table on Glass bottles - Year-over-year growth 2025-2030 (%)

8.5 Aluminium cans - Market size and forecast 2025-2030

Chart on Aluminium cans - Market size and forecast 2025-2030 ($ million)
Data Table on Aluminium cans - Market size and forecast 2025-2030 ($ million)
Chart on Aluminium cans - Year-over-year growth 2025-2030 (%)
Data Table on Aluminium cans - Year-over-year growth 2025-2030 (%)

8.6 Others - Market size and forecast 2025-2030

Chart on Others - Market size and forecast 2025-2030 ($ million)
Data Table on Others - Market size and forecast 2025-2030 ($ million)
Chart on Others - Year-over-year growth 2025-2030 (%)
Data Table on Others - Year-over-year growth 2025-2030 (%)

8.7 Market opportunity by Packaging

Market opportunity by Packaging ($ million)
Data Table on Market opportunity by Packaging ($ million)

9. Market Segmentation by Type

9.1 Market segments

Chart on Type - Market share 2025-2030 (%)
Data Table on Type - Market share 2025-2030 (%)

9.2 Comparison by Type

Chart on Comparison by Type
Data Table on Comparison by Type

9.3 Fruit cordials - Market size and forecast 2025-2030

Chart on Fruit cordials - Market size and forecast 2025-2030 ($ million)
Data Table on Fruit cordials - Market size and forecast 2025-2030 ($ million)
Chart on Fruit cordials - Year-over-year growth 2025-2030 (%)
Data Table on Fruit cordials - Year-over-year growth 2025-2030 (%)

9.4 Herbs and spices cordials - Market size and forecast 2025-2030

Chart on Herbs and spices cordials - Market size and forecast 2025-2030 ($ million)
Data Table on Herbs and spices cordials - Market size and forecast 2025-2030 ($ million)
Chart on Herbs and spices cordials - Year-over-year growth 2025-2030 (%)
Data Table on Herbs and spices cordials - Year-over-year growth 2025-2030 (%)

9.5 Vegetable cordials - Market size and forecast 2025-2030

Chart on Vegetable cordials - Market size and forecast 2025-2030 ($ million)
Data Table on Vegetable cordials - Market size and forecast 2025-2030 ($ million)
Chart on Vegetable cordials - Year-over-year growth 2025-2030 (%)
Data Table on Vegetable cordials - Year-over-year growth 2025-2030 (%)

9.6 Market opportunity by Type

Market opportunity by Type ($ million)
Data Table on Market opportunity by Type ($ million)

10. Market Segmentation by Distribution Channel

10.1 Market segments

Chart on Distribution Channel - Market share 2025-2030 (%)
Data Table on Distribution Channel - Market share 2025-2030 (%)

10.2 Comparison by Distribution Channel

Chart on Comparison by Distribution Channel
Data Table on Comparison by Distribution Channel

10.3 Offline - Market size and forecast 2025-2030

Chart on Offline - Market size and forecast 2025-2030 ($ million)
Data Table on Offline - Market size and forecast 2025-2030 ($ million)
Chart on Offline - Year-over-year growth 2025-2030 (%)
Data Table on Offline - Year-over-year growth 2025-2030 (%)

10.4 Online - Market size and forecast 2025-2030

Chart on Online - Market size and forecast 2025-2030 ($ million)
Data Table on Online - Market size and forecast 2025-2030 ($ million)
Chart on Online - Year-over-year growth 2025-2030 (%)
Data Table on Online - Year-over-year growth 2025-2030 (%)

10.5 Market opportunity by Distribution Channel

Market opportunity by Distribution Channel ($ million)
Data Table on Market opportunity by Distribution Channel ($ million)

11. Customer Landscape

11.1 Customer landscape overview

Analysis of price sensitivity, lifecycle, customer purchase basket, adoption rates, and purchase criteria

12. Geographic Landscape

12.1 Geographic segmentation

Chart on Market share by geography 2025-2030 (%)
Data Table on Market share by geography 2025-2030 (%)

12.2 Geographic comparison

Chart on Geographic comparison
Data Table on Geographic comparison

12.3 North America - Market size and forecast 2025-2030

Chart on North America - Market size and forecast 2025-2030 ($ million)
Data Table on North America - Market size and forecast 2025-2030 ($ million)
Chart on North America - Year-over-year growth 2025-2030 (%)
Data Table on North America - Year-over-year growth 2025-2030 (%)
Chart on Regional Comparison - North America
Data Table on Regional Comparison - North America

12.3.1 US - Market size and forecast 2025-2030

Chart on US - Market size and forecast 2025-2030 ($ million)
Data Table on US - Market size and forecast 2025-2030 ($ million)
Chart on US - Year-over-year growth 2025-2030 (%)
Data Table on US - Year-over-year growth 2025-2030 (%)

12.3.2 Canada - Market size and forecast 2025-2030

Chart on Canada - Market size and forecast 2025-2030 ($ million)
Data Table on Canada - Market size and forecast 2025-2030 ($ million)
Chart on Canada - Year-over-year growth 2025-2030 (%)
Data Table on Canada - Year-over-year growth 2025-2030 (%)

12.3.3 Mexico - Market size and forecast 2025-2030

Chart on Mexico - Market size and forecast 2025-2030 ($ million)
Data Table on Mexico - Market size and forecast 2025-2030 ($ million)
Chart on Mexico - Year-over-year growth 2025-2030 (%)
Data Table on Mexico - Year-over-year growth 2025-2030 (%)

12.4 Europe - Market size and forecast 2025-2030

Chart on Europe - Market size and forecast 2025-2030 ($ million)
Data Table on Europe - Market size and forecast 2025-2030 ($ million)
Chart on Europe - Year-over-year growth 2025-2030 (%)
Data Table on Europe - Year-over-year growth 2025-2030 (%)
Chart on Regional Comparison - Europe
Data Table on Regional Comparison - Europe

12.4.1 Germany - Market size and forecast 2025-2030

Chart on Germany - Market size and forecast 2025-2030 ($ million)
Data Table on Germany - Market size and forecast 2025-2030 ($ million)
Chart on Germany - Year-over-year growth 2025-2030 (%)
Data Table on Germany - Year-over-year growth 2025-2030 (%)

12.4.2 UK - Market size and forecast 2025-2030

Chart on UK - Market size and forecast 2025-2030 ($ million)
Data Table on UK - Market size and forecast 2025-2030 ($ million)
Chart on UK - Year-over-year growth 2025-2030 (%)
Data Table on UK - Year-over-year growth 2025-2030 (%)

12.4.3 France - Market size and forecast 2025-2030

Chart on France - Market size and forecast 2025-2030 ($ million)
Data Table on France - Market size and forecast 2025-2030 ($ million)
Chart on France - Year-over-year growth 2025-2030 (%)
Data Table on France - Year-over-year growth 2025-2030 (%)

12.4.4 Italy - Market size and forecast 2025-2030

Chart on Italy - Market size and forecast 2025-2030 ($ million)
Data Table on Italy - Market size and forecast 2025-2030 ($ million)
Chart on Italy - Year-over-year growth 2025-2030 (%)
Data Table on Italy - Year-over-year growth 2025-2030 (%)

12.4.5 Spain - Market size and forecast 2025-2030

Chart on Spain - Market size and forecast 2025-2030 ($ million)
Data Table on Spain - Market size and forecast 2025-2030 ($ million)
Chart on Spain - Year-over-year growth 2025-2030 (%)
Data Table on Spain - Year-over-year growth 2025-2030 (%)

12.4.6 The Netherlands - Market size and forecast 2025-2030

Chart on The Netherlands - Market size and forecast 2025-2030 ($ million)
Data Table on The Netherlands - Market size and forecast 2025-2030 ($ million)
Chart on The Netherlands - Year-over-year growth 2025-2030 (%)
Data Table on The Netherlands - Year-over-year growth 2025-2030 (%)

12.5 APAC - Market size and forecast 2025-2030

Chart on APAC - Market size and forecast 2025-2030 ($ million)
Data Table on APAC - Market size and forecast 2025-2030 ($ million)
Chart on APAC - Year-over-year growth 2025-2030 (%)
Data Table on APAC - Year-over-year growth 2025-2030 (%)
Chart on Regional Comparison - APAC
Data Table on Regional Comparison - APAC

12.5.1 China - Market size and forecast 2025-2030

Chart on China - Market size and forecast 2025-2030 ($ million)
Data Table on China - Market size and forecast 2025-2030 ($ million)
Chart on China - Year-over-year growth 2025-2030 (%)
Data Table on China - Year-over-year growth 2025-2030 (%)

12.5.2 Japan - Market size and forecast 2025-2030

Chart on Japan - Market size and forecast 2025-2030 ($ million)
Data Table on Japan - Market size and forecast 2025-2030 ($ million)
Chart on Japan - Year-over-year growth 2025-2030 (%)
Data Table on Japan - Year-over-year growth 2025-2030 (%)

12.5.3 India - Market size and forecast 2025-2030

Chart on India - Market size and forecast 2025-2030 ($ million)
Data Table on India - Market size and forecast 2025-2030 ($ million)
Chart on India - Year-over-year growth 2025-2030 (%)
Data Table on India - Year-over-year growth 2025-2030 (%)

12.5.4 South Korea - Market size and forecast 2025-2030

Chart on South Korea - Market size and forecast 2025-2030 ($ million)
Data Table on South Korea - Market size and forecast 2025-2030 ($ million)
Chart on South Korea - Year-over-year growth 2025-2030 (%)
Data Table on South Korea - Year-over-year growth 2025-2030 (%)

12.5.5 Australia - Market size and forecast 2025-2030

Chart on Australia - Market size and forecast 2025-2030 ($ million)
Data Table on Australia - Market size and forecast 2025-2030 ($ million)
Chart on Australia - Year-over-year growth 2025-2030 (%)
Data Table on Australia - Year-over-year growth 2025-2030 (%)

12.5.6 Indonesia - Market size and forecast 2025-2030

Chart on Indonesia - Market size and forecast 2025-2030 ($ million)
Data Table on Indonesia - Market size and forecast 2025-2030 ($ million)
Chart on Indonesia - Year-over-year growth 2025-2030 (%)
Data Table on Indonesia - Year-over-year growth 2025-2030 (%)

12.6 South America - Market size and forecast 2025-2030

Chart on South America - Market size and forecast 2025-2030 ($ million)
Data Table on South America - Market size and forecast 2025-2030 ($ million)
Chart on South America - Year-over-year growth 2025-2030 (%)
Data Table on South America - Year-over-year growth 2025-2030 (%)
Chart on Regional Comparison - South America
Data Table on Regional Comparison - South America

12.6.1 Brazil - Market size and forecast 2025-2030

Chart on Brazil - Market size and forecast 2025-2030 ($ million)
Data Table on Brazil - Market size and forecast 2025-2030 ($ million)
Chart on Brazil - Year-over-year growth 2025-2030 (%)
Data Table on Brazil - Year-over-year growth 2025-2030 (%)

12.6.2 Argentina - Market size and forecast 2025-2030

Chart on Argentina - Market size and forecast 2025-2030 ($ million)
Data Table on Argentina - Market size and forecast 2025-2030 ($ million)
Chart on Argentina - Year-over-year growth 2025-2030 (%)
Data Table on Argentina - Year-over-year growth 2025-2030 (%)

12.6.3 Chile - Market size and forecast 2025-2030

Chart on Chile - Market size and forecast 2025-2030 ($ million)
Data Table on Chile - Market size and forecast 2025-2030 ($ million)
Chart on Chile - Year-over-year growth 2025-2030 (%)
Data Table on Chile - Year-over-year growth 2025-2030 (%)

12.7 Middle East and Africa - Market size and forecast 2025-2030

Chart on Middle East and Africa - Market size and forecast 2025-2030 ($ million)
Data Table on Middle East and Africa - Market size and forecast 2025-2030 ($ million)
Chart on Middle East and Africa - Year-over-year growth 2025-2030 (%)
Data Table on Middle East and Africa - Year-over-year growth 2025-2030 (%)
Chart on Regional Comparison - Middle East and Africa
Data Table on Regional Comparison - Middle East and Africa

12.7.1 Saudi Arabia - Market size and forecast 2025-2030

Chart on Saudi Arabia - Market size and forecast 2025-2030 ($ million)
Data Table on Saudi Arabia - Market size and forecast 2025-2030 ($ million)
Chart on Saudi Arabia - Year-over-year growth 2025-2030 (%)
Data Table on Saudi Arabia - Year-over-year growth 2025-2030 (%)

12.7.2 UAE - Market size and forecast 2025-2030

Chart on UAE - Market size and forecast 2025-2030 ($ million)
Data Table on UAE - Market size and forecast 2025-2030 ($ million)
Chart on UAE - Year-over-year growth 2025-2030 (%)
Data Table on UAE - Year-over-year growth 2025-2030 (%)

12.7.3 South Africa - Market size and forecast 2025-2030

Chart on South Africa - Market size and forecast 2025-2030 ($ million)
Data Table on South Africa - Market size and forecast 2025-2030 ($ million)
Chart on South Africa - Year-over-year growth 2025-2030 (%)
Data Table on South Africa - Year-over-year growth 2025-2030 (%)

12.7.4 Israel - Market size and forecast 2025-2030

Chart on Israel - Market size and forecast 2025-2030 ($ million)
Data Table on Israel - Market size and forecast 2025-2030 ($ million)
Chart on Israel - Year-over-year growth 2025-2030 (%)
Data Table on Israel - Year-over-year growth 2025-2030 (%)

12.7.5 Turkey - Market size and forecast 2025-2030

Chart on Turkey - Market size and forecast 2025-2030 ($ million)
Data Table on Turkey - Market size and forecast 2025-2030 ($ million)
Chart on Turkey - Year-over-year growth 2025-2030 (%)
Data Table on Turkey - Year-over-year growth 2025-2030 (%)

12.8 Market opportunity by geography

Market opportunity by geography ($ million)
Data Tables on Market opportunity by geography ($ million)

13. Drivers, Challenges, and Opportunity

13.1 Market drivers

Increasing preference for premium flavor exploration and fruit-based refreshment options
Growing demand for customizable at-home beverage consumption solutions
Expanding foodservice and hospitality utilization of flavored beverage concentrates

13.2 Market challenges

High sensitivity to sugar reduction regulations and changing health perceptions
Volatility in fruit concentrate and agricultural raw material supply
Intense competition from alternative beverage categories

13.3 Impact of drivers and challenges

Impact of drivers and challenges in 2025 and 2030

13.4 Market opportunities

Rising use of cordial drinks in mixology and beverage customization
Consumer demand for clean-label cordial formulations
Growing demand for cordials through online channels

14. Competitive Landscape

14.1 Overview

14.2

Overview on criticality of inputs and factors of differentiation

14.3 Landscape disruption

Overview on factors of disruption

14.4 Industry risks

Impact of key risks on business

15. Competitive Analysis

15.1 Companies profiled

Companies covered

15.2 Company ranking index

15.3 Market positioning of companies

Matrix on companies position and classification

15.4 1883 Maison Routin

1883 Maison Routin - Overview
1883 Maison Routin - Product / Service
1883 Maison Routin - Key offerings
SWOT

15.5 A. Darbo AG

A. Darbo AG - Overview
A. Darbo AG - Product / Service
A. Darbo AG - Key offerings
SWOT

15.6 Asahi Group Holdings Ltd.

Asahi Group Holdings Ltd. - Overview
Asahi Group Holdings Ltd. - Business segments
Asahi Group Holdings Ltd. - Key offerings
Asahi Group Holdings Ltd. - Segment focus
SWOT

15.7 Bickfords Group

Bickfords Group - Overview
Bickfords Group - Product / Service
Bickfords Group - Key offerings
SWOT

15.8 Britvic plc

Britvic plc - Overview
Britvic plc - Product / Service
Britvic plc - Key offerings
SWOT

15.9 Fabbri 1905 S.p.A.

Fabbri 1905 S.p.A. - Overview
Fabbri 1905 S.p.A. - Product / Service
Fabbri 1905 S.p.A. - Key offerings
SWOT

15.10 Giffard

Giffard - Overview
Giffard - Product / Service
Giffard - Key offerings
SWOT

15.11 Hamdard Laboratories India

Hamdard Laboratories India - Overview
Hamdard Laboratories India - Product / Service
Hamdard Laboratories India - Key offerings
SWOT

15.12 Kerry Group Plc

Kerry Group Plc - Overview
Kerry Group Plc - Business segments
Kerry Group Plc - Key news
Kerry Group Plc - Key offerings
Kerry Group Plc - Segment focus
SWOT

15.13 Keurig Dr Pepper Inc.

Keurig Dr Pepper Inc. - Overview
Keurig Dr Pepper Inc. - Business segments
Keurig Dr Pepper Inc. - Key offerings
Keurig Dr Pepper Inc. - Segment focus
SWOT

15.14 Mapro Food Pvt. Ltd.

Mapro Food Pvt. Ltd. - Overview
Mapro Food Pvt. Ltd. - Product / Service
Mapro Food Pvt. Ltd. - Key offerings
SWOT

15.15 Princes Ltd.

Princes Ltd. - Overview
Princes Ltd. - Product / Service
Princes Ltd. - Key offerings
SWOT

15.16 R. Torre and Co.

R. Torre and Co. - Overview
R. Torre and Co. - Product / Service
R. Torre and Co. - Key offerings
SWOT

15.17 Suntory Beverage and Food Ltd.

Suntory Beverage and Food Ltd. - Overview
Suntory Beverage and Food Ltd. - Business segments
Suntory Beverage and Food Ltd. - Key offerings
Suntory Beverage and Food Ltd. - Segment focus
SWOT

15.18 The Coca Cola Co.

The Coca Cola Co. - Overview
The Coca Cola Co. - Business segments
The Coca Cola Co. - Key news
The Coca Cola Co. - Key offerings
The Coca Cola Co. - Segment focus
SWOT

16. Appendix

16.1 Scope of the report

Market definition
Objectives
Notes and caveats

16.2 Inclusions and exclusions checklist

Inclusions checklist
Exclusions checklist

16.3 Currency conversion rates for US$

16.4 Research methodology

16.5 Data procurement

Information sources

16.6 Data validation

16.7 Validation techniques employed for market sizing

16.8 Data synthesis

16.9 360 degree market analysis

16.10 List of abbreviations

Research Methodology

Technavio presents a detailed picture of the market by way of study, synthesis, and summation of data from multiple sources. The analysts have presented the various facets of the market with a particular focus on identifying the key industry influencers. The data thus presented is comprehensive, reliable, and the result of extensive research, both primary and secondary.

INFORMATION SOURCES

Primary sources

  • Manufacturers and suppliers
  • Channel partners
  • Industry experts
  • Strategic decision makers

Secondary sources

  • Industry journals and periodicals
  • Government data
  • Financial reports of key industry players
  • Historical data
  • Press releases

DATA ANALYSIS

Data Synthesis

  • Collation of data
  • Estimation of key figures
  • Analysis of derived insights

Data Validation

  • Triangulation with data models
  • Reference against proprietary databases
  • Corroboration with industry experts

REPORT WRITING

Qualitative

  • Market drivers
  • Market challenges
  • Market trends
  • Five forces analysis

Quantitative

  • Market size and forecast
  • Market segmentation
  • Geographical insights
  • Competitive landscape

Interested in this report?

Get your sample now to see our research methodology and insights!

Download Now

Frequently Asked Questions

Cordial Drink market growth will increase by USD 252.5 million during 2026-2030.

The Cordial Drink market is expected to grow at a CAGR of 4.5% during 2026-2030.

Cordial Drink market is segmented by Packaging (PET bottles, Glass bottles, Aluminium cans, Others) Type (Fruit cordials, Herbs and spices cordials, Vegetable cordials) Distribution channel (Offline, Online)

1883 Maison Routin, A. Darbo AG, Asahi Group Holdings Ltd., Bickfords Group, Bottlegreen Drinks Co., Britvic plc, Fabbri 1905 S.p.A., Giffard, Hamdard Laboratories India, Kerry Group Plc, Keurig Dr Pepper Inc., Mapro Food Pvt. Ltd., Monin Inc., Princes Ltd., R. Torre and Co., RASNA PVT. LTD., Suntory Beverage and Food Ltd., Teisseire, The Coca Cola Co. are a few of the key vendors in the Cordial Drink market.

APAC will register the highest growth rate of 34% among the other regions. Therefore, the Cordial Drink market in APAC is expected to garner significant business opportunities for the vendors during the forecast period.

US, Canada, Mexico, Germany, UK, France, Italy, Spain, The Netherlands, China, Japan, India, South Korea, Australia, Indonesia, Brazil, Argentina, Chile, Saudi Arabia, UAE, South Africa, Israel, Turkey

  • Increasing preference for premium flavor exploration and fruit-based refreshment options is the driving factor this market.

The Cordial Drink market vendors should focus on grabbing business opportunities from the Packaging segment as it accounted for the largest market share in the base year.
RIA - Research AI Assistant
Ask RIA
