Counter-Drone Defense Systems Market Size and Growth Forecast 2026-2030
The Counter-Drone Defense Systems Market size was valued at USD 6.16 billion in 2025 growing at a CAGR of 21.1% during the forecast period 2026-2030.
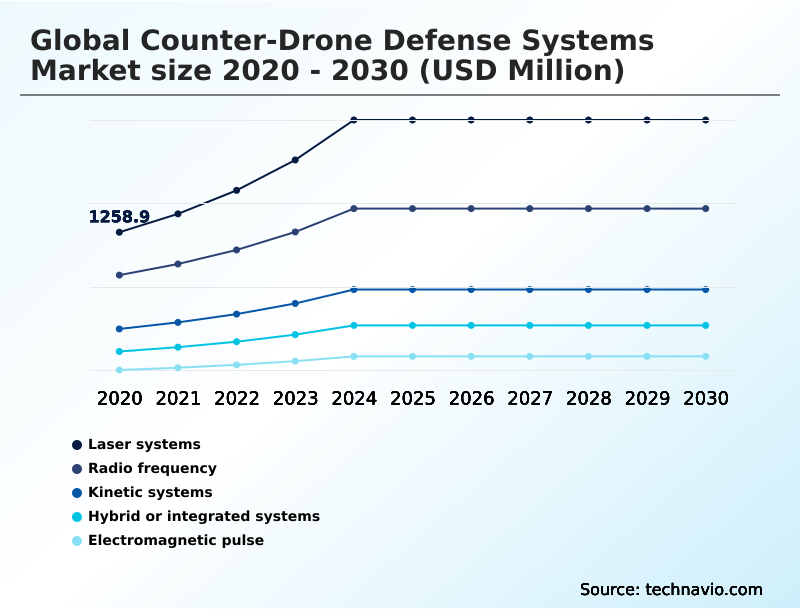
North America accounts for 40.2% of incremental growth during the forecast period. The Laser systems segment by Technology was valued at USD 2.14 billion in 2024, while the Fixed-site systems segment holds the largest revenue share by Deployment.
The market is projected to grow by USD 12.82 billion from 2020 to 2030, with USD 9.86 billion of the growth expected during the forecast period of 2025 to 2030.
Get Key Insights on Market Forecast (PDF) Request Free Sample
Counter-Drone Defense Systems Market Overview
The counter-drone defense systems market is defined by an escalating need to secure airspace against increasingly sophisticated and accessible unmanned platforms. This demand propels a market expansion of 19.1% year-over-year, with North America leading procurement efforts. The core of modern solutions lies in integrating diverse sensor inputs within advanced command and control systems to deliver reliable, automated threat mitigation. For instance, a major international airport, previously facing costly disruptions from drone incursions, can deploy an integrated airspace awareness system. This network, combining radio frequency scanners, optical tracking networks, and acoustic sensors, feeds data into an AI-driven platform for threat classification. In practice, such a system can reduce false alarm rates from environmental clutter like bird activity by over 70%, enabling security teams to focus on genuine threats and maintain operational continuity. This shift toward intelligent, multi-layered defense is critical for protecting national infrastructure and ensuring public safety, pushing vendors to innovate beyond simple detection to full-spectrum neutralization capabilities.
Drivers, Trends, and Challenges in the Counter-Drone Defense Systems Market
The operational complexity of deploying effective countermeasures is a central theme in the market, especially concerning counter-UAS for urban environment protection, where legal frameworks for civilian drone mitigation and the need to avoid RF jamming without collateral interference are paramount.
The cost per engagement of kinetic vs laser systems is a critical factor in procurement, influencing the design of multi-layered defenses. Technologically, the focus is on integrating AI for drone threat classification and improving c-uas sensor fusion for reducing false positives, especially when differentiating drones from biological entities like birds.
A significant challenge is defending against GPS-denied autonomous drones and countering encrypted drone communication protocols, which renders many legacy electronic warfare systems obsolete. This perpetual arms race necessitates the standardization of open C-uas architectures to allow for rapid upgrades and ensure the interoperability of multi-vendor c-uas systems.
The challenges of defending against autonomous swarms are driving innovation in both directed energy, which faces issues like thermal management for directed energy weapons, and specialized man-portable systems for infantry squad protection.
Securing airports from drone incursions and hardening critical infrastructure against UAV threats require robust networks, while deploying c-uas on naval vessels adds environmental and integration complexities, and scaling c-uas for large public events introduces unique command and control issues. Finally, the cybersecurity of counter-drone defense networks themselves has become a primary concern for operators.
Primary Growth Driver: Market expansion is principally driven by escalating threats from asymmetric warfare, fueled by the proliferation of low-cost, weaponized unmanned aerial vehicles among non-state actors.
Demand is fundamentally driven by the dual pressures of asymmetric warfare and the need for critical infrastructure protection. The proliferation of inexpensive, commercially available drones has created significant vulnerabilities, forcing a 19.1% year-over-year market expansion.
In response, operators are investing in comprehensive airspace awareness systems that rely on advanced sensor fusion algorithms.
These systems integrate data from multiple sources, including electro-optical sensors, infrared sensors, acoustic sensors, and optical tracking networks, into a unified command and control system.
This AI-driven approach enables the rapid and accurate classification of threats, a critical capability for both military asymmetric warfare countermeasures and civilian security details protecting sensitive facilities.
The ability of modern systems to provide a clear operational picture with minimal false alarms is a primary factor compelling investment from defense and commercial buyers.
Emerging Market Trend: The market is trending toward the integration of directed energy weapons, including high-energy lasers. These systems provide a cost-effective solution with virtually unlimited engagement capacity against aerial threats.
Key market trends reflect a strategic shift toward more scalable and precise mitigation technologies. The integration of directed energy weapons and high-energy lasers is accelerating, driven by their effectiveness as low-collateral damage systems and their low cost-per-engagement. Concurrently, there is a strong push toward the miniaturization of technology, leading to the proliferation of man-portable counter-unmanned systems for tactical units.
This trend equips infantry and law enforcement with immediate, localized defensive capabilities. A third pivotal development is the industry-wide adoption of open systems architectures.
This move toward modular defense platforms, often utilizing software-defined radios, allows end-users to integrate best-in-class components from multiple vendors, preventing vendor lock-in and significantly reducing lifecycle costs while ensuring systems can be rapidly upgraded to counter new threats.
Key Industry Challenge: A primary market challenge is the stringent and complex web of regulatory frameworks and legal ambiguities governing civilian airspace, which restricts the deployment of effective mitigation technologies.
Market growth faces significant constraints from both technological and regulatory fronts. The rapid evolution of threats, particularly the emergence of autonomous swarm technologies, challenges the effectiveness of existing kinetic interception methods, which are often limited by their rate of fire. Furthermore, hostile actors are employing encrypted communications and GPS spoofing techniques, rendering traditional electronic warfare jamming less effective.
A major operational hurdle is legacy system integration, as incorporating modern, data-intensive C-UAS platforms into older command and control frameworks is both costly and technically complex.
These issues are compounded by restrictive legal frameworks that limit the use of kinetic and non-kinetic mitigation in urban environment operations, creating a difficult path to deployment for commercial and municipal entities seeking to protect public spaces and critical assets.
Explore Full Market Dynamics Analysis Request Free Sample
Counter-Drone Defense Systems Market Segmentation
The counter-drone defense systems industry research report provides comprehensive data including region-wise segment analysis, with forecasts and analysis for the period 2026-2030, as well as historical data from 2020-2024 for the following segments.
Technology Segment Analysis
The laser systems segment is estimated to witness significant growth during the forecast period.
Laser systems represent a critical technology segment, accounting for over 41% of the market, where procurement decisions are driven by the need for low-collateral damage engagements.
These directed energy weapons, including high-energy lasers, offer a sustainable alternative to kinetic defeat mechanisms by providing a deep magazine against threats like autonomous swarm attacks.
Their operational value lies in the extremely low cost per engagement, a key consideration for entities building a multi-layered defense architecture. However, system integrators must address performance degradation in adverse weather and manage significant thermal loads.
The primary application remains the protection of high-value static assets where the benefits of non-kinetic neutralization outweigh the complex installation requirements, a factor heavily influencing their adoption under strict federal airspace regulations.
The Laser systems segment was valued at USD 2.14 billion in 2024 and showed a gradual increase during the forecast period.
Counter-Drone Defense Systems Market by Region: North America Leads with 40.2% Growth Share
North America is estimated to contribute 40.2% to the growth of the global market during the forecast period.
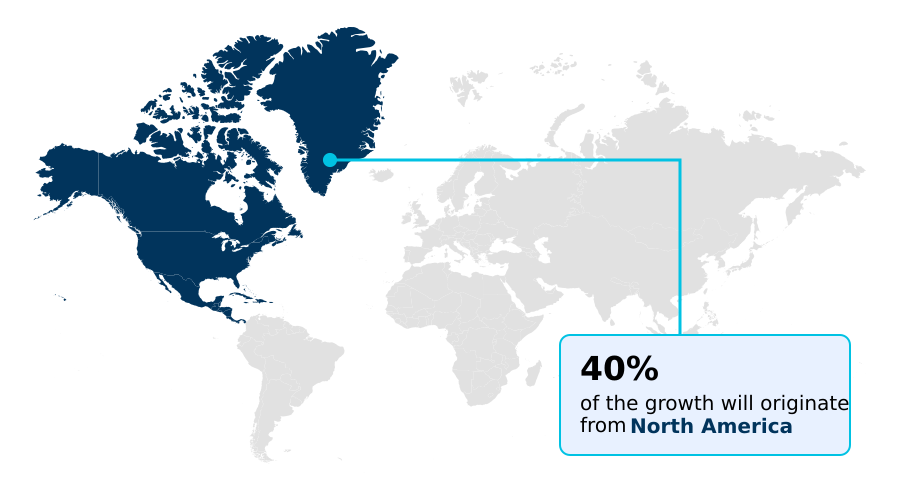
The geographic landscape of the market is dominated by North America, which accounts for over 40% of the incremental growth, largely due to substantial defense spending in the US.
This region prioritizes the deployment of fixed-site systems to protect critical national infrastructure and vehicle-mounted systems for military convoy protection.
In contrast, the APAC region is the fastest-growing market, with nations focusing on securing maritime borders and contested territories, driving demand for naval-based systems and long-range UAV-based systems.
European nations focus on low-collateral damage systems suitable for urban environments, emphasizing radio frequency jamming techniques that comply with strict telecommunications regulations. The Middle East demonstrates high demand for solutions providing loitering munitions defense.
This regional divergence in security priorities shapes technology procurement, from sophisticated C2 integration in North America to rugged, rapidly deployable platforms in South America.
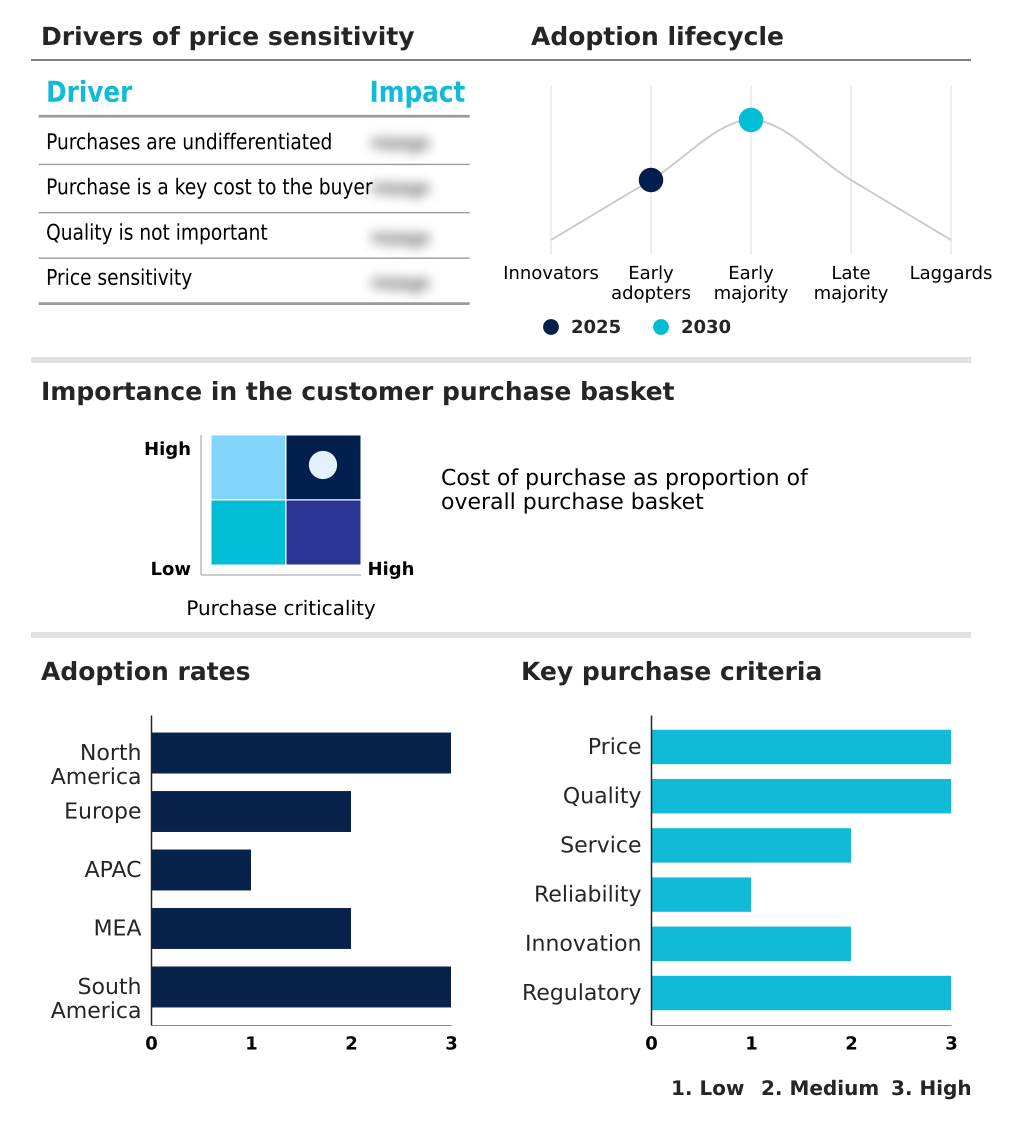
Customer Landscape Analysis for the Counter-Drone Defense Systems Market
The counter-drone defense systems market forecasting report includes the adoption lifecycle of the market, covering from the innovator’s stage to the laggard’s stage. It focuses on adoption rates in different regions based on penetration. Furthermore, the counter-drone defense systems market report also includes key purchase criteria and drivers of price sensitivity to help companies evaluate and develop their market growth analysis strategies.
Competitive Landscape of the Counter-Drone Defense Systems Market
Companies are implementing various strategies, such as strategic alliances, partnerships, mergers and acquisitions, geographical expansion, and product/service launches, to enhance their presence in the counter-drone defense systems market industry.
AeroVironment Inc. - Vendors provide integrated systems featuring sensor fusion, command and control software, and a range of kinetic and non-kinetic effectors for comprehensive, multi-layered airspace protection.
The industry research and growth report includes detailed analyses of the competitive landscape of the market and information about key companies, including:
- AeroVironment Inc.
- Anduril Industries Inc.
- ASELSAN AS
- Axon Enterprise Inc.
- BAE Systems Plc
- DroneShield Ltd.
- Echodyne Corp.
- Elbit Systems Ltd.
- Fortem Technologies
- Israel Aerospace Ltd.
- L3Harris Technologies Inc.
- Leonardo S.p.A.
- Lockheed Martin Corp.
- Northrop Grumman Corp.
- Rafael Advanced Defense Ltd.
- Rheinmetall AG
- RTX Corp.
- Saab AB
- SRC Inc.
- Thales Group
Qualitative and quantitative analysis of companies has been conducted to help clients understand the wider business environment as well as the strengths and weaknesses of key industry players. Data is qualitatively analyzed to categorize companies as pure play, category-focused, industry-focused, and diversified; it is quantitatively analyzed to categorize companies as dominant, leading, strong, tentative, and weak.
Recent Developments in the Counter-Drone Defense Systems Market
- In May, 2025, AeroVironment Inc. announced its acquisition of BlueHalo for approximately USD 4.1 billion, a move that significantly expands its portfolio in counter-drone systems, directed energy weapons, and autonomous platforms.
- In April, 2025, Rafael Advanced Defense Ltd. entered a strategic partnership with Sentrycs to integrate its Drone Dome system with Sentrycs' Cyber-over-RF technology, enhancing its electronic warfare and signal intelligence capabilities.
- In March, 2025, Anduril Industries Inc. secured an initial contract of approximately USD 87 million with the U.S. Army to scale its Lattice software platform for counter-UAS operations, improving autonomous threat detection and response.
- In February, 2025, ParaZero Technologies Ltd. signed a strategic cooperation agreement with BonV Aero to advance the development and deployment of autonomous counter-drone solutions for the military and civil markets in India.
Research Analyst Overview: Counter-Drone Defense Systems Market
The market is rapidly moving beyond standalone detection hardware toward fully integrated, multi-layered defense architectures. Boardroom-level investment decisions now weigh the high capital expenditure of acquiring platforms with directed energy weapons against the operational risks of relying solely on radio frequency jamming, which is often constrained by telecommunications regulations like those from the FCC.
The core technological challenge is achieving effective sensor fusion, combining inputs from electro-optical and infrared sensors with advanced radar to reduce false positives. A key differentiator is the sophistication of the command and control system, which must automate threat classification and recommend an optimal response, whether it is non-kinetic neutralization or a kinetic defeat mechanism.
Procurement is increasingly governed by open systems architectures, allowing for the integration of best-in-class components. For chief security officers, the total cost of ownership calculation must now account for the continuous software updates needed to counter evolving threats like autonomous swarm technologies, making platform adaptability a primary vendor qualification criterion.
Dive into Technavio’s robust research methodology, blending expert interviews, extensive data synthesis, and validated models for unparalleled Counter-Drone Defense Systems Market insights. See full methodology.
| Market Scope | |
|---|---|
| Page number | 325 |
| Base year | 2025 |
| Historic period | 2020-2024 |
| Forecast period | 2026-2030 |
| Growth momentum & CAGR | Accelerate at a CAGR of 21.1% |
| Market growth 2026-2030 | USD 9858.2 million |
| Market structure | Fragmented |
| YoY growth 2025-2026(%) | 19.1% |
| Key countries | US, Canada, Mexico, UK, Germany, France, Italy, Spain, The Netherlands, China, India, Japan, South Korea, Australia, Indonesia, Israel, Saudi Arabia, UAE, Turkey, South Africa, Brazil, Argentina and Colombia |
| Competitive landscape | Leading Companies, Market Positioning of Companies, Competitive Strategies, and Industry Risks |
Counter-Drone Defense Systems Market: Key Questions Answered in This Report
-
What is the expected growth of the Counter-Drone Defense Systems Market between 2026 and 2030?
-
The Counter-Drone Defense Systems Market is expected to grow by USD 9.86 billion during 2026-2030, registering a CAGR of 21.1%. Year-over-year growth in 2026 is estimated at 19.1%%. This acceleration is shaped by escalating threats from asymmetric warfare, which is intensifying demand across multiple end-use verticals covered in the report.
-
-
What segmentation does the market report cover?
-
The report is segmented by Technology (Laser systems, Radio frequency, Kinetic systems, Hybrid or integrated systems, and Electromagnetic pulse), Deployment (Fixed-site systems, Portable systems, Vehicle-mounted systems, UAV-based systems, and Naval-based systems), End-user (Military and defense, Commercial or civil, Government and law enforcement, and Others) and Geography (North America, Europe, APAC, Middle East and Africa, South America). Among these, the Laser systems segment is estimated to witness significant growth during the forecast period, driven by rising adoption across key application areas. Each segment includes detailed qualitative and quantitative analysis, along with historical data from 2020-2024 and forecasts through 2030 with year-over-year growth rates.
-
-
Which regions are analyzed in the report?
-
The report covers North America, Europe, APAC, Middle East and Africa and South America. North America is estimated to contribute 40.2% to market growth during the forecast period. Country-level analysis includes US, Canada, Mexico, UK, Germany, France, Italy, Spain, The Netherlands, China, India, Japan, South Korea, Australia, Indonesia, Israel, Saudi Arabia, UAE, Turkey, South Africa, Brazil, Argentina and Colombia, with dedicated market size tables and year-over-year growth for each.
-
-
What are the key growth drivers and market challenges?
-
The primary driver is escalating threats from asymmetric warfare, which is accelerating investment and industry demand. The main challenge is stringent regulatory frameworks and complex legal ambiguities regarding airspace , creating operational barriers for key market participants. The report quantifies the impact of each driver and challenge across 2026 and 2030 with comparative analysis.
-
-
Who are the major players in the Counter-Drone Defense Systems Market?
-
Key vendors include AeroVironment Inc., Anduril Industries Inc., ASELSAN AS, Axon Enterprise Inc., BAE Systems Plc, DroneShield Ltd., Echodyne Corp., Elbit Systems Ltd., Fortem Technologies, Israel Aerospace Ltd., L3Harris Technologies Inc., Leonardo S.p.A., Lockheed Martin Corp., Northrop Grumman Corp., Rafael Advanced Defense Ltd., Rheinmetall AG, RTX Corp., Saab AB, SRC Inc. and Thales Group. The report provides qualitative and quantitative analysis categorizing companies as dominant, leading, strong, tentative, and weak based on their market positioning. Company profiles include business segment analysis, SWOT assessment, key offerings, and recent strategic developments.
-
Counter-Drone Defense Systems Market Research Insights
Market dynamics are heavily shaped by operational requirements for diverse deployment scenarios, from fixed-site systems at critical facilities to mobile platforms. The need for asymmetric warfare countermeasures drives investment in adaptable technologies that can be integrated with existing security infrastructure, a process complicated by challenges in legacy system integration.
In border security, for example, vehicle-mounted systems are deployed to provide a mobile defensive bubble, a different application than the UAV-based systems used for wide-area surveillance. Regionally, the market in APAC is expanding at a rate nearly 8% faster than in North America, driven by different geopolitical pressures.
This growth compels a focus on modular defense platforms that can be customized for specific threats, such as loitering munitions defense, and integrated using open architecture standards to ensure interoperability across allied forces.
We can help! Our analysts can customize this counter-drone defense systems market research report to meet your requirements.
 RIA -
RIA - 
