Southeast Asia Data Center Market Analysis, Size, and Forecast 2026-2030: APAC (Indonesia), Southeast Asia

Southeast Asia Data Center Market Analysis, Size, and Forecast 2026-2030:
APAC (Indonesia), Southeast Asia

Published: May 2026 227 Pages SKU: IRTNTR43167

Market Overview at a Glance

$4.05 B
Market Opportunity
6.8%
CAGR 2025 - 2030
6.4%
YoY growth 2025-2026(%)
$1.51 B
BFSI segment 2024

Southeast Asia Data Center Market Size 2026-2030

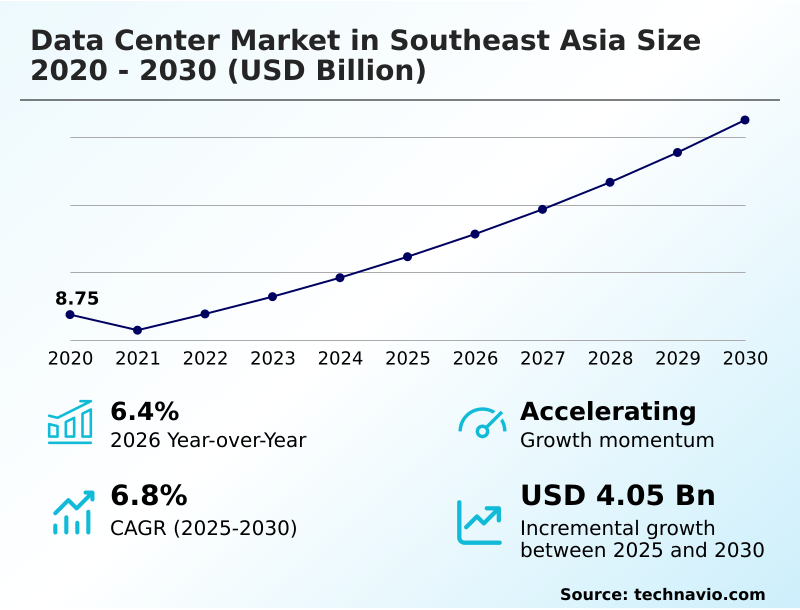
The southeast asia data center market size is valued to increase by USD 4.05 billion, at a CAGR of 6.8% from 2025 to 2030. Escalation of cross border digital integration and regional connectivity hubs will drive the southeast asia data center market.

Major Market Trends & Insights

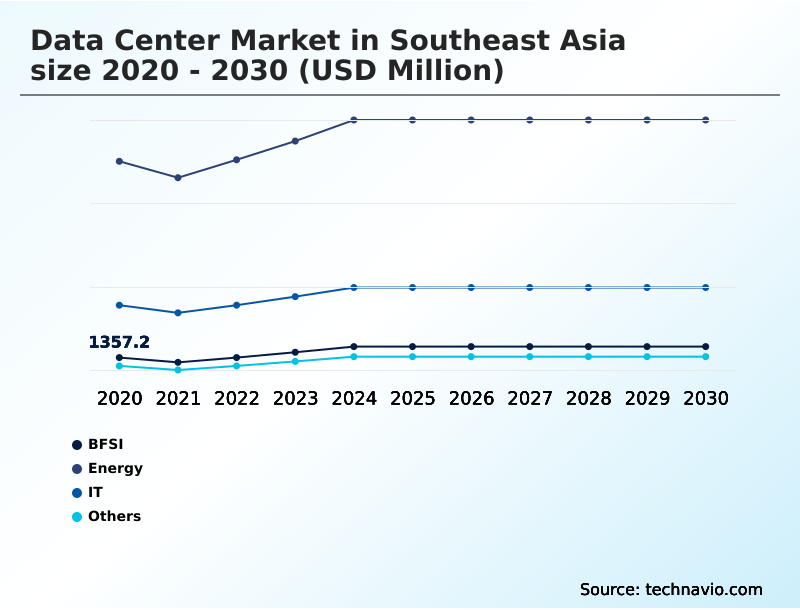
  • By End-user - BFSI segment was valued at USD 1.51 billion in 2024
  • By Component - IT infrastructure segment accounted for the largest market revenue share in 2024

Market Size & Forecast

  • Market Opportunities: USD 5.76 billion
  • Market Future Opportunities: USD 4.05 billion
  • CAGR from 2025 to 2030 : 6.8%

Market Summary

  • The data center market in Southeast Asia is undergoing a rapid industrialization, driven by the critical need to support the region's burgeoning digital economies. This expansion is fueled by the institutionalization of artificial intelligence workloads and stringent data sovereignty laws, compelling a shift towards high-density computing environments.
  • A key trend is the transition to advanced infrastructure capable of supporting significant power and cooling requirements, including the widespread adoption of liquid cooling technologies. However, this growth is met with challenges such as power grid limitations and a shortage of skilled engineering talent.
  • As a real-world scenario, a multinational manufacturing firm might establish edge data centers to run its digital twin and industrial IoT platforms. This requires localized, low-latency processing to reduce disruptions on the factory floor, where a mere 5% improvement in predictive maintenance accuracy can prevent millions in losses from unscheduled downtime.
  • The market's evolution is defined by this balance between deploying cutting-edge technology and overcoming fundamental resource constraints to build a resilient digital backbone.

What will be the Size of the Southeast Asia Data Center Market during the forecast period?

Get Key Insights on Market Forecast (PDF) Get Free Sample

How is the Southeast Asia Data Center Market Segmented?

The southeast asia data center industry research report provides comprehensive data (region-wise segment analysis), with forecasts and estimates in "USD million" for the period 2026-2030, as well as historical data from 2020-2024 for the following segments.

  • End-user
    • BFSI
    • Energy
    • IT
    • Others
  • Component
    • IT infrastructure
    • Electrical construction
    • Mechanical construction
    • General construction
    • Security solutions
  • Type
    • Traditional
    • Modular
    • Containerized
  • Geography
    • Southeast Asia

By End-user Insights

The bfsi segment is estimated to witness significant growth during the forecast period.

The banking, financial services, and insurance (BFSI) segment is a primary consumer of data center capacity, driven by the sector's rapid shift to digital-first financial ecosystems.

Financial institutions are migrating core systems to decentralized cloud architectures and specialized colocation services to enhance resilience and meet demand for real-time transactional capabilities.

Stringent data localization mandates necessitate the use of localized IT infrastructure to ensure financial data remains within national borders, demanding robust security solutions and data governance.

This has led to the adoption of zero-trust security frameworks and biometric access controls to protect sensitive information.

Integrating artificial intelligence for fraud detection has boosted computational requirements, with successful implementations reducing fraudulent transaction processing by over 15%, underscoring the need for high-performance, secure digital environments.

Get Free Sample

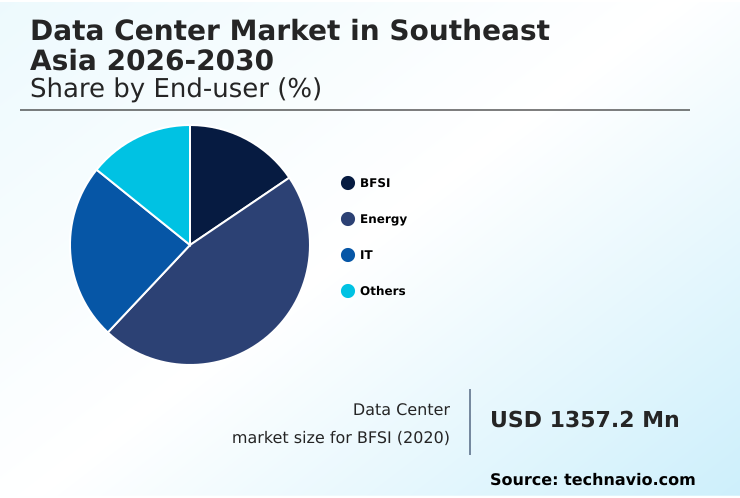
The BFSI segment was valued at USD 1.51 billion in 2024 and showed a gradual increase during the forecast period.

Get Free Sample

Market Dynamics

Our researchers analyzed the data with 2025 as the base year, along with the key drivers, trends, and challenges. A holistic analysis of drivers will help companies refine their marketing strategies to gain a competitive advantage.

  • The strategic deployment of digital infrastructure is evolving, driven by the convergence of high-performance computing and sustainability mandates. Decisions around financial modeling for data center investment are now intrinsically linked to long-term power usage effectiveness in tropical climates and the ability to navigate complex cross-border data flow regulations.
  • As enterprises adopt ai-ready data center design principles, the focus shifts to deploying liquid cooling for high-density servers and ensuring robust data center infrastructure management tools are in place. This pivot is not just about technology but also about compliance and risk, with data sovereignty and cloud infrastructure becoming a board-level concern.
  • The integration of sustainable power sources for data centers is now a critical component of corporate strategy, often verified through a data center environmental impact assessment. Effective data center risk management and compliance, supported by multi-tier data center security protocols and rigorous site selection criteria, are paramount.
  • Facilities designed with modern power efficiency strategies can achieve up to a 20% greater efficiency, significantly reducing operational costs. Furthermore, talent development for data center operations is crucial for managing this sophisticated ecosystem, from initial building information modeling for data centers to eventual data center decommissioning and recycling.

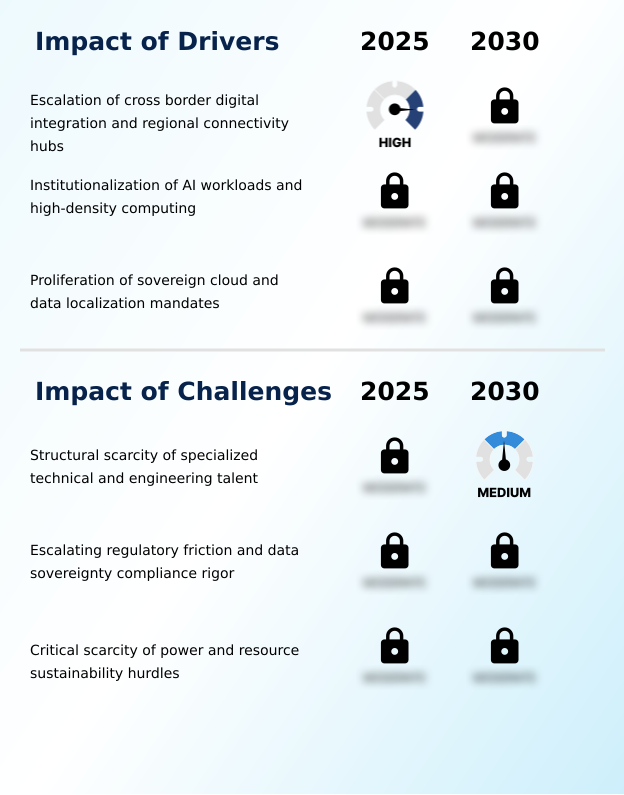
What are the key market drivers leading to the rise in the adoption of Southeast Asia Data Center Industry?

  • The escalation of cross-border digital integration and the development of regional connectivity hubs are key drivers for the market.

  • The institutionalization of artificial intelligence is the primary driver reshaping infrastructure requirements, mandating a move toward AI-ready infrastructure. The proliferation of graphics processing units (GPUs) for high-performance computing clusters has created unprecedented demand for high-density computing environments.
  • Consequently, facilities are being re-engineered to support high-density power configurations, with rack power needs jumping from 12 kilowatts to over 30 kilowatts. This shift necessitates advanced electrical construction and mechanical construction to implement direct-to-chip technologies for cooling.
  • The demand for specialized technical talent to manage these complex systems has surged, as organizations recognize that achieving digital transformation goals is directly tied to their ability to deploy and maintain this next-generation hardware.
  • This trend is causing a strategic pivot where investment is now prioritized for projects that enhance national AI capabilities.

What are the market trends shaping the Southeast Asia Data Center Industry?

  • Advancements in sustainable and sovereign energy integration are an upcoming market trend. This involves a strategic shift toward green power sources and enhanced data residency.

  • A primary trend shaping the market is the dual focus on sustainable energy integration and digital sovereignty. To align with aggressive net-zero commitments, operators are increasingly adopting renewable energy certificates and exploring green hydrogen as a power source, which directly influences operational expenditure.
  • This push for sustainability is reflected in facility design, where achieving a low power usage effectiveness (PUE) is a key performance metric, with some advanced facilities improving PUE by 15% through innovative cooling. Concurrently, sovereign cloud initiatives are gaining momentum, driven by government mandates for data residency.
  • This requires infrastructure that ensures digital sovereignty, compelling operators to navigate complex power purchase agreements and regulations governing environmental performance, thereby creating a new competitive benchmark for green and sovereign-ready data centers.

What challenges does the Southeast Asia Data Center Industry face during its growth?

  • A structural scarcity of specialized technical and engineering talent presents a key challenge to industry growth.

  • A critical challenge is the structural scarcity of power and the associated resource sustainability hurdles, creating significant bottlenecks for new projects. The time required to secure grid connectivity can now exceed four years in prime locations, severely impacting data center commissioning timelines.
  • This is compounded by the operational strain of ensuring business continuity with increasingly unreliable power grids, elevating the importance of robust uninterruptible power supply systems and backup power and ups systems. The high ambient heat necessitates energy-intensive thermal management solutions, which strains both power and water resources.
  • Furthermore, ensuring fault-tolerant architectures that can withstand both physical and cyber threats, such as supply chain attacks, adds another layer of complexity. These infrastructure-level challenges mean that even with advanced technologies like hyper-converged infrastructure, the physical limitations of general construction and resource availability can impede growth.

Exclusive Technavio Analysis on Customer Landscape

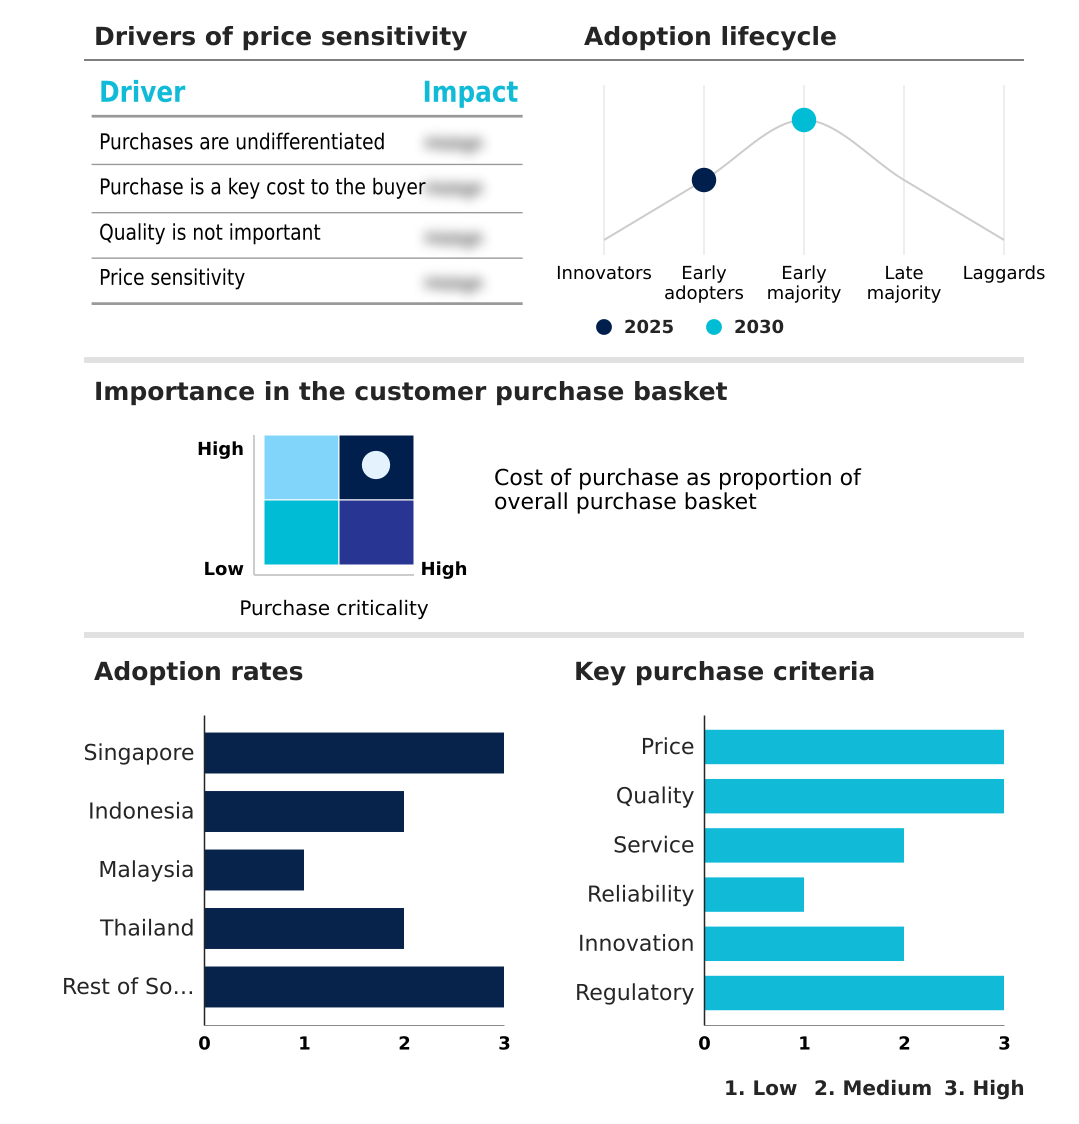
The southeast asia data center market forecasting report includes the adoption lifecycle of the market, covering from the innovator’s stage to the laggard’s stage. It focuses on adoption rates in different regions based on penetration. Furthermore, the southeast asia data center market report also includes key purchase criteria and drivers of price sensitivity to help companies evaluate and develop their market growth analysis strategies.

Customer Landscape of Southeast Asia Data Center Industry

Competitive Landscape

Companies are implementing various strategies, such as strategic alliances, southeast asia data center market forecast, partnerships, mergers and acquisitions, geographical expansion, and product/service launches, to enhance their presence in the industry.

ABB Ltd. - Providers deliver scalable colocation, hyperscale infrastructure, and interconnection services, focusing on power and cooling efficiency for high-density computing environments.

The industry research and growth report includes detailed analyses of the competitive landscape of the market and information about key companies, including:

  • ABB Ltd.
  • Bridge Data Centres
  • Caterpillar Inc.
  • Cisco Systems Inc.
  • Dell Technologies Inc.
  • Delta Electronics Inc.
  • Digital Realty Trust Inc.
  • EdgeConneX Inc.
  • Equinix Inc.
  • GDS Holdings Ltd.
  • Global Switch Ltd.
  • Iron Mountain Inc.
  • NTT DATA Corp.
  • Princeton Digital Group
  • Schneider Electric SE
  • Singapore Telecom Ltd.
  • SpaceDC
  • STT GDC Pte Ltd.
  • True Internet Data Center Co.
  • Vantage Data Centers Management

Qualitative and quantitative analysis of companies has been conducted to help clients understand the wider business environment as well as the strengths and weaknesses of key industry players. Data is qualitatively analyzed to categorize companies as pure play, category-focused, industry-focused, and diversified; it is quantitatively analyzed to categorize companies as dominant, leading, strong, tentative, and weak.

Recent Development and News in Southeast asia data center market

  • In May, 2025, Equinix Inc. integrated advanced sustainability features, including high-efficiency power arrays, into its JK1 facility in Jakarta to align with regional green energy mandates.
  • In April, 2025, Mobile-health Network Solutions, in partnership with specialized infrastructure investors, initiated the development of a sixty-megawatt artificial intelligence data center campus in Sarawak, Malaysia, designed to host hyperscale workloads.
  • In March, 2025, Vantage Data Centers Management partnered with the Malaysia Forest Fund to advance sustainability initiatives and pursue carbon-neutral goals within its hyperscale data center campuses in the region.
  • In January, 2025, Digital Realty Trust Inc. expanded its presence by executing an agreement to acquire CSF Advisers, which includes a data center in Cyberjaya, Malaysia, capable of supporting an additional fourteen megawatts of IT load.

Dive into Technavio’s robust research methodology, blending expert interviews, extensive data synthesis, and validated models for unparalleled Southeast Asia Data Center Market insights. See full methodology.

Market Scope
Page number 227
Base year 2025
Historic period 2020-2024
Forecast period 2026-2030
Growth momentum & CAGR Accelerate at a CAGR of 6.8%
Market growth 2026-2030 USD 4049.0 million
Market structure Fragmented
YoY growth 2025-2026(%) 6.4%
Key countries Singapore, Indonesia, Malaysia, Thailand and Rest of Southeast Asia
Competitive landscape Leading Companies, Market Positioning of Companies, Competitive Strategies, and Industry Risks

Request Free Sample

Research Analyst Overview

  • The data center market in southeast asia is defined by a strategic industrialization toward supporting high-density computing and artificial intelligence workloads. This transition requires significant capital investment in not just physical space but specialized technologies, making it a key boardroom-level decision. The market is shifting from traditional colocation services to integrated platforms offering hyper-converged infrastructure, software-defined networking, and carrier-neutral connectivity.
  • This evolution is driven by the need to support graphics processing units and high-performance computing clusters, which in turn necessitates advanced thermal management solutions like direct-to-chip technologies. Modern facilities are now being engineered for rack densities exceeding 30 kilowatts, a nearly threefold increase from legacy standards, compelling the use of liquid cooling technologies.
  • This entire ecosystem is underpinned by robust subsea cable systems, terrestrial fiber networks, and stringent data localization mandates, which drive the adoption of sovereign cloud initiatives and advanced data governance. As a result, the focus is on creating resilient, high-performance environments that can guarantee business continuity.

What are the Key Data Covered in this Southeast Asia Data Center Market Research and Growth Report?

  • What is the expected growth of the Southeast Asia Data Center Market between 2026 and 2030?

    • USD 4.05 billion, at a CAGR of 6.8%

  • What segmentation does the market report cover?

    • The report is segmented by End-user (BFSI, Energy, IT, and Others), Component (IT infrastructure, Electrical construction, Mechanical construction, General construction, and Security solutions), Type (Traditional, Modular, and Containerized) and Geography (Southeast Asia)

  • Which regions are analyzed in the report?

    • Southeast Asia

  • What are the key growth drivers and market challenges?

    • Escalation of cross border digital integration and regional connectivity hubs, Structural scarcity of specialized technical and engineering talent

  • Who are the major players in the Southeast Asia Data Center Market?

    • ABB Ltd., Bridge Data Centres, Caterpillar Inc., Cisco Systems Inc., Dell Technologies Inc., Delta Electronics Inc., Digital Realty Trust Inc., EdgeConneX Inc., Equinix Inc., GDS Holdings Ltd., Global Switch Ltd., Iron Mountain Inc., NTT DATA Corp., Princeton Digital Group, Schneider Electric SE, Singapore Telecom Ltd., SpaceDC, STT GDC Pte Ltd., True Internet Data Center Co. and Vantage Data Centers Management

Market Research Insights

  • The market's dynamics are shaped by a strategic pivot toward AI-ready infrastructure, compelling new standards in facility design and engineering. As enterprises pursue digital transformation goals, demand has intensified for high-density power configurations to support advanced workloads, with some facilities seeing a threefold increase in rack power requirements.
  • This shift necessitates robust backup power and UPS systems to ensure mission-critical operations remain uninterrupted. Concurrently, multi-market expansion strategies are being adopted to navigate resource constraints and improve regional connectivity hubs. This sophisticated environment requires specialized technical talent to manage complex systems, where optimized power purchase agreements can reduce operational expenditure by more than 10%.
  • Ultimately, success hinges on balancing capital expenditure with scalable, resilient, and compliant infrastructure.

We can help! Our analysts can customize this southeast asia data center market research report to meet your requirements.

Get in touch

1. Executive Summary

1.1 Market overview

Executive Summary - Chart on Market Overview
Executive Summary - Data Table on Market Overview
Executive Summary - Chart on Country Market Characteristics
Executive Summary - Chart on Market by Geography
Executive Summary - Chart on Market Segmentation by End-user
Executive Summary - Chart on Market Segmentation by Component
Executive Summary - Chart on Market Segmentation by Type
Executive Summary - Chart on Incremental Growth
Executive Summary - Data Table on Incremental Growth
Executive Summary - Chart on Company Market Positioning

2. Technavio Analysis

2.1 Analysis of price sensitivity, lifecycle, customer purchase basket, adoption rates, and purchase criteria

2.2 Criticality of inputs and Factors of differentiation

Overview on criticality of inputs and factors of differentiation

2.3 Factors of disruption

Overview on factors of disruption

2.4 Impact of drivers and challenges

Impact of drivers and challenges in 2025 and 2030

3. Market Landscape

3.1 Market ecosystem

Chart on Parent Market
Data Table on - Parent Market

3.2 Market characteristics

Chart on Market characteristics analysis

3.3 Value chain analysis

Chart on Value chain analysis

4. Market Sizing

4.1 Market definition

Data Table on Offerings of companies included in the market definition

4.2 Market segment analysis

Market segments

4.3 Market size 2025

4.4 Market outlook: Forecast for 2025-2030

Chart on Southeast Asia - Market size and forecast 2025-2030 ($ million)
Data Table on Regional - Market size and forecast 2025-2030 ($ million)
Chart on Southeast Asia: Year-over-year growth 2025-2030 (%)
Data Table on Regional - Market size and forecast 2025-2030 ($ million)

5. Historic Market Size

5.1 Data Center Market in Southeast Asia 2020 - 2024

Historic Market Size - Data Table on Data Center Market in Southeast Asia 2020 - 2024 ($ million)

5.2 End-user segment analysis 2020 - 2024

Historic Market Size - End-user Segment 2020 - 2024 ($ million)

5.3 Component segment analysis 2020 - 2024

Historic Market Size - Component Segment 2020 - 2024 ($ million)

5.4 Type segment analysis 2020 - 2024

Historic Market Size - Type Segment 2020 - 2024 ($ million)

5.5 Geography segment analysis 2020 - 2024

Historic Market Size - Geography Segment 2020 - 2024 ($ million)

6. Qualitative Analysis

6.1 Impact of AI in data center market in Southeast Asia

6.2 Impact of geopolitical conflict on data center market in Southeast Asia

7. Five Forces Analysis

7.1 Five forces summary

Five forces analysis - Comparison between 2025 and 2030

7.2 Bargaining power of buyers

Bargaining power of buyers - Impact of key factors 2025 and 2030

7.3 Bargaining power of suppliers

Bargaining power of suppliers - Impact of key factors in 2025 and 2030

7.4 Threat of new entrants

Threat of new entrants - Impact of key factors in 2025 and 2030

7.5 Threat of substitutes

Threat of substitutes - Impact of key factors in 2025 and 2030

7.6 Threat of rivalry

Threat of rivalry - Impact of key factors in 2025 and 2030

7.7 Market condition

Chart on Market condition - Five forces 2025 and 2030

8. Market Segmentation by End-user

8.1 Market segments

Chart on End-user - Market share 2025-2030 (%)
Data Table on End-user - Market share 2025-2030 (%)

8.2 Comparison by End-user

Chart on Comparison by End-user
Data Table on Comparison by End-user

8.3 BFSI - Market size and forecast 2025-2030

Chart on BFSI - Market size and forecast 2025-2030 ($ million)
Data Table on BFSI - Market size and forecast 2025-2030 ($ million)
Chart on BFSI - Year-over-year growth 2025-2030 (%)
Data Table on BFSI - Year-over-year growth 2025-2030 (%)

8.4 Energy - Market size and forecast 2025-2030

Chart on Energy - Market size and forecast 2025-2030 ($ million)
Data Table on Energy - Market size and forecast 2025-2030 ($ million)
Chart on Energy - Year-over-year growth 2025-2030 (%)
Data Table on Energy - Year-over-year growth 2025-2030 (%)

8.5 IT - Market size and forecast 2025-2030

Chart on IT - Market size and forecast 2025-2030 ($ million)
Data Table on IT - Market size and forecast 2025-2030 ($ million)
Chart on IT - Year-over-year growth 2025-2030 (%)
Data Table on IT - Year-over-year growth 2025-2030 (%)

8.6 Others - Market size and forecast 2025-2030

Chart on Others - Market size and forecast 2025-2030 ($ million)
Data Table on Others - Market size and forecast 2025-2030 ($ million)
Chart on Others - Year-over-year growth 2025-2030 (%)
Data Table on Others - Year-over-year growth 2025-2030 (%)

8.7 Market opportunity by End-user

Market opportunity by End-user ($ million)
Data Table on Market opportunity by End-user ($ million)

9. Market Segmentation by Component

9.1 Market segments

Chart on Component - Market share 2025-2030 (%)
Data Table on Component - Market share 2025-2030 (%)

9.2 Comparison by Component

Chart on Comparison by Component
Data Table on Comparison by Component

9.3 IT infrastructure - Market size and forecast 2025-2030

Chart on IT infrastructure - Market size and forecast 2025-2030 ($ million)
Data Table on IT infrastructure - Market size and forecast 2025-2030 ($ million)
Chart on IT infrastructure - Year-over-year growth 2025-2030 (%)
Data Table on IT infrastructure - Year-over-year growth 2025-2030 (%)

9.4 Electrical construction - Market size and forecast 2025-2030

Chart on Electrical construction - Market size and forecast 2025-2030 ($ million)
Data Table on Electrical construction - Market size and forecast 2025-2030 ($ million)
Chart on Electrical construction - Year-over-year growth 2025-2030 (%)
Data Table on Electrical construction - Year-over-year growth 2025-2030 (%)

9.5 Mechanical construction - Market size and forecast 2025-2030

Chart on Mechanical construction - Market size and forecast 2025-2030 ($ million)
Data Table on Mechanical construction - Market size and forecast 2025-2030 ($ million)
Chart on Mechanical construction - Year-over-year growth 2025-2030 (%)
Data Table on Mechanical construction - Year-over-year growth 2025-2030 (%)

9.6 General construction - Market size and forecast 2025-2030

Chart on General construction - Market size and forecast 2025-2030 ($ million)
Data Table on General construction - Market size and forecast 2025-2030 ($ million)
Chart on General construction - Year-over-year growth 2025-2030 (%)
Data Table on General construction - Year-over-year growth 2025-2030 (%)

9.7 Security solutions - Market size and forecast 2025-2030

Chart on Security solutions - Market size and forecast 2025-2030 ($ million)
Data Table on Security solutions - Market size and forecast 2025-2030 ($ million)
Chart on Security solutions - Year-over-year growth 2025-2030 (%)
Data Table on Security solutions - Year-over-year growth 2025-2030 (%)

9.8 Market opportunity by Component

Market opportunity by Component ($ million)
Data Table on Market opportunity by Component ($ million)

10. Market Segmentation by Type

10.1 Market segments

Chart on Type - Market share 2025-2030 (%)
Data Table on Type - Market share 2025-2030 (%)

10.2 Comparison by Type

Chart on Comparison by Type
Data Table on Comparison by Type

10.3 Traditional - Market size and forecast 2025-2030

Chart on Traditional - Market size and forecast 2025-2030 ($ million)
Data Table on Traditional - Market size and forecast 2025-2030 ($ million)
Chart on Traditional - Year-over-year growth 2025-2030 (%)
Data Table on Traditional - Year-over-year growth 2025-2030 (%)

10.4 Modular - Market size and forecast 2025-2030

Chart on Modular - Market size and forecast 2025-2030 ($ million)
Data Table on Modular - Market size and forecast 2025-2030 ($ million)
Chart on Modular - Year-over-year growth 2025-2030 (%)
Data Table on Modular - Year-over-year growth 2025-2030 (%)

10.5 Containerized - Market size and forecast 2025-2030

Chart on Containerized - Market size and forecast 2025-2030 ($ million)
Data Table on Containerized - Market size and forecast 2025-2030 ($ million)
Chart on Containerized - Year-over-year growth 2025-2030 (%)
Data Table on Containerized - Year-over-year growth 2025-2030 (%)

10.6 Market opportunity by Type

Market opportunity by Type ($ million)
Data Table on Market opportunity by Type ($ million)

11. Customer Landscape

11.1 Customer landscape overview

Analysis of price sensitivity, lifecycle, customer purchase basket, adoption rates, and purchase criteria

12. Geographic Landscape

12.1 Geographic segmentation

Chart on Market share by geography - 2025-2030 (%)
Data Table on Market share by geography - 2025-2030 (%)

12.2 Geographic comparison

Chart on Geographic comparison
Data Table on Geographic comparison

12.3 Singapore - Market size and forecast 2025-2030

Chart on Singapore - Market size and forecast 2025-2030 ($ million)
Data Table on Singapore - Market size and forecast 2025-2030 ($ million)
Chart on Singapore - Year-over-year growth 2025-2030 (%)
Data Table on Singapore - Year-over-year growth 2025-2030 (%)

12.4 Indonesia - Market size and forecast 2025-2030

Chart on Indonesia - Market size and forecast 2025-2030 ($ million)
Data Table on Indonesia - Market size and forecast 2025-2030 ($ million)
Chart on Indonesia - Year-over-year growth 2025-2030 (%)
Data Table on Indonesia - Year-over-year growth 2025-2030 (%)

12.5 Malaysia - Market size and forecast 2025-2030

Chart on Malaysia - Market size and forecast 2025-2030 ($ million)
Data Table on Malaysia - Market size and forecast 2025-2030 ($ million)
Chart on Malaysia - Year-over-year growth 2025-2030 (%)
Data Table on Malaysia - Year-over-year growth 2025-2030 (%)

12.6 Thailand - Market size and forecast 2025-2030

Chart on Thailand - Market size and forecast 2025-2030 ($ million)
Data Table on Thailand - Market size and forecast 2025-2030 ($ million)
Chart on Thailand - Year-over-year growth 2025-2030 (%)
Data Table on Thailand - Year-over-year growth 2025-2030 (%)

12.7 Rest of Southeast Asia - Market size and forecast 2025-2030

Chart on Rest of Southeast Asia - Market size and forecast 2025-2030 ($ million)
Data Table on Rest of Southeast Asia - Market size and forecast 2025-2030 ($ million)
Chart on Rest of Southeast Asia - Year-over-year growth 2025-2030 (%)
Data Table on Rest of Southeast Asia - Year-over-year growth 2025-2030 (%)

12.8 Market opportunity by geography

Market opportunity by geography ($ million)
Data Table on Market opportunity by geography ($ million)

13. Drivers, Challenges, and Opportunity

13.1 Market drivers

Escalation of cross border digital integration and regional connectivity hubs
Institutionalization of AI workloads and high-density computing
Proliferation of sovereign cloud and data localization mandates

13.2 Market challenges

Structural scarcity of specialized technical and engineering talent
Escalating regulatory friction and data sovereignty compliance rigor
Critical scarcity of power and resource sustainability hurdles

13.3 Impact of drivers and challenges

Impact of drivers and challenges in 2025 and 2030

13.4 Market opportunities

Advancements in sustainable and sovereign energy integration
Industrialization of AI-ready high-density infrastructure
Evolution of regional multi-market expansion strategies

14. Competitive Landscape

14.1 Overview

14.2

Overview on criticality of inputs and factors of differentiation

14.3 Landscape disruption

Overview on factors of disruption

14.4 Industry risks

Impact of key risks on business

15. Competitive Analysis

15.1 Companies profiled

Companies covered

15.2 Company ranking index

15.3 Market positioning of companies

Matrix on companies position and classification

15.4 ABB Ltd.

ABB Ltd. - Overview
ABB Ltd. - Business segments
ABB Ltd. - Key news
ABB Ltd. - Key offerings
ABB Ltd. - Segment focus
SWOT

15.5 Bridge Data Centres

Bridge Data Centres - Overview
Bridge Data Centres - Product / Service
Bridge Data Centres - Key offerings
SWOT

15.6 Caterpillar Inc.

Caterpillar Inc. - Overview
Caterpillar Inc. - Business segments
Caterpillar Inc. - Key offerings
Caterpillar Inc. - Segment focus
SWOT

15.7 Cisco Systems Inc.

Cisco Systems Inc. - Overview
Cisco Systems Inc. - Business segments
Cisco Systems Inc. - Key news
Cisco Systems Inc. - Key offerings
Cisco Systems Inc. - Segment focus
SWOT

15.8 Dell Technologies Inc.

Dell Technologies Inc. - Overview
Dell Technologies Inc. - Business segments
Dell Technologies Inc. - Key news
Dell Technologies Inc. - Key offerings
Dell Technologies Inc. - Segment focus
SWOT

15.9 Delta Electronics Inc.

Delta Electronics Inc. - Overview
Delta Electronics Inc. - Business segments
Delta Electronics Inc. - Key offerings
Delta Electronics Inc. - Segment focus
SWOT

15.10 Digital Realty Trust Inc.

Digital Realty Trust Inc. - Overview
Digital Realty Trust Inc. - Product / Service
Digital Realty Trust Inc. - Key offerings
SWOT

15.11 Equinix Inc.

Equinix Inc. - Overview
Equinix Inc. - Business segments
Equinix Inc. - Key news
Equinix Inc. - Key offerings
Equinix Inc. - Segment focus
SWOT

15.12 GDS Holdings Ltd.

GDS Holdings Ltd. - Overview
GDS Holdings Ltd. - Product / Service
GDS Holdings Ltd. - Key offerings
SWOT

15.13 Iron Mountain Inc.

Iron Mountain Inc. - Overview
Iron Mountain Inc. - Business segments
Iron Mountain Inc. - Key offerings
Iron Mountain Inc. - Segment focus
SWOT

15.14 NTT DATA Corp.

NTT DATA Corp. - Overview
NTT DATA Corp. - Business segments
NTT DATA Corp. - Key offerings
NTT DATA Corp. - Segment focus
SWOT

15.15 Schneider Electric SE

Schneider Electric SE - Overview
Schneider Electric SE - Business segments
Schneider Electric SE - Key news
Schneider Electric SE - Key offerings
Schneider Electric SE - Segment focus
SWOT

15.16 Singapore Telecom Ltd.

Singapore Telecom Ltd. - Overview
Singapore Telecom Ltd. - Business segments
Singapore Telecom Ltd. - Key offerings
Singapore Telecom Ltd. - Segment focus
SWOT

15.17 True Internet Data Center Co.

True Internet Data Center Co. - Overview
True Internet Data Center Co. - Product / Service
True Internet Data Center Co. - Key offerings
SWOT

15.18 Vantage Data Centers Management

Vantage Data Centers Management - Overview
Vantage Data Centers Management - Product / Service
Vantage Data Centers Management - Key offerings
SWOT

16. Appendix

16.1 Scope of the report

Market definition
Objectives
Notes and caveats

16.2 Inclusions and exclusions checklist

Inclusions checklist
Exclusions checklist

16.3 Currency conversion rates for US$

16.4 Research methodology

16.5 Data procurement

Information sources

16.6 Data validation

16.7 Validation techniques employed for market sizing

16.8 Data synthesis

16.9 360 degree market analysis

16.10 List of abbreviations

Research Methodology

Technavio presents a detailed picture of the market by way of study, synthesis, and summation of data from multiple sources. The analysts have presented the various facets of the market with a particular focus on identifying the key industry influencers. The data thus presented is comprehensive, reliable, and the result of extensive research, both primary and secondary.

INFORMATION SOURCES

Primary sources

  • Manufacturers and suppliers
  • Channel partners
  • Industry experts
  • Strategic decision makers

Secondary sources

  • Industry journals and periodicals
  • Government data
  • Financial reports of key industry players
  • Historical data
  • Press releases

DATA ANALYSIS

Data Synthesis

  • Collation of data
  • Estimation of key figures
  • Analysis of derived insights

Data Validation

  • Triangulation with data models
  • Reference against proprietary databases
  • Corroboration with industry experts

REPORT WRITING

Qualitative

  • Market drivers
  • Market challenges
  • Market trends
  • Five forces analysis

Quantitative

  • Market size and forecast
  • Market segmentation
  • Geographical insights
  • Competitive landscape

Interested in this report?

Get your sample now to see our research methodology and insights!

Download Now

Frequently Asked Questions

Southeast Asia Data Center market growth will increase by USD 4049.0 million during 2026-2030.

The Southeast Asia Data Center market is expected to grow at a CAGR of 6.8% during 2026-2030.

Southeast Asia Data Center market is segmented by End-user (BFSI, Energy, IT, Others) Component (IT infrastructure, Electrical construction, Mechanical construction, General construction, Security solutions) Type (Traditional, Modular, Containerized)

ABB Ltd., Bridge Data Centres, Caterpillar Inc., Cisco Systems Inc., Dell Technologies Inc., Delta Electronics Inc., Digital Realty Trust Inc., EdgeConneX Inc., Equinix Inc., GDS Holdings Ltd., Global Switch Ltd., Iron Mountain Inc., NTT DATA Corp., Princeton Digital Group, Schneider Electric SE, Singapore Telecom Ltd., SpaceDC, STT GDC Pte Ltd., True Internet Data Center Co., Vantage Data Centers Management are a few of the key vendors in the Southeast Asia Data Center market.

Southeast Asia will register the highest growth rate of 100% among the other regions. Therefore, the Southeast Asia Data Center market in Southeast Asia is expected to garner significant business opportunities for the vendors during the forecast period.

Singapore, Indonesia, Malaysia, Thailand, Rest of Southeast Asia

  • Escalation of cross border digital integration and regional connectivity hubs is the driving factor this market.

The Southeast Asia Data Center market vendors should focus on grabbing business opportunities from the End-user segment as it accounted for the largest market share in the base year.
RIA - Research AI Assistant
Ask RIA