Data Center Rack Pdu Market Analysis North America, APAC, Europe, South America, Middle East and Africa - US, China, Canada, Germany, Italy - Size and Forecast 2024-2028

Data Center Rack Pdu Market Analysis North America, APAC, Europe, South America, Middle East and Africa - US, China, Canada, Germany, Italy - Size and Forecast 2024-2028

Published: May 2024 177 Pages SKU: IRTNTR41200

Market Overview at a Glance

$983.8 Mn
Market Opportunity
8%
CAGR
7.25
YoY growth 2023-2024(%)

Data Center Rack PDU Market Size 2024-2028 

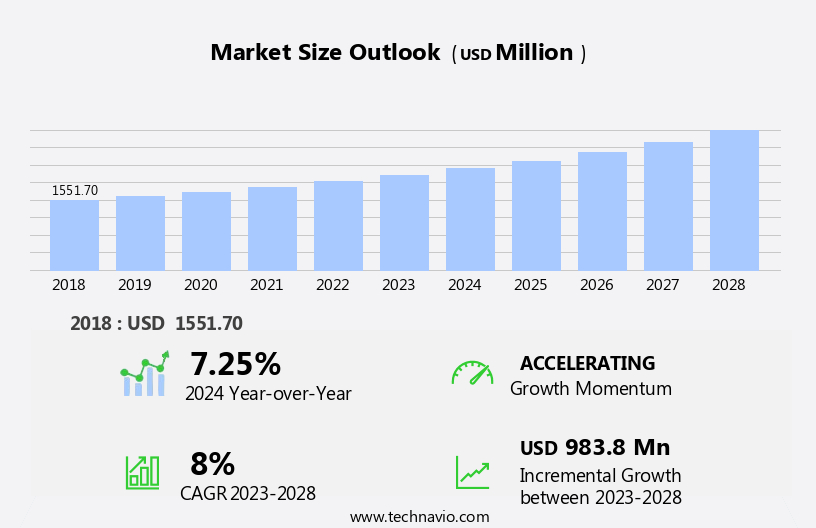
The data center rack PDU market size is forecast to increase by USD 983.8 million at a CAGR of 8% between 2023 and 2028. The market is experiencing significant growth due to several key drivers. The increasing demand for edge data centers, which require efficient power management solutions, is one such factor. Additionally, the wave in mobile data traffic and the resulting need for more data consumption capacity is driving the market. The Internet of Things (IoT) platforms and the proliferation of smart electric devices are also contributing to increased power usage in server rooms. To address these challenges, advanced Smart PDUs are gaining popularity due to their ability to monitor and manage power consumption in real-time. The proliferation of data-driven applications, cloud microservices, and IoT platforms is driving the need for edge data centers, which require PDUs that can efficiently manage power distribution and cooling systems. These devices offer precise power distribution and energy efficiency, making them an essential component of modern data center infrastructure. Overall, the market is expected to continue growing as businesses seek to optimize their power usage and reduce costs.

Data Center Rack PDU Market Size

 Request Free Sample

The market is evolving rapidly with the rise of digital traffic and data-driven applications. Modern data centers require reliable power distribution and efficient equipment cooling solutions to handle increasing bandwidth demands. Cloud based services and IoT integration have driven the adoption of smart PDUs, which offer real-time monitoring and advanced control over power usage, ensuring optimal performance and reducing energy consumption. Fiber optic lines and copper wires are essential for high-speed data transmission, while electric devices within server rooms require constant monitoring and protection. With application dominance in sectors like cloud computing and e-commerce, the need for strong PDUs, capable of managing power distribution and cooling effectively, has never been greater. A Smart PDU in a server room, integrated with cloud-based services and IoT (Internet of Things), enables real time monitoring of electric device, optimizing energy usage and supporting data driven applications for efficient power management.

Market Segmentation

The market research report provides comprehensive data (region-wise segment analysis), with forecasts and estimates in "USD million" for the period 2024-2028, as well as historical data from 2018-2022 for the following segments.
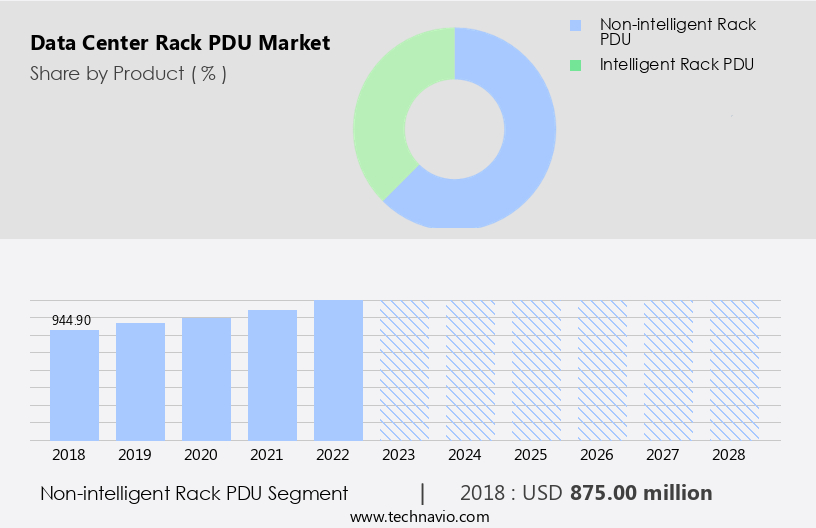
  • Product
    • Non-intelligent rack PDU
    • Intelligent rack PDU
  • Type
    • Colocation
    • Hosting
  • Geography
    • North America
      • Canada
      • US
    • APAC
      • China
    • Europe
      • Germany
      • Italy
    • South America
    • Middle East and Africa

By Product Insights

The non-intelligent rack PDU segment is estimated to witness significant growth during the forecast period. The market is experiencing a decline, but the demand for rack-mounted PDUs continues to rise. This trend is driven by the advantages they offer, including efficient use of space and cost-effective power distribution to network switches, servers, and other electronic devices.

The increasing adoption of cloud computing by Small and Medium Enterprises (SMEs) is leading to the proliferation of mini data centers, where basic PDUs are commonly utilized for power management. However, the market share of basic PDUs lags behind that of intelligent PDUs due to their limitations, such as the lack of remote access and monitoring capabilities. Despite this, the cost-effectiveness of basic PDUs makes them a popular choice for many organizations seeking to optimize their IT services.

Data Center Rack PDU Market Size

Get a glance at the market share of various segments Request Free Sample

The non-intelligent rack PDU segment accounted for USD 875.00 million in 2018 and showed a gradual increase during the forecast period.

Regional Insights

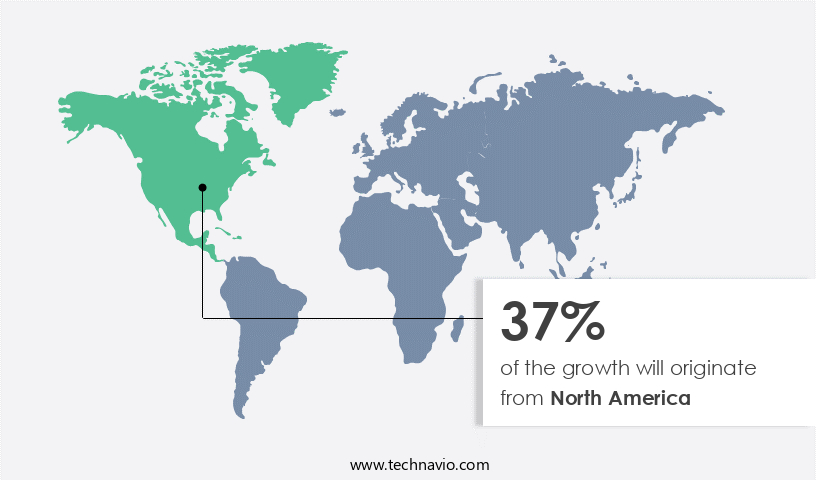
North America is estimated to contribute 37% to the growth of the global market during the forecast period. Technavio's analysts have elaborately explained the regional trends and drivers that shape the market during the forecast period.

Data Center Rack PDU Market Share by Geography

For more insights on the market share of various regions Request Free Sample

In North America, the expansion of data centers is on the rise, fueled by substantial investments from cloud service providers, colocation companies, and businesses seeking to enhance their IT infrastructure. Edge computing, 5G, multi-cloud services, data analytics, and the Internet of Things (IoT) are key drivers of this growth. The US, as a leading data center hub in North America, hosts major data center markets in cities such as Atlanta, Northern Virginia, Chicago, Dallas/Ft. Worth, and Silicon Valley. Notable companies have announced their plans to expand, further boosting the server market in the region. The increasing need for 5G-enabled IoT solutions and industries requiring high connectivity with minimal latency are significant factors contributing to the overflow in demand for data center solutions across North America.

Our researchers analyzed the data with 2023 as the base year, along with the key drivers, trends, and challenges. A holistic analysis of drivers will help companies refine their marketing strategies to gain a competitive advantage.

Market Driver

Increasing investments in data center construction is the key driver of the market. Data centers play a crucial role in the digital transformation of businesses, particularly those with data-driven applications. The proliferation of cloud computing and the increasing adoption of digital technologies are driving the demand for reliable and efficient data center infrastructure. With this addition, NTT now operates over 12 data center locations across the country, offering enhanced capacity and energy efficiency. As companies continue to invest in digitalization, real-time monitoring and remote management of data centers have become essential for optimizing energy usage and ensuring cost savings.

Moreover, the increasing use of data-driven applications and the growing importance of energy efficiency are expected to fuel the growth of the market. Remote management and real-time monitoring capabilities of these PDUs are particularly valuable in the context of cloud computing, where scalability and flexibility are key requirements. By providing accurate and timely information on power usage and enabling automated responses to power demand, data center PDUs help ensure the optimal performance of cloud services and applications. In summary, the growing importance of cloud computing, digitalization, and data-driven applications is driving the demand for efficient and reliable data center infrastructure. Advanced PDUs, with their real-time monitoring and energy efficiency features, are well-positioned to meet this demand and contribute to cost savings for businesses.

Market Trends

Growing investments in hyper-scale data centers by colocation providers is the upcoming trend in the market. The proliferation of edge data centers is fueling the growth of the data center PDUs market in the United States. The ripple in mobile data traffic and the increasing consumption of data by IoT platforms necessitate the need for advanced electric devices to manage and distribute power efficiently in server rooms. Smart PDUs have emerged as a viable solution to address these challenges.

These companies are investing heavily to meet the increasing data requirements of businesses and individuals. The Smart Revolution, which encompasses the development of smart cities, grids, and homes, is generating massive amounts of data. Processing this data is becoming a critical priority, leading to an uptick in the number of hyper-scale data centers.  In conclusion, the data center colocation market in the US is poised for significant growth due to the increasing demand for advanced electric devices, such as Smart PDUs, to manage and distribute power efficiently in edge data centers.

Market Challenge

Increased power consumption in racks is a key challenge affecting the market growth. Data centers are essential for the smooth functioning of online communication services and IT infrastructure by housing servers and storage devices. Powering these facilities is a significant expense for operators, with costs encompassing energy consumption, establishing efficient power distribution systems, and routine maintenance. The power demand from data centers is substantial, contributing to a sizeable carbon footprint, particularly in countries like the US, the UK, and Germany, which host a large number of data centers. The trend of utilizing shared resources and hardware in these facilities further amplifies the power consumption. Globally, data center growth is accelerating, necessitating advanced power management solutions.

Intelligent Power Distribution Units (PDUs) are gaining popularity due to their energy efficiency and ability to monitor power usage and set alarm thresholds. These PDUs offer cost savings by reducing energy waste and improving overall power management.

Exclusive Customer Landscape

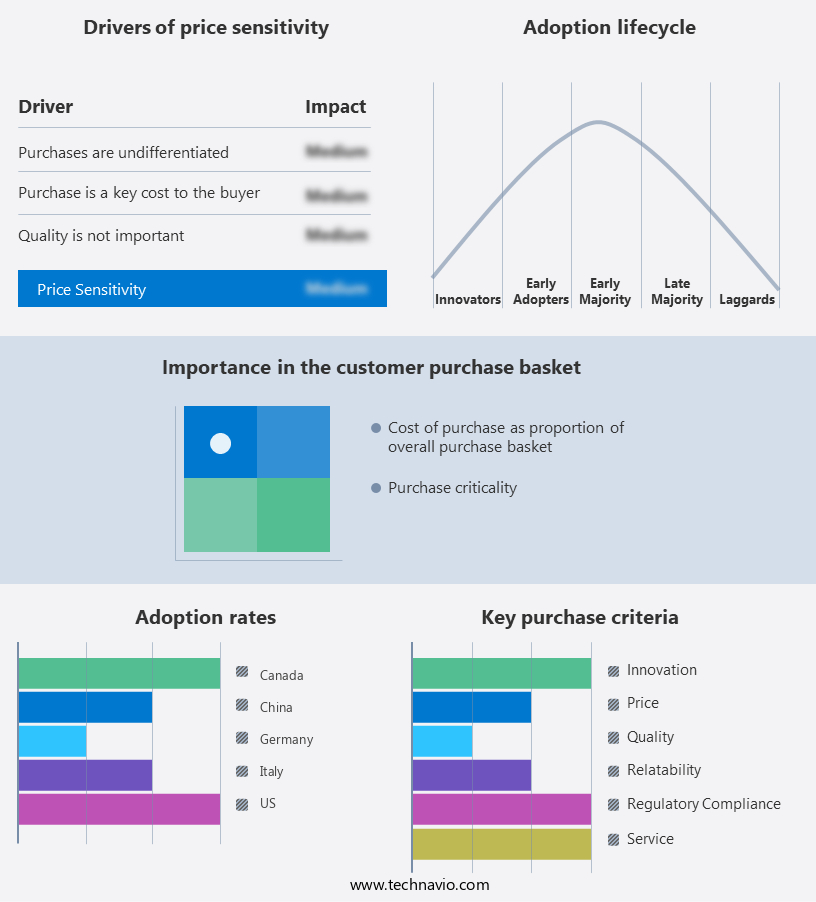
The market forecasting report includes the adoption lifecycle of the market, covering from the innovator's stage to the laggard's stage. It focuses on adoption rates in different regions based on penetration. Furthermore, the report also includes key purchase criteria and drivers of price sensitivity to help companies evaluate and develop their market growth analysis strategies.

Data Center Rack PDU Market Share by Geography

 Customer Landscape

Key Companies & Market Insights

Companies are implementing various strategies, such as strategic alliances, partnerships, mergers and acquisitions, geographical expansion, and product/service launches, to enhance their presence in the market.

DigiPower Manufacturing Inc: The company offers Delta rack power distribution units that provide optimal power distribution for devices inside a rack.

The market research and growth report includes detailed analyses of the competitive landscape of the market and information about key companies, including:

  • Black Box Ltd.
  • Chatsworth Products Inc.
  • Cisco Systems Inc.
  • Cyber Power Systems Inc.
  • Dell Technologies Inc.
  • Delta Electronics Inc.
  • Eaton Corp. Plc
  • Friedhelm Loh Stiftung and Co. KG
  • Fujitsu Ltd.
  • Hewlett Packard Enterprise Co.
  • Legrand SA
  • Leviton Manufacturing Co. Inc.
  • nVent Electric Plc
  • Panduit Corp.
  • Schleifenbauer Products BV
  • Schneider Electric SE
  • Siemens AG
  • Toshiba Corp.
  • Vertiv Holdings Co.

Qualitative and quantitative analysis of companies has been conducted to help clients understand the wider business environment as well as the strengths and weaknesses of key market players. Data is qualitatively analyzed to categorize companies as pure play, category-focused, industry-focused, and diversified; it is quantitatively analyzed to categorize companies as dominant, leading, strong, tentative, and weak.

Research Analyst Overview

The market is witnessing significant growth due to the increasing demand for cloud-based services, digitalization, and remote access. With the rise of agile data centers and cloud computing, there is a growing need for power distribution units (PDUs) that offer monitoring capabilities, energy efficiency, and cost savings. These intelligent PDUs enable real-time monitoring of power consumption, alarm thresholds, and input load monitoring, ensuring optimal operation of electronic devices such as servers, network switches, and other IT infrastructure.

Additionally, mobile data traffic and data consumption are also fueling the demand for PDUs that can support high-speed networks and distributed IT architecture. Energy efficiency is a key consideration for data centers, and PDUs play a crucial role in reducing hardware costs by minimizing power waste and ensuring that equipment is operating at peak efficiency. Cooling systems are another critical component of data centers, and PDUs with advanced cooling capabilities help maintain optimal temperatures for optimal performance. In industries such as financial services, healthcare, and industrial use applications, the need for reliable and efficient power distribution is paramount. PDUs are essential for ensuring the optimal operation of IT services and online communication services, as well as for powering cyberpower systems and other electronic devices in household and commercial development.

Market Scope

Report Coverage

Details

Page number

177

Base year

2023

Historic period

2018-2022

Forecast period

2024-2028

Growth momentum & CAGR

Accelerate at a CAGR of 8%

Market Growth 2024-2028

USD 983.8 million

Market structure

Fragmented

YoY growth 2023-2024(%)

7.25

Regional analysis

North America, APAC, Europe, South America, and Middle East and Africa

Performing market contribution

North America at 37%

Key countries

US, China, Canada, Germany, and Italy

Competitive landscape

Leading Companies, Market Positioning of Companies, Competitive Strategies, and Industry Risks

Key companies profiled

Black Box Ltd., Chatsworth Products Inc., Cisco Systems Inc., Cyber Power Systems Inc., Dell Technologies Inc., Delta Electronics Inc., DigiPower Manufacturing Inc., Eaton Corp. Plc, Friedhelm Loh Stiftung and Co. KG, Fujitsu Ltd., Hewlett Packard Enterprise Co., Legrand SA, Leviton Manufacturing Co. Inc., nVent Electric Plc, Panduit Corp., Schleifenbauer Products BV, Schneider Electric SE, Siemens AG, Toshiba Corp., and Vertiv Holdings Co.

Market dynamics

Parent market analysis, market growth inducers and obstacles, market forecast, fast-growing and slow-growing segment analysis, COVID-19 impact and recovery analysis and future consumer dynamics, market condition analysis for the forecast period

Customization purview

If our market report has not included the data that you are looking for, you can reach out to our analysts and get segments customized.

Request Free Sample

What are the Key Data Covered in this Market Research and Growth Report?

  • CAGR of the market during the forecast period
  • Detailed information on factors that will drive the market growth and forecasting between 2024 and 2028
  • Precise estimation of the size of the market  and its contribution of the market in focus to the parent market
  • Accurate predictions about upcoming market growth and trends and changes in consumer behaviour
  • Growth of the market across North America, APAC, Europe, South America, and Middle East and Africa
  • Thorough analysis of the market's competitive landscape and detailed information about companies
  • Comprehensive analysis of factors that will challenge the growth of market companies

We can help! Our analysts can customize this market research report to meet your requirements. Get in touch

1 Executive Summary

  • 1.1 Market overview
    • Executive Summary - Chart on Market Overview
    • Executive Summary - Data Table on Market Overview
    • Executive Summary - Chart on Global Market Characteristics
    • Executive Summary - Chart on Market by Geography
    • Executive Summary - Chart on Market Segmentation by Product
    • Executive Summary - Chart on Market Segmentation by Type
    • Executive Summary - Chart on Incremental Growth
    • Executive Summary - Data Table on Incremental Growth
    • Executive Summary - Chart on Company Market Positioning

2 Market Landscape

  • 2.1 Market ecosystem
    • Parent Market
    • Data Table on - Parent Market
  • 2.2 Market characteristics
    • Market characteristics analysis
  • 2.3 Value chain analysis
    • Value Chain Analysis

3 Market Sizing

  • 3.1 Market definition
    • Offerings of companies included in the market definition
  • 3.2 Market segment analysis
    • Market segments
  • 3.3 Market size 2023
    • 3.4 Market outlook: Forecast for 2023-2028
      • Chart on Global - Market size and forecast 2023-2028 ($ million)
      • Data Table on Global - Market size and forecast 2023-2028 ($ million)
      • Chart on Global Market: Year-over-year growth 2023-2028 (%)
      • Data Table on Global Market: Year-over-year growth 2023-2028 (%)

    4 Historic Market Size

    • 4.1 Global Data Center Rack PDU Market 2018 - 2022
      • Historic Market Size - Data Table on Global Data Center Rack PDU Market 2018 - 2022 ($ million)
    • 4.2 Product segment analysis 2018 - 2022
      • Historic Market Size - Product Segment 2018 - 2022 ($ million)
    • 4.3 Type segment analysis 2018 - 2022
      • Historic Market Size - Type Segment 2018 - 2022 ($ million)
    • 4.4 Geography segment analysis 2018 - 2022
      • Historic Market Size - Geography Segment 2018 - 2022 ($ million)
    • 4.5 Country segment analysis 2018 - 2022
      • Historic Market Size - Country Segment 2018 - 2022 ($ million)

    5 Five Forces Analysis

    • 5.1 Five forces summary
      • Five forces analysis - Comparison between 2023 and 2028
    • 5.2 Bargaining power of buyers
      • Bargaining power of buyers - Impact of key factors 2023 and 2028
    • 5.3 Bargaining power of suppliers
      • Bargaining power of suppliers - Impact of key factors in 2023 and 2028
    • 5.4 Threat of new entrants
      • Threat of new entrants - Impact of key factors in 2023 and 2028
    • 5.5 Threat of substitutes
      • Threat of substitutes - Impact of key factors in 2023 and 2028
    • 5.6 Threat of rivalry
      • Threat of rivalry - Impact of key factors in 2023 and 2028
    • 5.7 Market condition
      • Chart on Market condition - Five forces 2023 and 2028

    6 Market Segmentation by Product

    • 6.1 Market segments
      • Chart on Product - Market share 2023-2028 (%)
      • Data Table on Product - Market share 2023-2028 (%)
    • 6.2 Comparison by Product
      • Chart on Comparison by Product
      • Data Table on Comparison by Product
    • 6.3 Non-intelligent rack PDU - Market size and forecast 2023-2028
      • Chart on Non-intelligent rack PDU - Market size and forecast 2023-2028 ($ million)
      • Data Table on Non-intelligent rack PDU - Market size and forecast 2023-2028 ($ million)
      • Chart on Non-intelligent rack PDU - Year-over-year growth 2023-2028 (%)
      • Data Table on Non-intelligent rack PDU - Year-over-year growth 2023-2028 (%)
    • 6.4 Intelligent rack PDU - Market size and forecast 2023-2028
      • Chart on Intelligent rack PDU - Market size and forecast 2023-2028 ($ million)
      • Data Table on Intelligent rack PDU - Market size and forecast 2023-2028 ($ million)
      • Chart on Intelligent rack PDU - Year-over-year growth 2023-2028 (%)
      • Data Table on Intelligent rack PDU - Year-over-year growth 2023-2028 (%)
    • 6.5 Market opportunity by Product
      • Market opportunity by Product ($ million)
      • Data Table on Market opportunity by Product ($ million)

    7 Market Segmentation by Type

    • 7.1 Market segments
      • Chart on Type - Market share 2023-2028 (%)
      • Data Table on Type - Market share 2023-2028 (%)
    • 7.2 Comparison by Type
      • Chart on Comparison by Type
      • Data Table on Comparison by Type
    • 7.3 Colocation - Market size and forecast 2023-2028
      • Chart on Colocation - Market size and forecast 2023-2028 ($ million)
      • Data Table on Colocation - Market size and forecast 2023-2028 ($ million)
      • Chart on Colocation - Year-over-year growth 2023-2028 (%)
      • Data Table on Colocation - Year-over-year growth 2023-2028 (%)
    • 7.4 Hosting - Market size and forecast 2023-2028
      • Chart on Hosting - Market size and forecast 2023-2028 ($ million)
      • Data Table on Hosting - Market size and forecast 2023-2028 ($ million)
      • Chart on Hosting - Year-over-year growth 2023-2028 (%)
      • Data Table on Hosting - Year-over-year growth 2023-2028 (%)
    • 7.5 Market opportunity by Type
      • Market opportunity by Type ($ million)
      • Data Table on Market opportunity by Type ($ million)

    8 Customer Landscape

    • 8.1 Customer landscape overview
      • Analysis of price sensitivity, lifecycle, customer purchase basket, adoption rates, and purchase criteria

    9 Geographic Landscape

    • 9.1 Geographic segmentation
      • Chart on Market share by geography 2023-2028 (%)
      • Data Table on Market share by geography 2023-2028 (%)
    • 9.2 Geographic comparison
      • Chart on Geographic comparison
      • Data Table on Geographic comparison
    • 9.3 North America - Market size and forecast 2023-2028
      • Chart on North America - Market size and forecast 2023-2028 ($ million)
      • Data Table on North America - Market size and forecast 2023-2028 ($ million)
      • Chart on North America - Year-over-year growth 2023-2028 (%)
      • Data Table on North America - Year-over-year growth 2023-2028 (%)
    • 9.4 APAC - Market size and forecast 2023-2028
      • Chart on APAC - Market size and forecast 2023-2028 ($ million)
      • Data Table on APAC - Market size and forecast 2023-2028 ($ million)
      • Chart on APAC - Year-over-year growth 2023-2028 (%)
      • Data Table on APAC - Year-over-year growth 2023-2028 (%)
    • 9.5 Europe - Market size and forecast 2023-2028
      • Chart on Europe - Market size and forecast 2023-2028 ($ million)
      • Data Table on Europe - Market size and forecast 2023-2028 ($ million)
      • Chart on Europe - Year-over-year growth 2023-2028 (%)
      • Data Table on Europe - Year-over-year growth 2023-2028 (%)
    • 9.6 South America - Market size and forecast 2023-2028
      • Chart on South America - Market size and forecast 2023-2028 ($ million)
      • Data Table on South America - Market size and forecast 2023-2028 ($ million)
      • Chart on South America - Year-over-year growth 2023-2028 (%)
      • Data Table on South America - Year-over-year growth 2023-2028 (%)
    • 9.7 Middle East and Africa - Market size and forecast 2023-2028
      • Chart on Middle East and Africa - Market size and forecast 2023-2028 ($ million)
      • Data Table on Middle East and Africa - Market size and forecast 2023-2028 ($ million)
      • Chart on Middle East and Africa - Year-over-year growth 2023-2028 (%)
      • Data Table on Middle East and Africa - Year-over-year growth 2023-2028 (%)
    • 9.8 US - Market size and forecast 2023-2028
      • Chart on US - Market size and forecast 2023-2028 ($ million)
      • Data Table on US - Market size and forecast 2023-2028 ($ million)
      • Chart on US - Year-over-year growth 2023-2028 (%)
      • Data Table on US - Year-over-year growth 2023-2028 (%)
    • 9.9 China - Market size and forecast 2023-2028
      • Chart on China - Market size and forecast 2023-2028 ($ million)
      • Data Table on China - Market size and forecast 2023-2028 ($ million)
      • Chart on China - Year-over-year growth 2023-2028 (%)
      • Data Table on China - Year-over-year growth 2023-2028 (%)
    • 9.10 Canada - Market size and forecast 2023-2028
      • Chart on Canada - Market size and forecast 2023-2028 ($ million)
      • Data Table on Canada - Market size and forecast 2023-2028 ($ million)
      • Chart on Canada - Year-over-year growth 2023-2028 (%)
      • Data Table on Canada - Year-over-year growth 2023-2028 (%)
    • 9.11 Germany - Market size and forecast 2023-2028
      • Chart on Germany - Market size and forecast 2023-2028 ($ million)
      • Data Table on Germany - Market size and forecast 2023-2028 ($ million)
      • Chart on Germany - Year-over-year growth 2023-2028 (%)
      • Data Table on Germany - Year-over-year growth 2023-2028 (%)
    • 9.12 Italy - Market size and forecast 2023-2028
      • Chart on Italy - Market size and forecast 2023-2028 ($ million)
      • Data Table on Italy - Market size and forecast 2023-2028 ($ million)
      • Chart on Italy - Year-over-year growth 2023-2028 (%)
      • Data Table on Italy - Year-over-year growth 2023-2028 (%)
    • 9.13 Market opportunity by geography
      • Market opportunity by geography ($ million)
      • Data Tables on Market opportunity by geography ($ million)

    10 Drivers, Challenges, and Opportunity/Restraints

    • 10.1 Market drivers
      • 10.2 Market challenges
        • 10.3 Impact of drivers and challenges
          • Impact of drivers and challenges in 2023 and 2028
        • 10.4 Market opportunities/restraints

          11 Competitive Landscape

          • 11.1 Overview
            • 11.2 Competitive Landscape
              • Overview on criticality of inputs and factors of differentiation
            • 11.3 Landscape disruption
              • Overview on factors of disruption
            • 11.4 Industry risks
              • Impact of key risks on business

            12 Competitive Analysis

            • 12.1 Companies profiled
              • Companies covered
            • 12.2 Market positioning of companies
              • Matrix on companies position and classification
            • 12.3 Cisco Systems Inc.
              • Cisco Systems Inc. - Overview
              • Cisco Systems Inc. - Business segments
              • Cisco Systems Inc. - Key news
              • Cisco Systems Inc. - Key offerings
              • Cisco Systems Inc. - Segment focus
            • 12.4 Cyber Power Systems Inc.
              • Cyber Power Systems Inc. - Overview
              • Cyber Power Systems Inc. - Product / Service
              • Cyber Power Systems Inc. - Key offerings
            • 12.5 Dell Technologies Inc.
              • Dell Technologies Inc. - Overview
              • Dell Technologies Inc. - Business segments
              • Dell Technologies Inc. - Key offerings
              • Dell Technologies Inc. - Segment focus
            • 12.6 Delta Electronics Inc.
              • Delta Electronics Inc. - Overview
              • Delta Electronics Inc. - Business segments
              • Delta Electronics Inc. - Key offerings
              • Delta Electronics Inc. - Segment focus
            • 12.7 Eaton Corp. Plc
              • Eaton Corp. Plc - Overview
              • Eaton Corp. Plc - Business segments
              • Eaton Corp. Plc - Key news
              • Eaton Corp. Plc - Key offerings
              • Eaton Corp. Plc - Segment focus
            • 12.8 Fujitsu Ltd.
              • Fujitsu Ltd. - Overview
              • Fujitsu Ltd. - Business segments
              • Fujitsu Ltd. - Key news
              • Fujitsu Ltd. - Key offerings
              • Fujitsu Ltd. - Segment focus
            • 12.9 Hewlett Packard Enterprise Co.
              • Hewlett Packard Enterprise Co. - Overview
              • Hewlett Packard Enterprise Co. - Business segments
              • Hewlett Packard Enterprise Co. - Key news
              • Hewlett Packard Enterprise Co. - Key offerings
              • Hewlett Packard Enterprise Co. - Segment focus
            • 12.10 Legrand SA
              • Legrand SA - Overview
              • Legrand SA - Business segments
              • Legrand SA - Key offerings
              • Legrand SA - Segment focus
            • 12.11 Leviton Manufacturing Co. Inc.
              • Leviton Manufacturing Co. Inc. - Overview
              • Leviton Manufacturing Co. Inc. - Product / Service
              • Leviton Manufacturing Co. Inc. - Key offerings
            • 12.12 nVent Electric Plc
              • nVent Electric Plc - Overview
              • nVent Electric Plc - Business segments
              • nVent Electric Plc - Key offerings
              • nVent Electric Plc - Segment focus
            • 12.13 Panduit Corp.
              • Panduit Corp. - Overview
              • Panduit Corp. - Product / Service
              • Panduit Corp. - Key offerings
            • 12.14 Schneider Electric SE
              • Schneider Electric SE - Overview
              • Schneider Electric SE - Business segments
              • Schneider Electric SE - Key offerings
              • Schneider Electric SE - Segment focus
            • 12.15 Siemens AG
              • Siemens AG - Overview
              • Siemens AG - Business segments
              • Siemens AG - Key news
              • Siemens AG - Key offerings
              • Siemens AG - Segment focus
            • 12.16 Toshiba Corp.
              • Toshiba Corp. - Overview
              • Toshiba Corp. - Business segments
              • Toshiba Corp. - Key news
              • Toshiba Corp. - Key offerings
              • Toshiba Corp. - Segment focus
            • 12.17 Vertiv Holdings Co.
              • Vertiv Holdings Co. - Overview
              • Vertiv Holdings Co. - Business segments
              • Vertiv Holdings Co. - Key offerings
              • Vertiv Holdings Co. - Segment focus

            13 Appendix

            • 13.1 Scope of the report
              • 13.2 Inclusions and exclusions checklist
                • Inclusions checklist
                • Exclusions checklist
              • 13.3 Currency conversion rates for US$
                • Currency conversion rates for US$
              • 13.4 Research methodology
                • Research methodology
              • 13.5 Data procurement
                • Information sources
              • 13.6 Data validation
                • Data validation
              • 13.7 Validation techniques employed for market sizing
                • Validation techniques employed for market sizing
              • 13.8 Data synthesis
                • Data synthesis
              • 13.9 360 degree market analysis
                • 360 degree market analysis
              • 13.10 List of abbreviations
                • List of abbreviations

              Research Methodology

              Technavio presents a detailed picture of the market by way of study, synthesis, and summation of data from multiple sources. The analysts have presented the various facets of the market with a particular focus on identifying the key industry influencers. The data thus presented is comprehensive, reliable, and the result of extensive research, both primary and secondary.

              INFORMATION SOURCES

              Primary sources

              • Manufacturers and suppliers
              • Channel partners
              • Industry experts
              • Strategic decision makers

              Secondary sources

              • Industry journals and periodicals
              • Government data
              • Financial reports of key industry players
              • Historical data
              • Press releases

              DATA ANALYSIS

              Data Synthesis

              • Collation of data
              • Estimation of key figures
              • Analysis of derived insights

              Data Validation

              • Triangulation with data models
              • Reference against proprietary databases
              • Corroboration with industry experts

              REPORT WRITING

              Qualitative

              • Market drivers
              • Market challenges
              • Market trends
              • Five forces analysis

              Quantitative

              • Market size and forecast
              • Market segmentation
              • Geographical insights
              • Competitive landscape

              Interested in this report?

              Get your sample now to see our research methodology and insights!

              Download Now

              Frequently Asked Questions

              Data Center Rack PDU market growth will increase by $ 983.8 mn during 2024-2028.

              The Data Center Rack PDU market is expected to grow at a CAGR of 8% during 2024-2028.

              Data Center Rack PDU market is segmented by Product( Non-intelligent rack PDU, Intelligent rack PDU) Type( Colocation, Hosting, Europe, South America)

              Black Box Ltd., Chatsworth Products Inc., Cisco Systems Inc., Cyber Power Systems Inc., Dell Technologies Inc., Delta Electronics Inc., DigiPower Manufacturing Inc., Eaton Corp. Plc, Friedhelm Loh Stiftung and Co. KG, Fujitsu Ltd., Hewlett Packard Enterprise Co., Legrand SA, Leviton Manufacturing Co. Inc., nVent Electric Plc, Panduit Corp., Schleifenbauer Products BV, Schneider Electric SE, Siemens AG, Toshiba Corp., Vertiv Holdings Co. are a few of the key vendors in the Data Center Rack PDU market.

              North America will register the highest growth rate of 37% among the other regions. Therefore, the Data Center Rack PDU market in North America is expected to garner significant business opportunities for the vendors during the forecast period.

              US, China, Canada, Germany, Italy

              • Increasing investments in data center constructionData centers have become an integral part of every organization. The massive growth in the amount of data being generated has compelled several companies to build their own data centers or lease data center space. The increasing interest in cloud computing will further drive the need for data centers in the upcoming period. There have been several examples of firms investing in the construction of new data centers is the driving factor this market.
              • some examples of which have been provided below:NTT Ltd. is the driving factor this market.
              • in India is the driving factor this market.
              • announced in May 2022 the opening of its first data center is the driving factor this market.
              • NAV1A is the driving factor this market.
              • on the grounds of its new hyperscale data center. NTT now has 12 data center locations around the nation is the driving factor this market.
              • totaling more than 2.5 million square feet (232 is the driving factor this market.
              • 258 m2) and 220 MW of facility power.In August 2022 is the driving factor this market.
              • Google Cloud announced three brand-new cloud regions opening in Asia-Pacific is the driving factor this market.
              • which provides new cloud computing opportunities and service sales for global channel partners.The above investments in the construction of data centers indicate that the need for rack PDUs to support power management for the server and storage devices will also rise is the driving factor this market.
              • thereby will drive the growth of the market during forecast period. is the driving factor this market.

              The Data Center Rack PDU market vendors should focus on grabbing business opportunities from the Non-intelligent rack PDU segment as it accounted for the largest market share in the base year.