
Data Loss Prevention (DLP) Market Analysis, Size, and Forecast 2026-2030: North America (US, Canada, and Mexico), APAC (China, Japan, and India), Europe (Germany, UK, and France), South America (Brazil, Argentina, and Chile), Middle East and Africa (Saudi Arabia, UAE, and South Africa), and Rest of World (ROW)

Data Loss Prevention (DLP) Market Analysis, Size, and Forecast 2026-2030:
North America (US, Canada, and Mexico), APAC (China, Japan, and India), Europe (Germany, UK, and France), South America (Brazil, Argentina, and Chile), Middle East and Africa (Saudi Arabia, UAE, and South Africa), and Rest of World (ROW)

Published: Oct 2026 317 Pages SKU: IRTNTR73617

Market Overview at a Glance

$12.00 B
Market Opportunity
35.7%
CAGR 2025 - 2030
35.9%
APAC Growth
$1.45 B
Cloud-based segment 2024

Data Loss Prevention (Dlp) Market Size 2026-2030

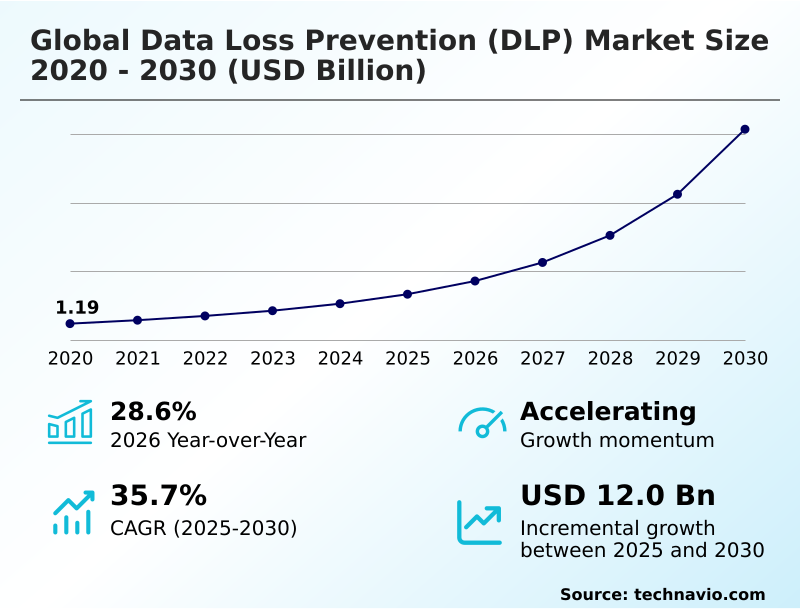
The data loss prevention (dlp) market size is valued to increase by USD 12.00 billion, at a CAGR of 35.7% from 2025 to 2030. Rising global data protection regulations and statutory fines will drive the data loss prevention (dlp) market.

Major Market Trends & Insights

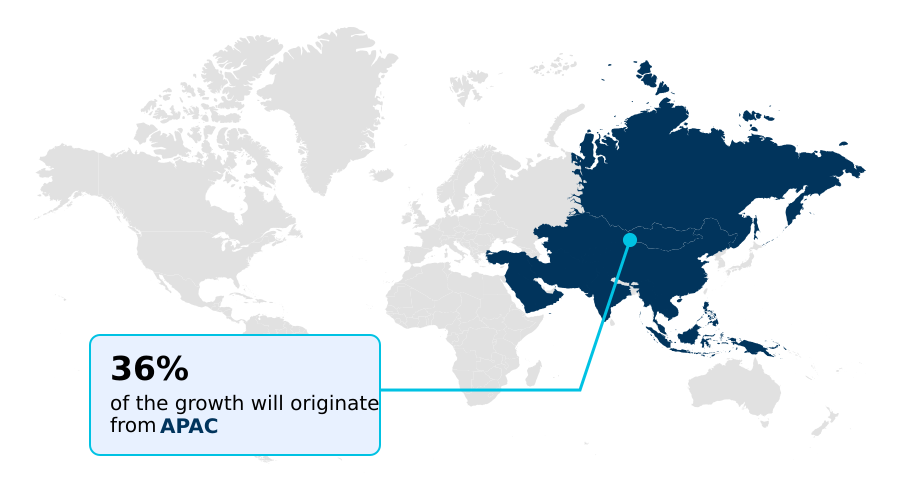
  • APAC dominated the market and accounted for a 35.9% growth during the forecast period.
  • By Deployment - Cloud-based segment was valued at USD 1.45 billion in 2024
  • By Technology - Datacenter and storage-based DLP segment accounted for the largest market revenue share in 2024

Market Size & Forecast

  • Market Opportunities: USD 14.14 billion
  • Market Future Opportunities: USD 12.00 billion
  • CAGR from 2025 to 2030 : 35.7%

Market Summary

  • The Data Loss Prevention (DLP) Market operates as a critical defensive infrastructure layer for modern enterprises navigating highly decentralized digital environments. Maintaining absolute visibility over proprietary information movement across hybrid data centers becomes paramount. Within a complex supply chain network, administrators utilize automated policy enforcement to block the unauthorized transfer of engineering blueprints to unverified contractors.
  • This proactive mitigation ensures that intellectual property remains secure while facilitating uninterrupted remote collaboration across various decentralized access points. Integrating these adaptive security controls enables enterprises to realize a 45% reduction in incident remediation times compared to traditional perimeter defenses.
  • The escalation of strict statutory privacy regulations acts as a primary catalyst for adoption, compelling corporations to deploy automated classification tools. Conversely, managing high false positive rates presents a substantial operational hurdle, as rigid pattern-matching dictionaries misclassify benign communications, causing alert fatigue. Implementing intelligent context-aware inspection frameworks is essential to streamline threat verification and maintain robust corporate data governance.

What will be the Size of the Data Loss Prevention (Dlp) Market during the forecast period?
Get Key Insights on Market Forecast (PDF) Get Free Sample

How is the Data Loss Prevention (Dlp) Market Segmented?

The data loss prevention (dlp) industry research report provides comprehensive data (region-wise segment analysis), with forecasts and estimates in "USD million" for the period 2026-2030, as well as historical data from 2020-2024 for the following segments.

  • Deployment
    • Cloud-based
    • On-premises
  • Technology
    • Datacenter and storage-based DLP
    • Endpoint DLP
    • Network DLP
  • Customer type
    • Large enterprises
    • SMEs
  • End-user
    • BFSI
    • Healthcare
    • Retail and e-commerce
    • IT and telecom
    • Others
  • Geography
    • North America
      • US
      • Canada
      • Mexico
    • APAC
      • China
      • Japan
      • India
      • South Korea
      • Australia
      • Indonesia
    • Europe
      • Germany
      • UK
      • France
      • Italy
      • Spain
      • The Netherlands
    • South America
      • Brazil
      • Argentina
      • Chile
    • Middle East and Africa
      • Saudi Arabia
      • UAE
      • South Africa
      • Israel
      • Turkey

By Deployment Insights

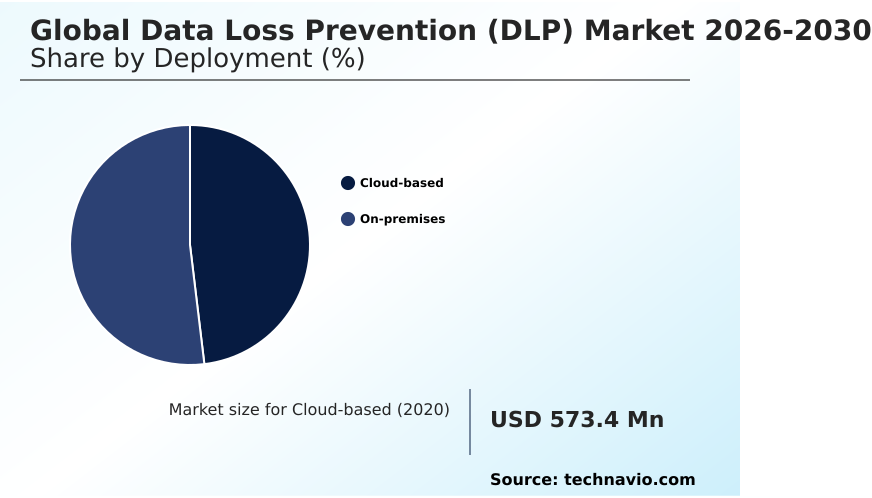
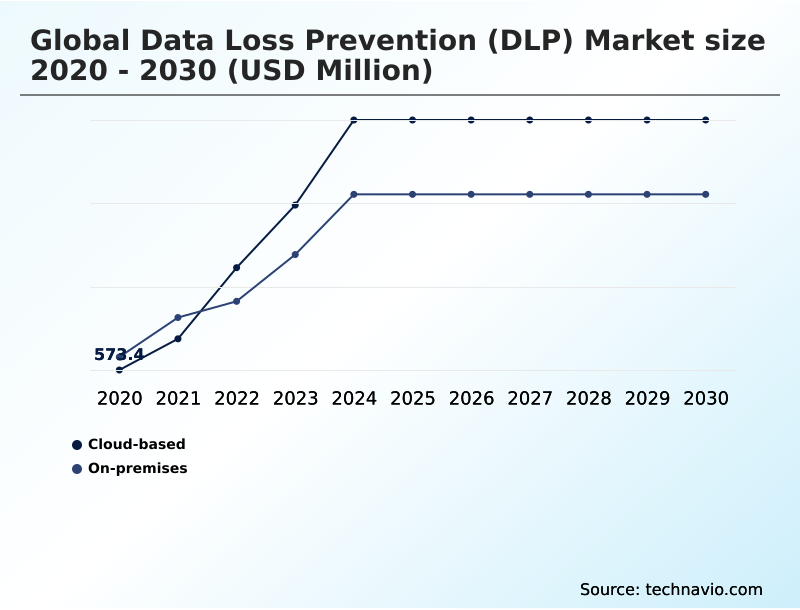
The cloud-based segment is estimated to witness significant growth during the forecast period.

The cloud-based deployment model serves as the foundational architecture for modern security frameworks, driven by the rapid enterprise transition into multi cloud environments and the expansion of distributed hybrid workforces.

By eliminating on-premises hardware constraints, this architecture allows organizations to instantly scale monitoring capabilities and integrate seamlessly with secure access service edge platforms. A cloud-delivered approach provides continuous visibility into shadow artificial intelligence applications and unauthorized web uploads.

Organizations utilizing this deployment architecture report that compliance violation detection improved by 35% compared to legacy physical appliances. As corporate reliance on digital tools deepens, embedding a unified cloud access security broker within the security stack ensures consistent protection.

This fundamental shift optimizes enterprise risk management operations by neutralizing vulnerabilities before data leaves the corporate perimeter.
Get Free Sample

The Cloud-based segment was valued at USD 1.45 billion in 2024 and showed a gradual increase during the forecast period.
Get Free Sample

Regional Analysis

APAC is estimated to contribute 35.9% to the growth of the global market during the forecast period.Technavio’s analysts have elaborately explained the regional trends and drivers that shape the market during the forecast period.
See How Data Loss Prevention (Dlp) Market Demand is Rising in APAC Get Free Sample

The geographic distribution of security deployments highlights distinct operational priorities between North America and APAC. North America maintains a mature deployment landscape driven by rigorous payment card compliance mandates and advanced cybersecurity resilience strategies.

Enterprises in this region exhibit a 45% higher penetration rate of automated inspection tools designed to monitor generative artificial intelligence prompts compared to their Asian counterparts.

Conversely, the market in APAC is characterized by rapid industrial digitalization, where organizations prioritize securing operational technology documentation across expanding mobile workforces.

By localizing data processing to meet strict regional data sovereignty requirements, APAC businesses have reduced cross-border compliance auditing costs by 28%.

Meanwhile, North American defense sectors heavily utilize air gapped security architectures to protect classified assets, achieving a 35% improvement in specialized threat containment. These regional disparities dictate how security officers balance agile productivity with localized regulatory obligations.

Market Dynamics

Our researchers analyzed the data with 2025 as the base year, along with the key drivers, trends, and challenges. A holistic analysis of drivers will help companies refine their marketing strategies to gain a competitive advantage.

  • The evolving landscape of corporate cybersecurity requires a fundamental shift in how organizations monitor and secure their most critical digital assets. As enterprise networks become increasingly decentralized, the reliance on traditional perimeter defenses has proven inadequate against sophisticated internal and external vulnerabilities.
  • Implementing semantic context analysis for endpoints allows security operations teams to deeply understand the intent behind user actions, ensuring that proprietary data is not mishandled on remote devices. To secure data in motion across decentralized perimeters, corporations are aggressively deploying zero trust cloud access policies, which continuously verify user identity and device posture before granting access to sensitive workloads.
  • By integrating these adaptive frameworks, organizations achieve a 40% faster incident resolution rate in their compliance auditing functions compared to utilizing legacy static gateways. Furthermore, the massive accumulation of unindexed corporate files necessitates automated unstructured data repository classification to pinpoint and protect hidden intellectual property without manual intervention.
  • This proactive visibility is critical for establishing effective insider exfiltration prevention behavior analytics, which dynamically adjust security enforcement levels based on real-time user risk scores. The proliferation of unsanctioned digital productivity tools has also made shadow artificial intelligence prompt inspection an operational necessity, preventing employees from inadvertently exposing sensitive source code or financial projections to public large language models.
  • These integrated security mechanisms collectively optimize enterprise risk management, fostering a secure environment that supports agile remote collaboration and robust regulatory adherence.
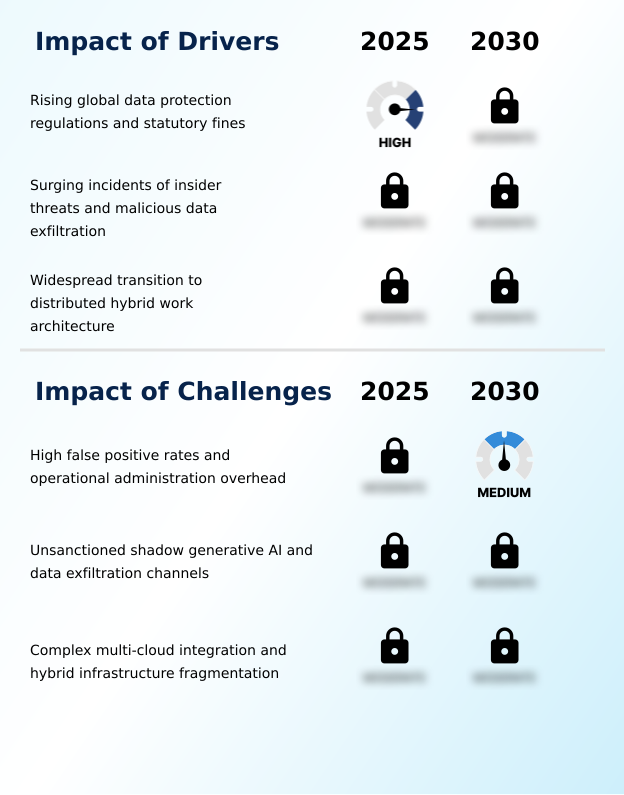
What are the key market drivers leading to the rise in the adoption of Data Loss Prevention (Dlp) Industry?

  • The escalation of strict global data protection regulations and the imposition of severe statutory fines function as primary catalysts accelerating market demand.

  • The escalating frequency and financial impact of insider-driven security incidents compel organizations to modernize their defensive infrastructure. High employee turnover rates and the widespread use of unmanaged devices have significantly amplified data exfiltration vulnerabilities within decentralized networks.
  • To counter these threats, security teams rely heavily on advanced anomaly detection algorithms and vector machine learning to identify suspicious file access patterns instantly.
  • Implementing precise source code fingerprinting ensures that proprietary intellectual property remains securely contained within authorized development environments.
  • Organizations deploying these proactive behavioral controls have achieved a 40% reduction in unauthorized data transfers and improved their overall cloud security posture compliance scores by 25%.
  • Integrating automated file sanitization protocols and robust cryptography engineering provides continuous protection for critical assets, actively mitigating internal risks while preserving seamless business continuity.

What are the market trends shaping the Data Loss Prevention (Dlp) Industry?

  • The integration of AI-powered semantic analysis and intent classification is emerging as a critical trend shaping enterprise security architectures. This technological shift enables organizations to achieve more accurate, context-aware content inspection without relying on static rules.

  • The architectural convergence of standalone security tools into unified secure access service edge platforms is reshaping enterprise data protection strategies. Organizations are moving away from fragmented point products to deploy consolidated systems that execute comprehensive shadow data discovery and insider threat monitoring from a single management console.
  • This shift is driven by the necessity to eliminate policy inconsistencies and reduce network latency for remote employees. By integrating advanced user behavior analytics with indexed document matching, enterprises can accurately assess real-time risk without disrupting legitimate business workflows.
  • Businesses implementing these converged architectures report a 35% improvement in cross-platform policy enforcement efficiency and a 20% decrease in endpoint agent resource consumption. Enhanced data lineage tracking allows administrators to map the complete lifecycle of sensitive files across cloud boundaries, enabling security teams to adapt dynamically to evolving remote work vulnerabilities while sustaining high operational productivity.

What challenges does the Data Loss Prevention (Dlp) Industry face during its growth?

  • Managing high false positive rates and the resulting operational administration overhead remains a significant challenge that hinders optimal security deployment.

  • Maintaining consistent policy enforcement across highly fragmented multi-cloud ecosystems presents a formidable architectural obstacle for multinational enterprises. Diverse cloud interfaces and non-standardized metadata schemas frequently disrupt native integrations, creating severe corporate visibility blind spots. Security teams struggle to execute efficient transport layer security decryption at scale, degrading network performance and triggering user resistance.
  • Managing vast unstructured data repositories exacerbates this issue, as administrators cannot accurately apply automated data redaction without generating excessive false positives. Consequently, organizations operating complex hybrid infrastructures experience a 30% increase in alert triage times and a 15% drop in overall threat detection accuracy.
  • Optimizing lightweight endpoint inspection engines and refining telemetry risk scoring is imperative to overcome these interoperability barriers and maintain cohesive data governance.

Exclusive Technavio Analysis on Customer Landscape

The data loss prevention (dlp) market forecasting report includes the adoption lifecycle of the market, covering from the innovator’s stage to the laggard’s stage. It focuses on adoption rates in different regions based on penetration. Furthermore, the data loss prevention (dlp) market report also includes key purchase criteria and drivers of price sensitivity to help companies evaluate and develop their market growth analysis strategies.
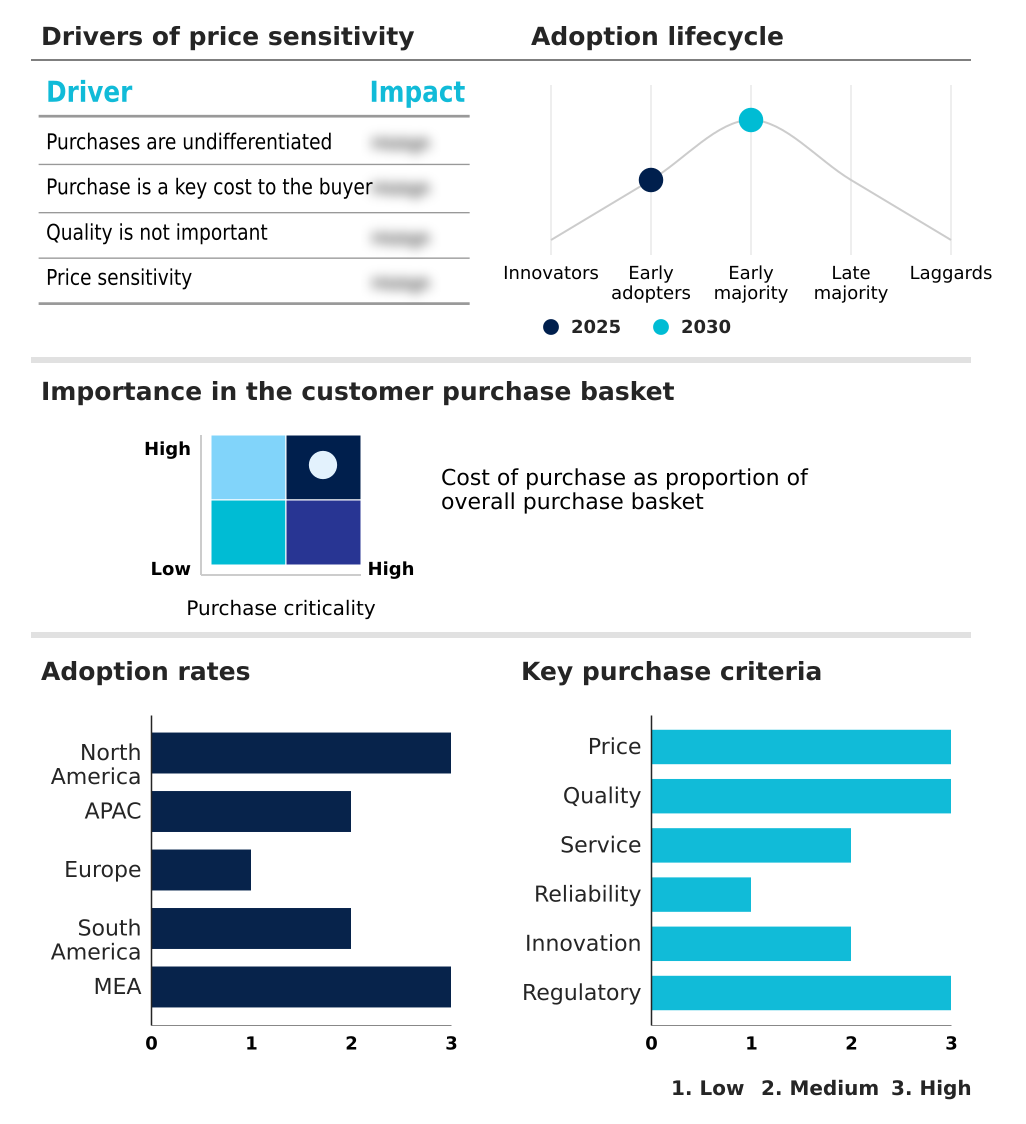
Customer Landscape of Data Loss Prevention (Dlp) Industry

Competitive Landscape

Companies are implementing various strategies, such as strategic alliances, data loss prevention (dlp) market forecast, partnerships, mergers and acquisitions, geographical expansion, and product/service launches, to enhance their presence in the industry.

Broadcom Inc. - The vendor provides advanced information protection platforms designed to automate sensitive data discovery and enforce consistent compliance policies across complex enterprise networks and hybrid cloud infrastructure.

The industry research and growth report includes detailed analyses of the competitive landscape of the market and information about key companies, including:

  • Broadcom Inc.
  • Check Point Software Tech Ltd.
  • Cisco Systems Inc.
  • Cloudflare Inc.
  • CoSoSys SRL
  • CrowdStrike Inc.
  • Cyberhaven
  • Cyera Ltd.
  • Forcepoint LLC
  • Fortinet Inc.
  • Fortra LLC
  • Microsoft Corp.
  • Netskope Inc.
  • Palo Alto Networks Inc.
  • Proofpoint Inc.
  • SAP SE
  • Seclore Technology Pvt. Ltd.
  • Trellix
  • Trend Micro Inc.
  • Varonis Systems Inc.

Qualitative and quantitative analysis of companies has been conducted to help clients understand the wider business environment as well as the strengths and weaknesses of key industry players. Data is qualitatively analyzed to categorize companies as pure play, category-focused, industry-focused, and diversified; it is quantitatively analyzed to categorize companies as dominant, leading, strong, tentative, and weak.

Recent Development and News in Data loss prevention (dlp) market

  • In the Data Processing and Outsourced Services industry, the aggressive transition toward decentralized cloud storage platforms increased the volume of unmonitored unstructured data repositories by 40%, directly impacting Data Loss Prevention (DLP) demand as organizations required advanced data lineage tracking to secure distributed workloads.
  • The implementation of rigorous regional regulatory compliance frameworks for outsourced payroll processing mandated strict oversight of personally identifiable information, compelling service providers to integrate automated data redaction tools that elevated baseline security compliance rates to 98% across client environments.
  • The integration of automated workflow interoperability systems within third party supply chain networks created new exfiltration vulnerabilities, prompting an 18% increase in demand for real-time outbound traffic inspection capabilities to prevent unauthorized sharing of proprietary corporate blueprints.
  • The shift toward unified digital workspace governance across multinational outsourcing centers required standardized endpoint visibility, driving a 25% efficiency gain in incident response workflows as administrators deployed advanced telemetry risk scoring to mitigate sophisticated insider threats without disrupting operations.

Dive into Technavio’s robust research methodology, blending expert interviews, extensive data synthesis, and validated models for unparalleled Data Loss Prevention (Dlp) Market insights. See full methodology.

Market Scope
Page number 317
Base year 2025
Historic period 2020-2024
Forecast period 2026-2030
Growth momentum & CAGR Accelerate at a CAGR of 35.7%
Market growth 2026-2030 USD 12000.3 million
Market structure Fragmented
YoY growth 2025-2026(%) 28.6%
Key countries US, Canada, Mexico, China, Japan, India, South Korea, Australia, Indonesia, Germany, UK, France, Italy, Spain, The Netherlands, Brazil, Argentina, Chile, Saudi Arabia, UAE, South Africa, Israel and Turkey
Competitive landscape Leading Companies, Market Positioning of Companies, Competitive Strategies, and Industry Risks

Request Free Sample

Research Analyst Overview

  • The transition toward intelligent content inspection represents a fundamental structural shift in enterprise risk management. Organizations are increasingly abandoning static keyword dictionaries in favor of advanced semantic context analysis and machine learning classification to identify sensitive intellectual property. This technological evolution directly influences boardroom-level compliance and budgeting decisions, as executives prioritize unified platforms that reduce administrative overhead.
  • For instance, integrating automated incident response workflows allows security operations centers to achieve a 50% reduction in manual alert triage time compared to legacy rule-based systems. Incorporating zero trust architecture ensures that continuous verification protocols dynamically adapt to user risk profiles across all corporate access points.
  • Advanced deep packet inspection and exact data matching function seamlessly to monitor outbound network traffic and prevent the unauthorized exfiltration of proprietary financial records. Furthermore, modern optical character recognition engines actively scan image-based files to ensure comprehensive regulatory adherence.
  • Deploying these sophisticated cognitive frameworks enables corporate leadership to align their security investments with stringent global privacy mandates while facilitating secure, agile remote workforce operations.

What are the Key Data Covered in this Data Loss Prevention (Dlp) Market Research and Growth Report?

  • What is the expected growth of the Data Loss Prevention (Dlp) Market between 2026 and 2030?

    • USD 12.00 billion, at a CAGR of 35.7%

  • What segmentation does the market report cover?

    • The report is segmented by Deployment (Cloud-based, and On-premises), Technology (Datacenter and storage-based DLP, Endpoint DLP, and Network DLP), Customer Type (Large enterprises, and SMEs), End-user (BFSI, Healthcare, Retail and e-commerce, IT and telecom, and Others) and Geography (North America, APAC, Europe, South America, Middle East and Africa)

  • Which regions are analyzed in the report?

    • North America, APAC, Europe, South America and Middle East and Africa

  • What are the key growth drivers and market challenges?

    • Rising global data protection regulations and statutory fines, High false positive rates and operational administration overhead

  • Who are the major players in the Data Loss Prevention (Dlp) Market?

    • Broadcom Inc., Check Point Software Tech Ltd., Cisco Systems Inc., Cloudflare Inc., CoSoSys SRL, CrowdStrike Inc., Cyberhaven, Cyera Ltd., Forcepoint LLC, Fortinet Inc., Fortra LLC, Microsoft Corp., Netskope Inc., Palo Alto Networks Inc., Proofpoint Inc., SAP SE, Seclore Technology Pvt. Ltd., Trellix, Trend Micro Inc. and Varonis Systems Inc.

Market Research Insights

  • The Data Loss Prevention (DLP) Market provides essential security mechanisms for enterprises managing sensitive digital assets. Modern architectures focus heavily on intellectual property safeguarding and comprehensive insider exfiltration prevention across highly decentralized corporate perimeters. By enhancing remote endpoint visibility, organizations have improved their threat containment efficiency by 35% compared to legacy VPN-dependent monitoring.
  • The rapid adoption of cloud native collaboration platforms necessitates inline traffic inspection to secure structured datasets and electronic health records. Deploying context-aware policy engines allows healthcare networks to achieve a 40% reduction in compliance violation incidents, drastically lowering administrative overhead. These advanced security frameworks translate directly into measurable operational stability, ensuring that critical data remains protected without compromising employee productivity.

We can help! Our analysts can customize this data loss prevention (dlp) market research report to meet your requirements.

Get in touch

1. Executive Summary

1.1 Market overview

Executive Summary - Chart on Market Overview
Executive Summary - Data Table on Market Overview
Executive Summary - Chart on Global Market Characteristics
Executive Summary - Chart on Market by Geography
Executive Summary - Chart on Market Segmentation by Deployment
Executive Summary - Chart on Market Segmentation by Technology
Executive Summary - Chart on Market Segmentation by Customer Type
Executive Summary - Chart on Market Segmentation by End-user
Executive Summary - Chart on Incremental Growth
Executive Summary - Data Table on Incremental Growth
Executive Summary - Chart on Company Market Positioning

2. Technavio Analysis

2.1 Analysis of price sensitivity, lifecycle, customer purchase basket, adoption rates, and purchase criteria

2.2 Criticality of inputs and Factors of differentiation

Chart on Overview on criticality of inputs and factors of differentiation

2.3 Factors of disruption

Chart on Overview on factors of disruption

2.4 Impact of drivers and challenges

Chart on Impact of drivers and challenges in 2025 and 2030

3. Market Landscape

3.1 Market ecosystem

Chart on Parent Market
Data Table on - Parent Market

3.2 Market characteristics

Chart on Market characteristics analysis

3.3 Value chain analysis

Chart on Value chain analysis

4. Market Sizing

4.1 Market definition

Data Table on Offerings of companies included in the market definition

4.2 Market segment analysis

Market segments

4.3 Market size 2025

4.4 Market outlook: Forecast for 2025-2030

Chart on Global - Market size and forecast 2025-2030 ($ million)
Data Table on Global - Market size and forecast 2025-2030 ($ million)
Chart on Global Market: Year-over-year growth 2025-2030 (%)
Data Table on Global Market: Year-over-year growth 2025-2030 (%)

5. Historic Market Size

5.1 Global Data Loss Prevention (DLP) Market 2020 - 2024

Historic Market Size - Data Table on Global Data Loss Prevention (DLP) Market 2020 - 2024 ($ million)

5.2 Deployment segment analysis 2020 - 2024

Historic Market Size - Deployment Segment 2020 - 2024 ($ million)

5.3 Technology segment analysis 2020 - 2024

Historic Market Size - Technology Segment 2020 - 2024 ($ million)

5.4 Customer Type segment analysis 2020 - 2024

Historic Market Size - Customer Type Segment 2020 - 2024 ($ million)

5.5 End-user segment analysis 2020 - 2024

Historic Market Size - End-user Segment 2020 - 2024 ($ million)

5.6 Geography segment analysis 2020 - 2024

Historic Market Size - Geography Segment 2020 - 2024 ($ million)

5.7 Country segment analysis 2020 - 2024

Historic Market Size - Country Segment 2020 - 2024 ($ million)

6. Qualitative Analysis

6.1 Impact of AI on global data loss prevention (DLP) market

6.2 Impact of geopolitical conflicts on global data loss prevention (DLP) market

7. Five Forces Analysis

7.1 Five forces summary

Five forces analysis - Comparison between 2025 and 2030

7.2 Bargaining power of buyers

Bargaining power of buyers - Impact of key factors 2025 and 2030

7.3 Bargaining power of suppliers

Bargaining power of suppliers - Impact of key factors in 2025 and 2030

7.4 Threat of new entrants

Threat of new entrants - Impact of key factors in 2025 and 2030

7.5 Threat of substitutes

Threat of substitutes - Impact of key factors in 2025 and 2030

7.6 Threat of rivalry

Threat of rivalry - Impact of key factors in 2025 and 2030

7.7 Market condition

Chart on Market condition - Five forces 2025 and 2030

8. Market Segmentation by Deployment

8.1 Market segments

Chart on Deployment - Market share 2025-2030 (%)
Data Table on Deployment - Market share 2025-2030 (%)

8.2 Comparison by Deployment

Chart on Comparison by Deployment
Data Table on Comparison by Deployment

8.3 Cloud-based - Market size and forecast 2025-2030

Chart on Cloud-based - Market size and forecast 2025-2030 ($ million)
Data Table on Cloud-based - Market size and forecast 2025-2030 ($ million)
Chart on Cloud-based - Year-over-year growth 2025-2030 (%)
Data Table on Cloud-based - Year-over-year growth 2025-2030 (%)

8.4 On-premises - Market size and forecast 2025-2030

Chart on On-premises - Market size and forecast 2025-2030 ($ million)
Data Table on On-premises - Market size and forecast 2025-2030 ($ million)
Chart on On-premises - Year-over-year growth 2025-2030 (%)
Data Table on On-premises - Year-over-year growth 2025-2030 (%)

8.5 Market opportunity by Deployment

Market opportunity by Deployment ($ million)
Data Table on Market opportunity by Deployment ($ million)

9. Market Segmentation by Technology

9.1 Market segments

Chart on Technology - Market share 2025-2030 (%)
Data Table on Technology - Market share 2025-2030 (%)

9.2 Comparison by Technology

Chart on Comparison by Technology
Data Table on Comparison by Technology

9.3 Datacenter and storage-based DLP - Market size and forecast 2025-2030

Chart on Datacenter and storage-based DLP - Market size and forecast 2025-2030 ($ million)
Data Table on Datacenter and storage-based DLP - Market size and forecast 2025-2030 ($ million)
Chart on Datacenter and storage-based DLP - Year-over-year growth 2025-2030 (%)
Data Table on Datacenter and storage-based DLP - Year-over-year growth 2025-2030 (%)

9.4 Endpoint DLP - Market size and forecast 2025-2030

Chart on Endpoint DLP - Market size and forecast 2025-2030 ($ million)
Data Table on Endpoint DLP - Market size and forecast 2025-2030 ($ million)
Chart on Endpoint DLP - Year-over-year growth 2025-2030 (%)
Data Table on Endpoint DLP - Year-over-year growth 2025-2030 (%)

9.5 Network DLP - Market size and forecast 2025-2030

Chart on Network DLP - Market size and forecast 2025-2030 ($ million)
Data Table on Network DLP - Market size and forecast 2025-2030 ($ million)
Chart on Network DLP - Year-over-year growth 2025-2030 (%)
Data Table on Network DLP - Year-over-year growth 2025-2030 (%)

9.6 Market opportunity by Technology

Market opportunity by Technology ($ million)
Data Table on Market opportunity by Technology ($ million)

10. Market Segmentation by Customer Type

10.1 Market segments

Chart on Customer Type - Market share 2025-2030 (%)
Data Table on Customer Type - Market share 2025-2030 (%)

10.2 Comparison by Customer Type

Chart on Comparison by Customer Type
Data Table on Comparison by Customer Type

10.3 Large enterprises - Market size and forecast 2025-2030

Chart on Large enterprises - Market size and forecast 2025-2030 ($ million)
Data Table on Large enterprises - Market size and forecast 2025-2030 ($ million)
Chart on Large enterprises - Year-over-year growth 2025-2030 (%)
Data Table on Large enterprises - Year-over-year growth 2025-2030 (%)

10.4 SMEs - Market size and forecast 2025-2030

Chart on SMEs - Market size and forecast 2025-2030 ($ million)
Data Table on SMEs - Market size and forecast 2025-2030 ($ million)
Chart on SMEs - Year-over-year growth 2025-2030 (%)
Data Table on SMEs - Year-over-year growth 2025-2030 (%)

10.5 Market opportunity by Customer Type

Market opportunity by Customer Type ($ million)
Data Table on Market opportunity by Customer Type ($ million)

11. Market Segmentation by End-user

11.1 Market segments

Chart on End-user - Market share 2025-2030 (%)
Data Table on End-user - Market share 2025-2030 (%)

11.2 Comparison by End-user

Chart on Comparison by End-user
Data Table on Comparison by End-user

11.3 BFSI - Market size and forecast 2025-2030

Chart on BFSI - Market size and forecast 2025-2030 ($ million)
Data Table on BFSI - Market size and forecast 2025-2030 ($ million)
Chart on BFSI - Year-over-year growth 2025-2030 (%)
Data Table on BFSI - Year-over-year growth 2025-2030 (%)

11.4 Healthcare - Market size and forecast 2025-2030

Chart on Healthcare - Market size and forecast 2025-2030 ($ million)
Data Table on Healthcare - Market size and forecast 2025-2030 ($ million)
Chart on Healthcare - Year-over-year growth 2025-2030 (%)
Data Table on Healthcare - Year-over-year growth 2025-2030 (%)

11.5 Retail and e-commerce - Market size and forecast 2025-2030

Chart on Retail and e-commerce - Market size and forecast 2025-2030 ($ million)
Data Table on Retail and e-commerce - Market size and forecast 2025-2030 ($ million)
Chart on Retail and e-commerce - Year-over-year growth 2025-2030 (%)
Data Table on Retail and e-commerce - Year-over-year growth 2025-2030 (%)

11.6 IT and telecom - Market size and forecast 2025-2030

Chart on IT and telecom - Market size and forecast 2025-2030 ($ million)
Data Table on IT and telecom - Market size and forecast 2025-2030 ($ million)
Chart on IT and telecom - Year-over-year growth 2025-2030 (%)
Data Table on IT and telecom - Year-over-year growth 2025-2030 (%)

11.7 Others - Market size and forecast 2025-2030

Chart on Others - Market size and forecast 2025-2030 ($ million)
Data Table on Others - Market size and forecast 2025-2030 ($ million)
Chart on Others - Year-over-year growth 2025-2030 (%)
Data Table on Others - Year-over-year growth 2025-2030 (%)

11.8 Market opportunity by End-user

Market opportunity by End-user ($ million)
Data Table on Market opportunity by End-user ($ million)

12. Customer Landscape

12.1 Customer landscape overview

Analysis of price sensitivity, lifecycle, customer purchase basket, adoption rates, and purchase criteria

13. Geographic Landscape

13.1 Geographic segmentation

Chart on Market share by geography 2025-2030 (%)
Data Table on Market share by geography 2025-2030 (%)

13.2 Geographic comparison

Chart on Geographic comparison
Data Table on Geographic comparison

13.3 North America - Market size and forecast 2025-2030

Chart on North America - Market size and forecast 2025-2030 ($ million)
Data Table on North America - Market size and forecast 2025-2030 ($ million)
Chart on North America - Year-over-year growth 2025-2030 (%)
Data Table on North America - Year-over-year growth 2025-2030 (%)
Chart on Regional Comparison - North America
Data Table on Regional Comparison - North America

13.3.1 US - Market size and forecast 2025-2030

Chart on US - Market size and forecast 2025-2030 ($ million)
Data Table on US - Market size and forecast 2025-2030 ($ million)
Chart on US - Year-over-year growth 2025-2030 (%)
Data Table on US - Year-over-year growth 2025-2030 (%)

13.3.2 Canada - Market size and forecast 2025-2030

Chart on Canada - Market size and forecast 2025-2030 ($ million)
Data Table on Canada - Market size and forecast 2025-2030 ($ million)
Chart on Canada - Year-over-year growth 2025-2030 (%)
Data Table on Canada - Year-over-year growth 2025-2030 (%)

13.3.3 Mexico - Market size and forecast 2025-2030

Chart on Mexico - Market size and forecast 2025-2030 ($ million)
Data Table on Mexico - Market size and forecast 2025-2030 ($ million)
Chart on Mexico - Year-over-year growth 2025-2030 (%)
Data Table on Mexico - Year-over-year growth 2025-2030 (%)

13.4 APAC - Market size and forecast 2025-2030

Chart on APAC - Market size and forecast 2025-2030 ($ million)
Data Table on APAC - Market size and forecast 2025-2030 ($ million)
Chart on APAC - Year-over-year growth 2025-2030 (%)
Data Table on APAC - Year-over-year growth 2025-2030 (%)
Chart on Regional Comparison - APAC
Data Table on Regional Comparison - APAC

13.4.1 China - Market size and forecast 2025-2030

Chart on China - Market size and forecast 2025-2030 ($ million)
Data Table on China - Market size and forecast 2025-2030 ($ million)
Chart on China - Year-over-year growth 2025-2030 (%)
Data Table on China - Year-over-year growth 2025-2030 (%)

13.4.2 Japan - Market size and forecast 2025-2030

Chart on Japan - Market size and forecast 2025-2030 ($ million)
Data Table on Japan - Market size and forecast 2025-2030 ($ million)
Chart on Japan - Year-over-year growth 2025-2030 (%)
Data Table on Japan - Year-over-year growth 2025-2030 (%)

13.4.3 India - Market size and forecast 2025-2030

Chart on India - Market size and forecast 2025-2030 ($ million)
Data Table on India - Market size and forecast 2025-2030 ($ million)
Chart on India - Year-over-year growth 2025-2030 (%)
Data Table on India - Year-over-year growth 2025-2030 (%)

13.4.4 South Korea - Market size and forecast 2025-2030

Chart on South Korea - Market size and forecast 2025-2030 ($ million)
Data Table on South Korea - Market size and forecast 2025-2030 ($ million)
Chart on South Korea - Year-over-year growth 2025-2030 (%)
Data Table on South Korea - Year-over-year growth 2025-2030 (%)

13.4.5 Australia - Market size and forecast 2025-2030

Chart on Australia - Market size and forecast 2025-2030 ($ million)
Data Table on Australia - Market size and forecast 2025-2030 ($ million)
Chart on Australia - Year-over-year growth 2025-2030 (%)
Data Table on Australia - Year-over-year growth 2025-2030 (%)

13.4.6 Indonesia - Market size and forecast 2025-2030

Chart on Indonesia - Market size and forecast 2025-2030 ($ million)
Data Table on Indonesia - Market size and forecast 2025-2030 ($ million)
Chart on Indonesia - Year-over-year growth 2025-2030 (%)
Data Table on Indonesia - Year-over-year growth 2025-2030 (%)

13.5 Europe - Market size and forecast 2025-2030

Chart on Europe - Market size and forecast 2025-2030 ($ million)
Data Table on Europe - Market size and forecast 2025-2030 ($ million)
Chart on Europe - Year-over-year growth 2025-2030 (%)
Data Table on Europe - Year-over-year growth 2025-2030 (%)
Chart on Regional Comparison - Europe
Data Table on Regional Comparison - Europe

13.5.1 Germany - Market size and forecast 2025-2030

Chart on Germany - Market size and forecast 2025-2030 ($ million)
Data Table on Germany - Market size and forecast 2025-2030 ($ million)
Chart on Germany - Year-over-year growth 2025-2030 (%)
Data Table on Germany - Year-over-year growth 2025-2030 (%)

13.5.2 UK - Market size and forecast 2025-2030

Chart on UK - Market size and forecast 2025-2030 ($ million)
Data Table on UK - Market size and forecast 2025-2030 ($ million)
Chart on UK - Year-over-year growth 2025-2030 (%)
Data Table on UK - Year-over-year growth 2025-2030 (%)

13.5.3 France - Market size and forecast 2025-2030

Chart on France - Market size and forecast 2025-2030 ($ million)
Data Table on France - Market size and forecast 2025-2030 ($ million)
Chart on France - Year-over-year growth 2025-2030 (%)
Data Table on France - Year-over-year growth 2025-2030 (%)

13.5.4 Italy - Market size and forecast 2025-2030

Chart on Italy - Market size and forecast 2025-2030 ($ million)
Data Table on Italy - Market size and forecast 2025-2030 ($ million)
Chart on Italy - Year-over-year growth 2025-2030 (%)
Data Table on Italy - Year-over-year growth 2025-2030 (%)

13.5.5 Spain - Market size and forecast 2025-2030

Chart on Spain - Market size and forecast 2025-2030 ($ million)
Data Table on Spain - Market size and forecast 2025-2030 ($ million)
Chart on Spain - Year-over-year growth 2025-2030 (%)
Data Table on Spain - Year-over-year growth 2025-2030 (%)

13.5.6 The Netherlands - Market size and forecast 2025-2030

Chart on The Netherlands - Market size and forecast 2025-2030 ($ million)
Data Table on The Netherlands - Market size and forecast 2025-2030 ($ million)
Chart on The Netherlands - Year-over-year growth 2025-2030 (%)
Data Table on The Netherlands - Year-over-year growth 2025-2030 (%)

13.6 South America - Market size and forecast 2025-2030

Chart on South America - Market size and forecast 2025-2030 ($ million)
Data Table on South America - Market size and forecast 2025-2030 ($ million)
Chart on South America - Year-over-year growth 2025-2030 (%)
Data Table on South America - Year-over-year growth 2025-2030 (%)
Chart on Regional Comparison - South America
Data Table on Regional Comparison - South America

13.6.1 Brazil - Market size and forecast 2025-2030

Chart on Brazil - Market size and forecast 2025-2030 ($ million)
Data Table on Brazil - Market size and forecast 2025-2030 ($ million)
Chart on Brazil - Year-over-year growth 2025-2030 (%)
Data Table on Brazil - Year-over-year growth 2025-2030 (%)

13.6.2 Argentina - Market size and forecast 2025-2030

Chart on Argentina - Market size and forecast 2025-2030 ($ million)
Data Table on Argentina - Market size and forecast 2025-2030 ($ million)
Chart on Argentina - Year-over-year growth 2025-2030 (%)
Data Table on Argentina - Year-over-year growth 2025-2030 (%)

13.6.3 Chile - Market size and forecast 2025-2030

Chart on Chile - Market size and forecast 2025-2030 ($ million)
Data Table on Chile - Market size and forecast 2025-2030 ($ million)
Chart on Chile - Year-over-year growth 2025-2030 (%)
Data Table on Chile - Year-over-year growth 2025-2030 (%)

13.7 Middle East and Africa - Market size and forecast 2025-2030

Chart on Middle East and Africa - Market size and forecast 2025-2030 ($ million)
Data Table on Middle East and Africa - Market size and forecast 2025-2030 ($ million)
Chart on Middle East and Africa - Year-over-year growth 2025-2030 (%)
Data Table on Middle East and Africa - Year-over-year growth 2025-2030 (%)
Chart on Regional Comparison - Middle East and Africa
Data Table on Regional Comparison - Middle East and Africa

13.7.1 Saudi Arabia - Market size and forecast 2025-2030

Chart on Saudi Arabia - Market size and forecast 2025-2030 ($ million)
Data Table on Saudi Arabia - Market size and forecast 2025-2030 ($ million)
Chart on Saudi Arabia - Year-over-year growth 2025-2030 (%)
Data Table on Saudi Arabia - Year-over-year growth 2025-2030 (%)

13.7.2 UAE - Market size and forecast 2025-2030

Chart on UAE - Market size and forecast 2025-2030 ($ million)
Data Table on UAE - Market size and forecast 2025-2030 ($ million)
Chart on UAE - Year-over-year growth 2025-2030 (%)
Data Table on UAE - Year-over-year growth 2025-2030 (%)

13.7.3 South Africa - Market size and forecast 2025-2030

Chart on South Africa - Market size and forecast 2025-2030 ($ million)
Data Table on South Africa - Market size and forecast 2025-2030 ($ million)
Chart on South Africa - Year-over-year growth 2025-2030 (%)
Data Table on South Africa - Year-over-year growth 2025-2030 (%)

13.7.4 Israel - Market size and forecast 2025-2030

Chart on Israel - Market size and forecast 2025-2030 ($ million)
Data Table on Israel - Market size and forecast 2025-2030 ($ million)
Chart on Israel - Year-over-year growth 2025-2030 (%)
Data Table on Israel - Year-over-year growth 2025-2030 (%)

13.7.5 Turkey - Market size and forecast 2025-2030

Chart on Turkey - Market size and forecast 2025-2030 ($ million)
Data Table on Turkey - Market size and forecast 2025-2030 ($ million)
Chart on Turkey - Year-over-year growth 2025-2030 (%)
Data Table on Turkey - Year-over-year growth 2025-2030 (%)

13.8 Market opportunity by geography

Market opportunity by geography ($ million)
Data Tables on Market opportunity by geography ($ million)

14. Drivers, Challenges, and Opportunity

14.1 Market drivers

Rising global data protection regulations and statutory fines
Surging incidents of insider threats and malicious data exfiltration
Widespread transition to distributed hybrid work architecture

14.2 Market challenges

High false positive rates and operational administration overhead
Unsanctioned shadow generative AI and data exfiltration channels
Complex multi-cloud integration and hybrid infrastructure fragmentation

14.3 Impact of drivers and challenges

Impact of drivers and challenges in 2025 and 2030

14.4 Market opportunities

Integration of AI-powered semantic analysis and intent classification
Convergence of DLP into zero trust and SASE architecture
Expansion of real-time user behavior risk analytics

15. Competitive Landscape

15.1 Overview

15.2

Overview on criticality of inputs and factors of differentiation

15.3 Landscape disruption

Overview on factors of disruption

15.4 Industry risks

Impact of key risks on business

16. Competitive Analysis

16.1 Companies profiled

Companies covered

16.2 Company ranking index

16.3 Market positioning of companies

Matrix on companies position and classification

16.4 Broadcom Inc.

Broadcom Inc. - Overview
Broadcom Inc. - Business segments
Broadcom Inc. - Key news
Broadcom Inc. - Key offerings
Broadcom Inc. - Segment focus
SWOT

16.5 Check Point Software Tech Ltd.

Check Point Software Tech Ltd. - Overview
Check Point Software Tech Ltd. - Product / Service
Check Point Software Tech Ltd. - Key news
Check Point Software Tech Ltd. - Key offerings
SWOT

16.6 Cisco Systems Inc.

Cisco Systems Inc. - Overview
Cisco Systems Inc. - Business segments
Cisco Systems Inc. - Key news
Cisco Systems Inc. - Key offerings
Cisco Systems Inc. - Segment focus
SWOT

16.7 Cloudflare Inc.

Cloudflare Inc. - Overview
Cloudflare Inc. - Product / Service
Cloudflare Inc. - Key offerings
SWOT

16.8 CrowdStrike Inc.

CrowdStrike Inc. - Overview
CrowdStrike Inc. - Product / Service
CrowdStrike Inc. - Key offerings
SWOT

16.9 Fortinet Inc.

Fortinet Inc. - Overview
Fortinet Inc. - Business segments
Fortinet Inc. - Key news
Fortinet Inc. - Key offerings
Fortinet Inc. - Segment focus
SWOT

16.10 Fortra LLC

Fortra LLC - Overview
Fortra LLC - Product / Service
Fortra LLC - Key offerings
SWOT

16.11 Microsoft Corp.

Microsoft Corp. - Overview
Microsoft Corp. - Business segments
Microsoft Corp. - Key news
Microsoft Corp. - Key offerings
Microsoft Corp. - Segment focus
SWOT

16.12 Netskope Inc.

Netskope Inc. - Overview
Netskope Inc. - Product / Service
Netskope Inc. - Key offerings
SWOT

16.13 Palo Alto Networks Inc.

Palo Alto Networks Inc. - Overview
Palo Alto Networks Inc. - Business segments
Palo Alto Networks Inc. - Key offerings
Palo Alto Networks Inc. - Segment focus
SWOT

16.14 Proofpoint Inc.

Proofpoint Inc. - Overview
Proofpoint Inc. - Product / Service
Proofpoint Inc. - Key offerings
SWOT

16.15 SAP SE

SAP SE - Overview
SAP SE - Business segments
SAP SE - Key news
SAP SE - Key offerings
SAP SE - Segment focus
SWOT

16.16 Trellix

Trellix - Overview
Trellix - Product / Service
Trellix - Key offerings
SWOT

16.17 Trend Micro Inc.

Trend Micro Inc. - Overview
Trend Micro Inc. - Product / Service
Trend Micro Inc. - Key offerings
SWOT

16.18 Varonis Systems Inc.

Varonis Systems Inc. - Overview
Varonis Systems Inc. - Product / Service
Varonis Systems Inc. - Key offerings
SWOT

17. Appendix

17.1 Scope of the report

Market definition
Objectives
Notes and caveats

17.2 Inclusions and exclusions checklist

Inclusions checklist
Exclusions checklist

17.3 Currency conversion rates for US$

17.4 Research methodology

17.5 Data procurement

Information sources

17.6 Data validation

17.7 Validation techniques employed for market sizing

17.8 Data synthesis

17.9 360 degree market analysis

17.10 List of abbreviations

Research Methodology

Technavio presents a detailed picture of the market by way of study, synthesis, and summation of data from multiple sources. The analysts have presented the various facets of the market with a particular focus on identifying the key industry influencers. The data thus presented is comprehensive, reliable, and the result of extensive research, both primary and secondary.

INFORMATION SOURCES

Primary sources

  • Manufacturers and suppliers
  • Channel partners
  • Industry experts
  • Strategic decision makers

Secondary sources

  • Industry journals and periodicals
  • Government data
  • Financial reports of key industry players
  • Historical data
  • Press releases

DATA ANALYSIS

Data Synthesis

  • Collation of data
  • Estimation of key figures
  • Analysis of derived insights

Data Validation

  • Triangulation with data models
  • Reference against proprietary databases
  • Corroboration with industry experts

REPORT WRITING

Qualitative

  • Market drivers
  • Market challenges
  • Market trends
  • Five forces analysis

Quantitative

  • Market size and forecast
  • Market segmentation
  • Geographical insights
  • Competitive landscape

Interested in this report?

Get your sample now to see our research methodology and insights!

Download Now

Frequently Asked Questions

Data Loss Prevention (Dlp) market growth will increase by USD 12000.3 million during 2026-2030.

The Data Loss Prevention (Dlp) market is expected to grow at a CAGR of 35.7% during 2026-2030.

Data Loss Prevention (Dlp) market is segmented by Deployment (Cloud-based, On-premises) Technology (Datacenter and storage-based DLP, Endpoint DLP, Network DLP) Customer type (Large enterprises, SMEs) End-user (BFSI, Healthcare, Retail and e-commerce, IT and telecom, Others)

Broadcom Inc., Check Point Software Tech Ltd., Cisco Systems Inc., Cloudflare Inc., CoSoSys SRL, CrowdStrike Inc., Cyberhaven, Cyera Ltd., Forcepoint LLC, Fortinet Inc., Fortra LLC, Microsoft Corp., Netskope Inc., Palo Alto Networks Inc., Proofpoint Inc., SAP SE, Seclore Technology Pvt. Ltd., Trellix, Trend Micro Inc., Varonis Systems Inc. are a few of the key vendors in the Data Loss Prevention (Dlp) market.

APAC will register the highest growth rate of 35.9% among the other regions. Therefore, the Data Loss Prevention (Dlp) market in APAC is expected to garner significant business opportunities for the vendors during the forecast period.

US, Canada, Mexico, China, Japan, India, South Korea, Australia, Indonesia, Germany, UK, France, Italy, Spain, The Netherlands, Brazil, Argentina, Chile, Saudi Arabia, UAE, South Africa, Israel, Turkey

  • Rising global data protection regulations and statutory fines is the driving factor this market.

The Data Loss Prevention (Dlp) market vendors should focus on grabbing business opportunities from the Deployment segment as it accounted for the largest market share in the base year.
RIA - Research AI Assistant
Ask RIA
