
Democratization Of AI Market Size 2025-2029
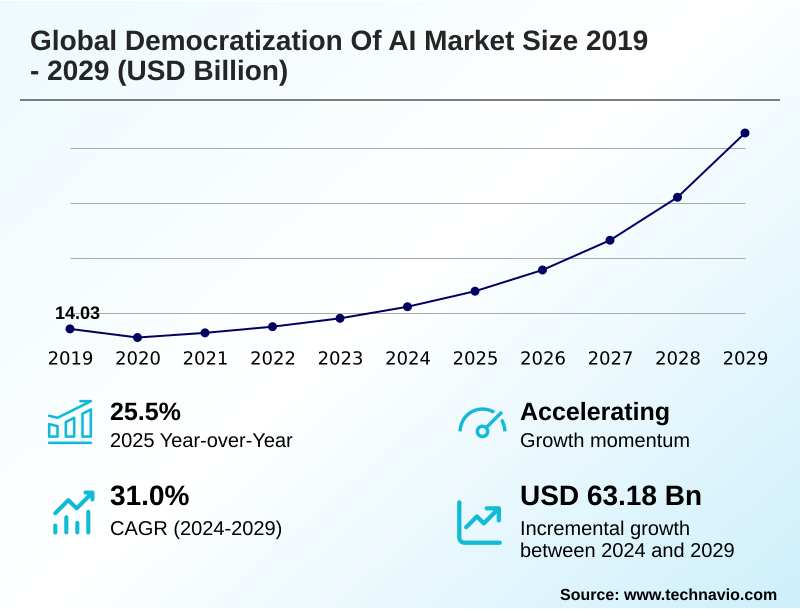
The democratization of ai market size is valued to increase by USD 63.18 billion, at a CAGR of 31% from 2024 to 2029. Proliferation of open-source models and frameworks will drive the democratization of ai market.
Major Market Trends & Insights
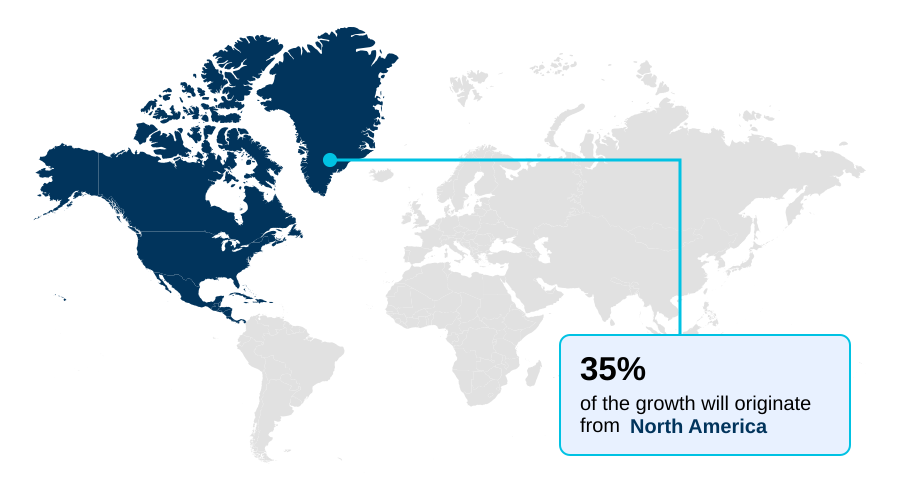
- North America dominated the market and accounted for a 34.9% growth during the forecast period.
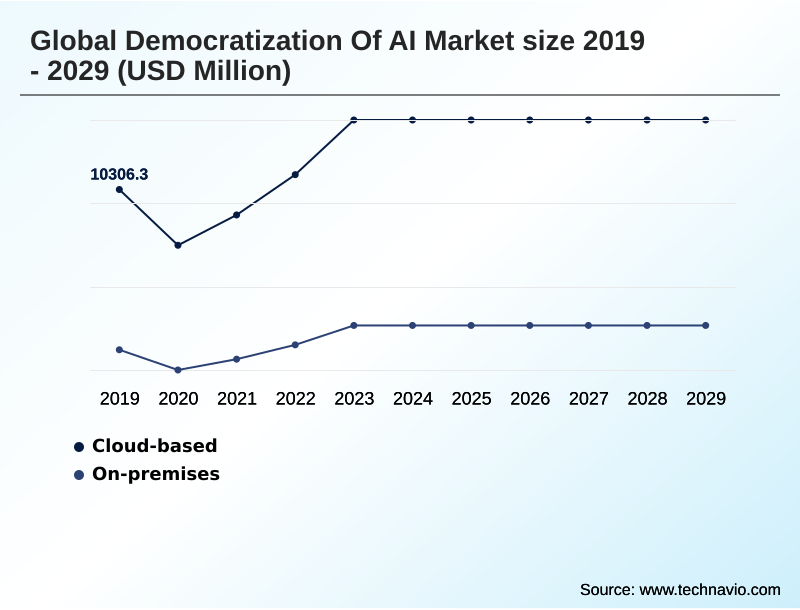
- By Deployment - Cloud-based segment was valued at USD 13.16 billion in 2023
- By Technology - Machine learning (ML) segment accounted for the largest market revenue share in 2023
Market Size & Forecast
- Market Opportunities: USD 71.25 billion
- Market Future Opportunities: USD 63.18 billion
- CAGR from 2024 to 2029 : 31%
Market Summary
- The democratization of AI market is defined by the widespread accessibility of platforms and tools that lower traditional barriers to entry, such as cost and specialized expertise. This shift is driven by the availability of open-source AI models, the scalability of cloud-based AI services, and the rise of low-code AI platforms.
- These technologies enable a broader range of users, from developers to business analysts, to build and deploy sophisticated applications. For example, a mid-sized e-commerce firm can now leverage a machine learning as a service (MLaaS) platform to create a highly accurate demand forecasting system, a task that previously required a dedicated team of data scientists.
- The market is also characterized by the rapid integration of generative AI integration capabilities into existing enterprise software. However, this accessibility introduces challenges, including the need for robust AI model governance and frameworks for algorithmic bias mitigation to ensure responsible and ethical implementation.
- The evolution toward multimodal AI models and edge AI deployment further expands the scope of potential applications, transforming industries by making intelligent technology a ubiquitous utility rather than a niche specialty.
What will be the Size of the Democratization Of AI Market during the forecast period?
Get Key Insights on Market Forecast (PDF) Get Free Sample
How is the Democratization Of AI Market Segmented?
The democratization of ai industry research report provides comprehensive data (region-wise segment analysis), with forecasts and estimates in "USD million" for the period 2025-2029, as well as historical data from 2019-2023 for the following segments.
- Deployment
- Cloud-based
- On-premises
- Technology
- Machine learning (ML)
- NLP
- Computer vision
- Speech recognition
- RPA
- End-user
- BFSI
- Retail
- Healthcare
- Manufacturing
- Others
- Geography
- North America
- US
- Canada
- Mexico
- APAC
- China
- Japan
- India
- Europe
- Germany
- UK
- France
- Middle East and Africa
- Saudi Arabia
- Turkey
- UAE
- South America
- Brazil
- Argentina
- Colombia
- Rest of World (ROW)
- North America
By Deployment Insights
The cloud-based segment is estimated to witness significant growth during the forecast period.
The market is segmented by deployment, application, and end-user. The cloud-based deployment model serves as the primary engine for the global democratization of AI.
This segment abstracts away the complexities of AI infrastructure, offering on-demand access to computational resources and managed services. The core of this segment includes machine learning as a service (MLaaS) and managed foundation model platforms.
Key developments in this area include serverless access to a wide range of foundation models through single APIs, simplifying experimentation and deployment.
This approach brings AI directly to the data, a trend exemplified by the integration of AI capabilities into cloud data platforms, which empowers users to leverage large language models using familiar SQL commands.
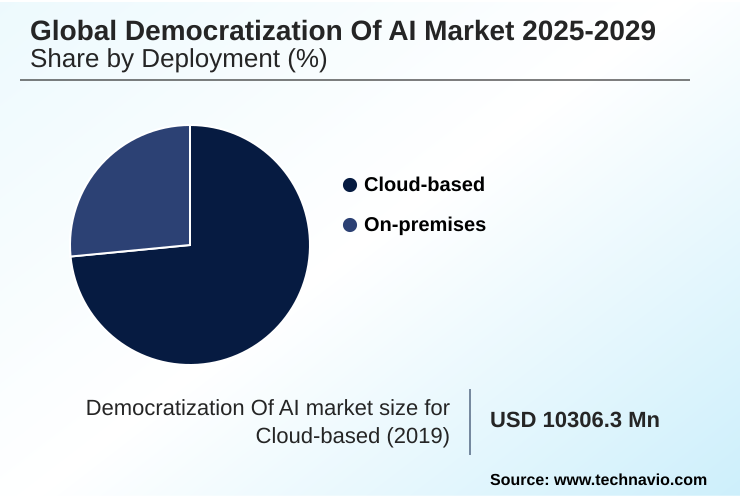
The Cloud-based segment was valued at USD 13.16 billion in 2023 and showed a gradual increase during the forecast period.
Regional Analysis
North America is estimated to contribute 34.9% to the growth of the global market during the forecast period.Technavio’s analysts have elaborately explained the regional trends and drivers that shape the market during the forecast period.
See How Democratization Of AI Market Demand is Rising in North America Get Free Sample
The global democratization of AI market exhibits a varied geographic landscape, with North America leading in foundational model development and market maturity, accounting for approximately 35% of incremental growth.
This region's dominance is driven by intense competition among hyperscalers and a vibrant open-source movement. In contrast, the APAC region is characterized by rapid adoption fueled by government-led initiatives and a massive developer base, with countries building sovereign AI capabilities.
Europe distinguishes itself through a strong focus on regulation and data sovereignty, shaping development through frameworks like the EU AI Act. The use of conversational AI assistants and computer vision platforms is growing across all regions.
The adoption of AI in the manufacturing sector in Germany has led to a 15% reduction in predictive maintenance errors.
Market Dynamics
Our researchers analyzed the data with 2024 as the base year, along with the key drivers, trends, and challenges. A holistic analysis of drivers will help companies refine their marketing strategies to gain a competitive advantage.
- Enterprises are increasingly navigating the complexities of adopting advanced artificial intelligence, often starting by comparing open-source vs proprietary AI models to align with budget and security requirements. This evaluation frequently leads to deploying open-source AI models on-premises, especially for data-sensitive healthcare applications, ensuring data remains within the corporate firewall.
- The trend of generative AI integration in enterprise data platforms allows organizations to unlock insights from existing data warehouses. Furthermore, the rise of low-code AI platforms for business analysts empowers non-technical staff to create solutions, democratizing development beyond specialized teams.
- This approach is particularly effective for implementing AI-driven predictive maintenance in manufacturing, which has been shown to reduce equipment downtime by more than half compared to traditional schedules. Companies are also exploring multimodal AI models for customer experience, combining text, voice, and image analysis to create more intuitive interactions.
- To manage this expanding ecosystem, firms are automating compliance with AI governance frameworks to mitigate risks. The use of small language models for edge AI applications is another critical area, enabling real-time processing on-device. The role of explainable AI in regulated industries, such as the BFSI sector, is paramount for ensuring transparency and trust.
- To stay competitive, businesses are building sovereign AI capabilities and utilizing retrieval-augmented generation for enterprise search to provide more accurate results.
What are the key market drivers leading to the rise in the adoption of Democratization Of AI Industry?
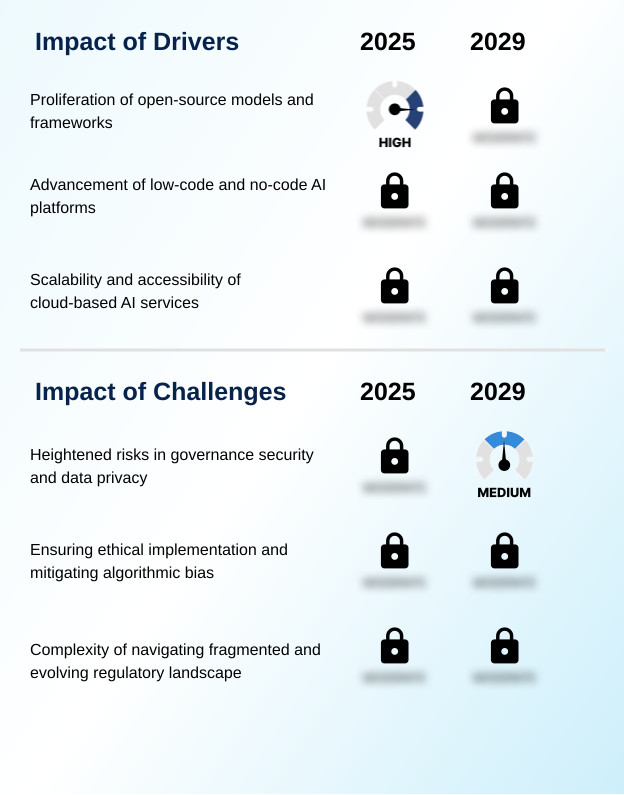
- The proliferation of open-source models and frameworks is a key driver accelerating market growth and innovation.
- The primary driver fueling the democratization of AI is the proliferation of high-performance, open-source AI models, which lowers cost barriers and fosters a collaborative ecosystem.
- This is complemented by the rapid advancement of low-code AI platforms and no-code AI platforms, which abstract away technical complexity and enable non-specialists to build applications.
- These platforms have been shown to accelerate development cycles by up to 70% compared to traditional coding methods.
- The scalability and comprehensive nature of cloud-based AI services provide the essential infrastructure, offering everything from machine learning as a service (MLaaS) to enterprise-grade AI solutions on a pay-as-you-go basis.
- The availability of large language models (LLMs) and mixture-of-experts models through simple APIs further reduces friction, allowing developers to integrate powerful AI copilot functionalities into a wide array of software.
- This flourishing ecosystem is centralized by platforms that serve as hubs for models and tools.
What are the market trends shaping the Democratization Of AI Industry?
- The increasing prevalence of smaller, more efficient language models represents a significant market trend. This shift is enabling the deployment of AI capabilities on edge devices.
- Key trends are reshaping the democratization of AI market, pushing capabilities toward greater efficiency and broader application. A primary shift is toward small language models (SLMs) and edge AI deployment, which enables on-device processing and reduces latency for real-time applications, with some implementations lowering data transmission costs by 75%.
- Another transformative trend is the standardization of multimodal AI models, which can interpret and generate content across text, image, and audio formats, improving contextual understanding in complex scenarios. The use of foundation model APIs for capabilities like zero-shot object segmentation and custom neural voice is becoming widespread.
- This convergence of modalities has shown to improve sentiment analysis accuracy by over 20% compared to text-only systems. Finally, the deep integration of generative design and AI capabilities directly into enterprise data platforms allows users to leverage advanced analytics within their existing workflows, accelerating insight generation.
What challenges does the Democratization Of AI Industry face during its growth?
- Heightened risks related to governance, security, and data privacy present a key challenge to the industry's growth trajectory.
- While the democratization of AI accelerates innovation, it introduces significant challenges that can restrain growth. The widespread availability of user-friendly tools creates heightened risks in governance, security, and data privacy, as ungoverned 'shadow AI' usage can increase the risk of sensitive data exposure by over 40%.
- Ensuring ethical AI implementation and mitigating algorithmic bias is another fundamental hurdle; without proper bias detection techniques and oversight, AI systems can perpetuate discriminatory outcomes. Navigating a fragmented and evolving global regulatory landscape adds another layer of complexity.
- The divergence in international policies on AI model transparency and data privacy can increase compliance overhead for multinational firms by up to 25%, creating a substantial barrier for organizations lacking dedicated legal teams to implement the necessary controls.
Exclusive Technavio Analysis on Customer Landscape
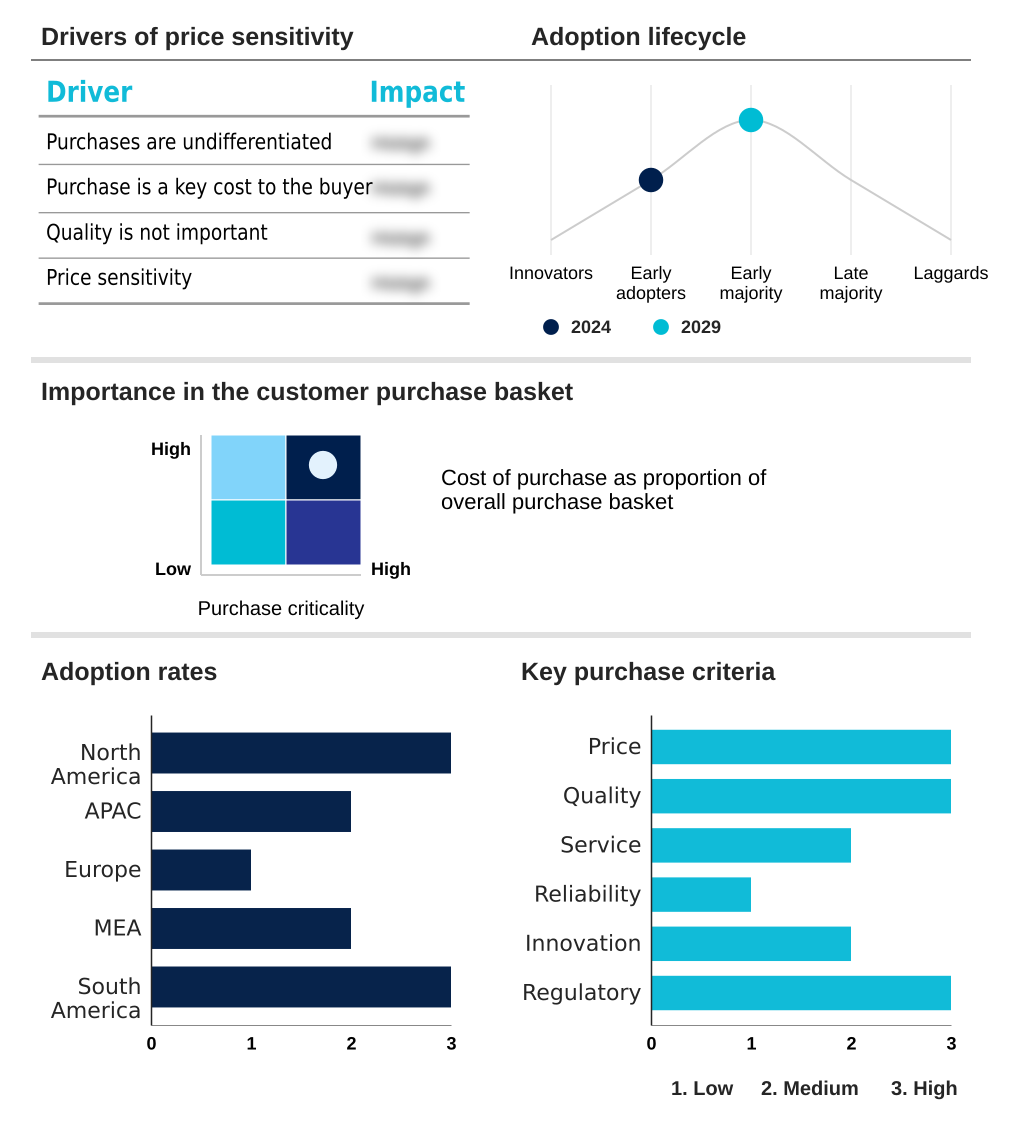
The democratization of ai market forecasting report includes the adoption lifecycle of the market, covering from the innovator’s stage to the laggard’s stage. It focuses on adoption rates in different regions based on penetration. Furthermore, the democratization of ai market report also includes key purchase criteria and drivers of price sensitivity to help companies evaluate and develop their market growth analysis strategies.
Customer Landscape of Democratization Of AI Industry
Competitive Landscape
Companies are implementing various strategies, such as strategic alliances, democratization of ai market forecast, partnerships, mergers and acquisitions, geographical expansion, and product/service launches, to enhance their presence in the industry.
Alteryx Inc. - Key offerings center on MLaaS, no-code platforms, and accessible APIs, enabling rapid deployment of advanced AI capabilities without extensive in-house expertise.
The industry research and growth report includes detailed analyses of the competitive landscape of the market and information about key companies, including:
- Alteryx Inc.
- Amazon.com Inc.
- Anthropic
- C3.ai Inc.
- Cohere
- Databricks Inc.
- Dataiku Inc.
- DataRobot Inc.
- Google LLC
- H2O.ai Inc.
- Hugging Face
- IBM Corp.
- Microsoft Corp.
- NVIDIA Corp.
- OpenAI
- Oracle Corp.
- Pegasystems Inc.
- Salesforce Inc.
- SAP SE
- UiPath Inc.
Qualitative and quantitative analysis of companies has been conducted to help clients understand the wider business environment as well as the strengths and weaknesses of key industry players. Data is qualitatively analyzed to categorize companies as pure play, category-focused, industry-focused, and diversified; it is quantitatively analyzed to categorize companies as dominant, leading, strong, tentative, and weak.
Recent Development and News in Democratization of ai market
- In September, 2024, Meta is expected to release its next-generation open-source model, Llama 4, providing a powerful, commercially viable foundation for developers and enterprises to build custom generative AI applications with enhanced reasoning and efficiency.
- In November, 2024, Microsoft will likely announce the general availability of a new Azure AI service designed for building and managing multimodal applications, integrating models from OpenAI and Hugging Face in a secure, enterprise-grade environment.
- In January, 2025, a strategic partnership between a major industrial conglomerate and a leading cloud provider is anticipated to launch an AI copilot for manufacturing, helping engineers accelerate automation code generation and optimize production processes.
- In March, 2025, the European Union is projected to reach a new implementation milestone for the AI Act, releasing finalized technical standards for high-risk AI systems, which will significantly impact compliance and governance protocols globally.
Dive into Technavio’s robust research methodology, blending expert interviews, extensive data synthesis, and validated models for unparalleled Democratization Of AI Market insights. See full methodology.
| Market Scope | |
|---|---|
| Page number | 307 |
| Base year | 2024 |
| Historic period | 2019-2023 |
| Forecast period | 2025-2029 |
| Growth momentum & CAGR | Accelerate at a CAGR of 31% |
| Market growth 2025-2029 | USD 63180.3 million |
| Market structure | Fragmented |
| YoY growth 2024-2025(%) | 25.5% |
| Key countries | US, Canada, Mexico, China, Japan, India, South Korea, Australia, Singapore, Germany, UK, France, Italy, Spain, Sweden, Saudi Arabia, Turkey, UAE, South Africa, Egypt, Brazil, Argentina and Colombia |
| Competitive landscape | Leading Companies, Market Positioning of Companies, Competitive Strategies, and Industry Risks |
Research Analyst Overview
- The democratization of AI market reflects a fundamental shift from specialized, high-cost technology to accessible, utility-grade services. This transformation is underpinned by the availability of powerful large language models (LLMs) and unified AI platforms from key vendors.
- The proliferation of low-code AI platforms and no-code AI platforms empowers a new class of builders, while open-source AI models provide cost-effective alternatives to proprietary systems. A key trend impacting boardroom strategy is the rise of small language models (SLMs) for edge AI deployment.
- This moves computation away from centralized cloud-based AI services, addressing data privacy concerns and reducing latency for applications like on-device speech recognition models, which have achieved response time improvements of over 90%. Consequently, enterprises are re-evaluating infrastructure spend, balancing on-premises AI deployment with hybrid cloud strategies.
- This dynamic environment necessitates robust AI model fine-tuning and governance to manage the entire AI development lifecycle and harness technologies like generative AI integration and automated machine learning (AutoML) effectively.
What are the Key Data Covered in this Democratization Of AI Market Research and Growth Report?
-
What is the expected growth of the Democratization Of AI Market between 2025 and 2029?
-
USD 63.18 billion, at a CAGR of 31%
-
-
What segmentation does the market report cover?
-
The report is segmented by Deployment (Cloud-based, and On-premises), Technology (Machine learning (ML), NLP, Computer vision, Speech recognition, and RPA), End-user (BFSI, Retail, Healthcare, Manufacturing, and Others) and Geography (North America, APAC, Europe, Middle East and Africa, South America)
-
-
Which regions are analyzed in the report?
-
North America, APAC, Europe, Middle East and Africa and South America
-
-
What are the key growth drivers and market challenges?
-
Proliferation of open-source models and frameworks, Heightened risks in governance security and data privacy
-
-
Who are the major players in the Democratization Of AI Market?
-
Alteryx Inc., Amazon.com Inc., Anthropic, C3.ai Inc., Cohere, Databricks Inc., Dataiku Inc., DataRobot Inc., Google LLC, H2O.ai Inc., Hugging Face, IBM Corp., Microsoft Corp., NVIDIA Corp., OpenAI, Oracle Corp., Pegasystems Inc., Salesforce Inc., SAP SE and UiPath Inc.
-
Market Research Insights
- The democratization of AI market is shaped by competing dynamics that both accelerate and restrain adoption. The availability of powerful, open-source AI models and enterprise-grade AI platforms drives innovation, with low-code AI platforms accelerating development cycles by over 60%.
- This accessibility is counterbalanced by significant shadow AI risk management concerns, as ungoverned model usage can increase data leakage potential by up to 45%. Organizations must therefore implement robust AI governance frameworks and prioritize AI talent development. While AI for supply chain optimization offers clear ROI, achieving success requires a data-centric AI approach and careful attention to responsible AI development.
- The rise of sovereign AI capabilities also reflects geopolitical and data sovereignty pressures, forcing a re-evaluation of purely cloud-based strategies.
We can help! Our analysts can customize this democratization of ai market research report to meet your requirements.
 RIA -
RIA - 
