Department Stores Market Size 2025-2029
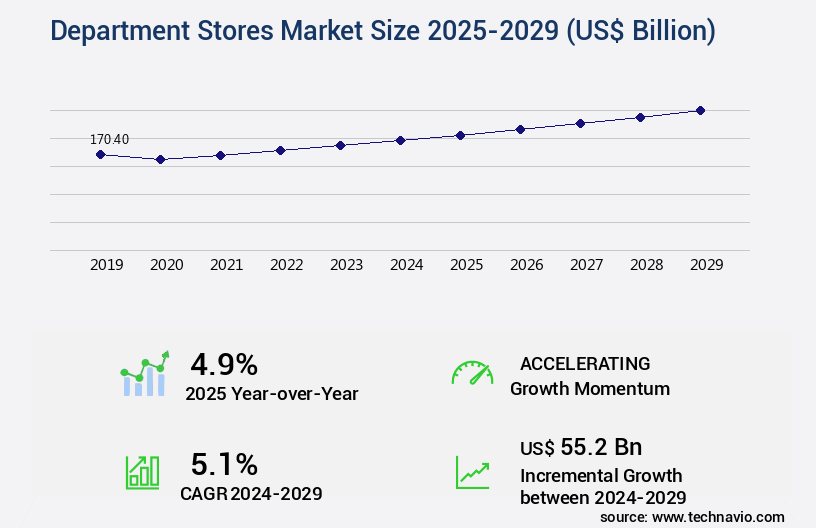
The department stores market size is valued to increase by USD 55.2 billion, at a CAGR of 5.1% from 2024 to 2029. Urbanization and rising disposable income will drive the department stores market.
Major Market Trends & Insights
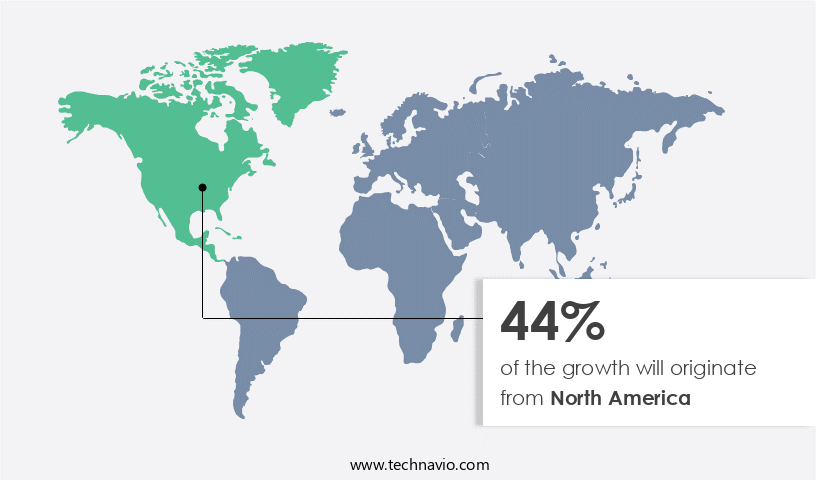
- North America dominated the market and accounted for a 44% growth during the forecast period.
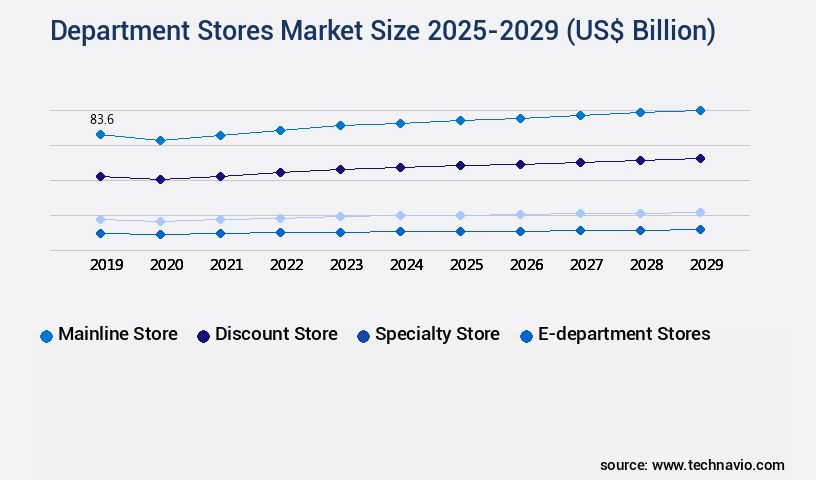
- By Type - Mainline store segment was valued at USD 83.60 billion in 2023
- By Product - Hardline and softline segment accounted for the largest market revenue share in 2023
Market Size & Forecast
- Market Opportunities: USD 46.54 billion
- Market Future Opportunities: USD 55.20 billion
- CAGR from 2024 to 2029 : 5.1%
Market Summary
- The market is experiencing significant transformation as urbanization and rising disposable income drive consumer demand for diverse and high-quality shopping experiences. This trend is leading retailers to focus on experiential retailing, offering unique in-store experiences to differentiate themselves from e-commerce competitors. However, this shift comes with challenges. Supply chain optimization is crucial to ensure stock availability and reduce operational inefficiencies. For instance, a leading department store chain improved its inventory turnover by 12% through advanced demand forecasting and real-time inventory management. Moreover, regulatory compliance is a major concern for department stores, especially in areas such as data privacy and labor laws.
- Adhering to these regulations not only ensures business continuity but also builds trust with customers. Additionally, e-commerce giants continue to pose a threat with their convenience and competitive pricing. To counteract this, department stores are investing in digital technologies, such as mobile apps and personalized marketing, to enhance the shopping experience and drive customer loyalty. In conclusion, the market is undergoing a period of transformation, driven by urbanization, rising disposable income, and the need for experiential retailing. Retailers are addressing challenges related to supply chain optimization and regulatory compliance while leveraging digital technologies to compete effectively with e-commerce players.
What will be the Size of the Department Stores Market during the forecast period?
Get Key Insights on Market Forecast (PDF) Request Free Sample
How is the Department Stores Market Segmented ?
The department stores industry research report provides comprehensive data (region-wise segment analysis), with forecasts and estimates in "USD billion" for the period 2025-2029, as well as historical data from 2019-2023 for the following segments.
- Type
- Mainline store
- Discount store
- Specialty store
- E-department stores
- Product
- Hardline and softline
- Apparel and accessories
- FMCG
- Geography
- North America
- US
- Canada
- Europe
- France
- Germany
- Italy
- UK
- APAC
- China
- India
- Japan
- South Korea
- Rest of World (ROW)
- North America
By Type Insights
The mainline store segment is estimated to witness significant growth during the forecast period.
Mainline department stores continue to dominate the global market, offering a comprehensive, omnichannel retail experience. With a focus on product assortment planning and omni-channel customer experience, these establishments integrate mobile payment processing and e-commerce platform integration to cater to evolving consumer preferences. Retailers like Macy's, Galeries Lafayette, John Lewis, and El Corte Ingles prioritize supply chain optimization, promotional campaign management, and sales associate training to ensure a seamless shopping journey. Store layout and shelf space optimization, Retail Analytics dashboards, and customer segmentation strategies are employed to enhance the in-store experience. Advanced technologies such as marketing automation tools, inventory management systems, and fraud detection systems support Data Analytics retail and customer relationship management.
Predictive modeling retail and store operations management contribute to pricing strategies optimization and personalized recommendations. A key example of this evolution is the integration of retail technology infrastructure, including employee scheduling software, sales forecasting models, loss prevention techniques, and visual merchandising techniques. In 2021, these mainline department stores accounted for approximately 50% of the global department store market share.
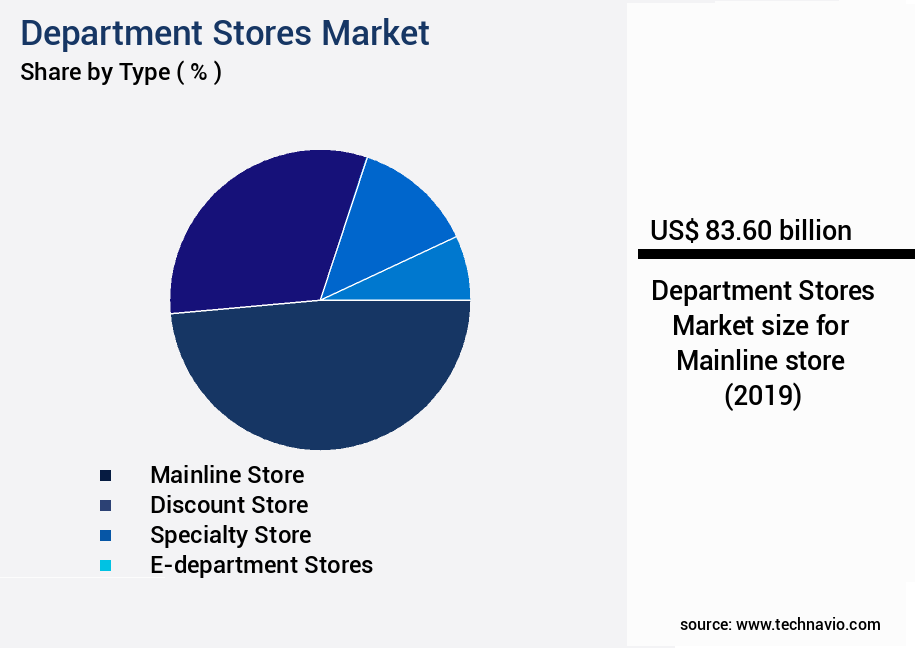
The Mainline store segment was valued at USD 83.60 billion in 2019 and showed a gradual increase during the forecast period.
Regional Analysis
North America is estimated to contribute 44% to the growth of the global market during the forecast period.Technavio's analysts have elaborately explained the regional trends and drivers that shape the market during the forecast period.
See How Department Stores Market Demand is Rising in North America Request Free Sample
The market is undergoing significant transformation, with North America remaining a pivotal region due to its dense urban populations and affluent consumer base. The United States and Canada, in particular, are smart home to major players such as Macy's, Nordstrom, Hudson's Bay, Kohl's, and JCPenney. Urbanization, with 82% of Canada's and 83% of the US populations living in cities in 2023 (World Bank), fuels department store traffic, especially in metropolitan areas. This trend is driven by the blend of iconic retail institutions and evolving digital strategies.
The market's underlying dynamics include operational efficiency gains and cost reductions, with high Gross Domestic Product (GDP) per capita (USD82,769) supporting these initiatives. The market's continuous adaptation to consumer preferences and technological advancements underscores its resilience and growth potential.
Market Dynamics
Our researchers analyzed the data with 2024 as the base year, along with the key drivers, trends, and challenges. A holistic analysis of drivers will help companies refine their marketing strategies to gain a competitive advantage.
The retail sector is undergoing rapid transformation as artificial intelligence, data analytics, and digital technologies reshape supply chains, customer engagement, and operational efficiency. Optimizing retail supply chain using AI and improving supply chain visibility and agility are becoming central to ensuring resilience and responsiveness in an increasingly competitive environment. RFID for inventory tracking and leveraging POS data for sales forecasting help retailers achieve real-time visibility and accuracy across stock management.
Customer-centric strategies such as enhancing customer experience through personalization, analyzing customer journey using data, and improving customer service metrics using feedback analysis are driving deeper engagement and loyalty. Creating efficient omnichannel marketing strategies and integrating e-commerce with physical stores seamlessly ensure a unified brand experience, while increasing conversion rates via e-commerce optimization addresses digital-first consumer behavior.
On the operational side, improving store layout for increased sales, optimizing product assortment for higher margins, and boosting employee productivity via scheduling software contribute to profitability and efficiency. Technology adoption for reducing retail losses through technology and implementing effective loss prevention measures further safeguards margins.
From a marketing perspective, measuring effectiveness of promotional campaigns and using predictive models for demand forecasting enable data-driven decision-making, while using digital signage to enhance store experience blends technology with shopper engagement. Overall, these strategies highlight how AI, advanced analytics, and digital innovation are creating a smarter, more adaptive retail ecosystem—balancing operational efficiency with superior customer experiences.
What are the key market drivers leading to the rise in the adoption of Department Stores Industry?
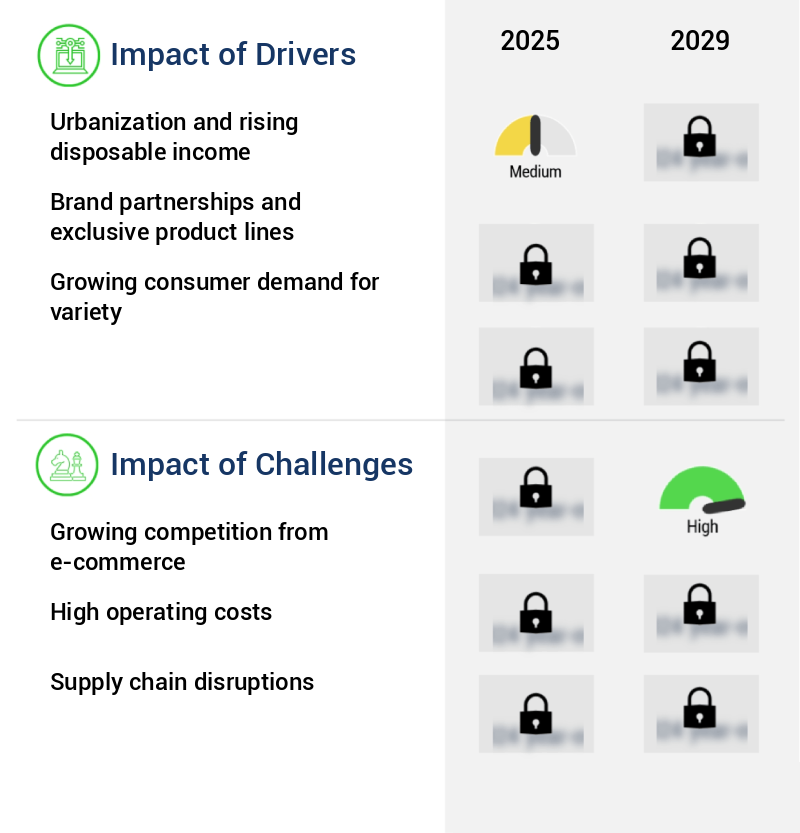
- Urbanization and rising disposable income serve as the primary catalysts for market growth.
- The market is experiencing significant growth, fueled by urbanization and the increasing disposable incomes of consumers. As of 2023, approximately 4.6 billion people reside in urban areas, a figure projected to reach nearly 70% of the global population by 2050. This demographic shift presents a prime opportunity for department stores, as urban environments offer enhanced access to retail infrastructure and lifestyle amenities. Moreover, the evolving consumer behavior in urban areas is driving the market. Consumers in urban centers value convenience, brand engagement, and experiential retail. Department stores are responding to these trends by offering a wide range of products, personalized services, and immersive shopping experiences.
- According to recent studies, the adoption of technology in department stores has led to notable improvements in operational efficiency and decision-making. For instance, the implementation of inventory management systems has reduced downtime by up to 30%, while the use of data analytics tools has improved forecast accuracy by as much as 18%. In conclusion, the market is poised for continued growth, driven by urbanization and the changing consumer behavior it engenders. The integration of technology to enhance operational efficiency and improve decision-making is a key trend shaping the market's trajectory.
What are the market trends shaping the Department Stores Industry?
- Focusing on experiential retailing is becoming a mandatory trend in the market. This approach prioritizes providing customers with immersive and interactive shopping experiences.
- Department stores are evolving to offer more than just transactional commerce, with experiential retailing becoming a key strategy. By integrating immersive environments, interactive features, and personalized services, retailers are transforming shopping into multidimensional experiences. For instance, John Lewis in the United Kingdom has expanded its in-store hospitality offerings, adding five new cafes and restaurants in 2025. These initiatives, such as the Mediterranean-themed Ori Caffe in Liverpool and Solihull, and a new cafe in Southampton, aim to enhance the shopping experience and encourage longer customer visits.
What challenges does the Department Stores Industry face during its growth?
- The expansion of e-commerce platforms poses a significant challenge to the industry's growth, as businesses in this sector increasingly face stiff competition from online retailers.
- The market is undergoing significant transformation due to the increasing dominance of e-commerce. Traditional brick-and-mortar stores face intense competition from online retailers, which offer unrivaled convenience, extensive product selections, competitive pricing, and swift delivery. E-commerce platforms are not encumbered by physical space or geographic limitations, allowing them to cater to a vast and diverse customer base. Major players like Amazon and Alibaba, along with emerging direct-to-consumer brands, have captured the preference of millions of consumers, particularly the younger, tech-savvy demographic.
- The proliferation of mobile commerce and Digital Payment solutions has further fueled this trend. Despite these challenges, department stores continue to adapt by enhancing their omnichannel strategies, optimizing costs, and focusing on customer experience to remain competitive.
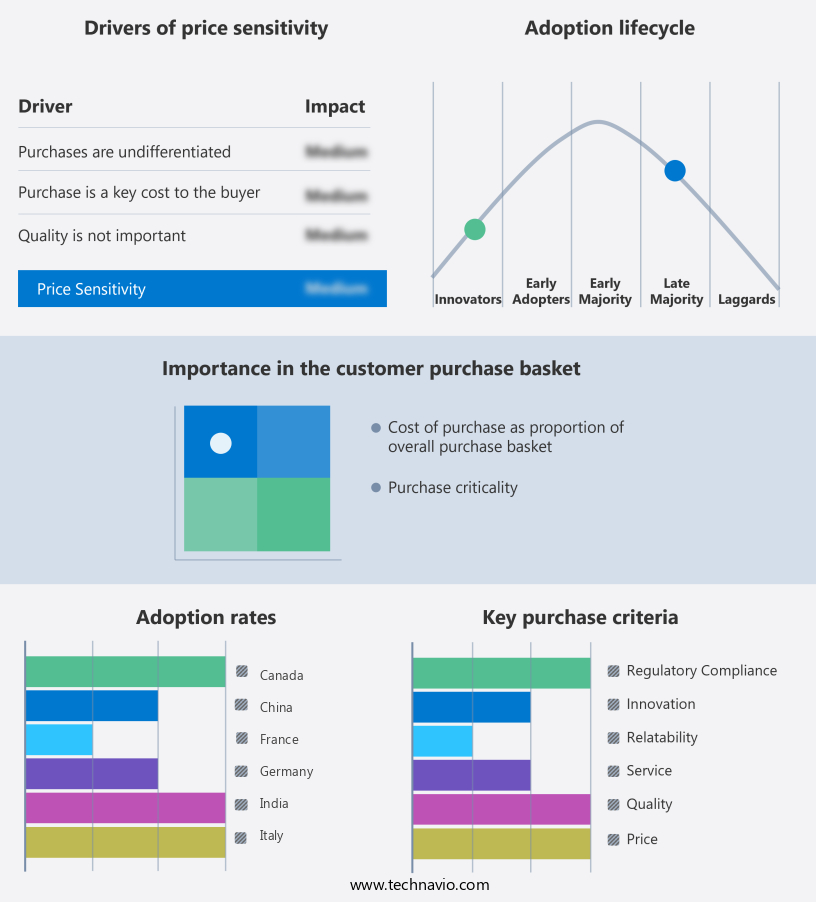
Exclusive Technavio Analysis on Customer Landscape
The department stores market forecasting report includes the adoption lifecycle of the market, covering from the innovator's stage to the laggard's stage. It focuses on adoption rates in different regions based on penetration. Furthermore, the department stores market report also includes key purchase criteria and drivers of price sensitivity to help companies evaluate and develop their market growth analysis strategies.
Customer Landscape of Department Stores Industry
Competitive Landscape
Companies are implementing various strategies, such as strategic alliances, department stores market forecast, partnerships, mergers and acquisitions, geographical expansion, and product/service launches, to enhance their presence in the industry.
AEON CO. LTD. - Department stores from the company provide a vast selection of essentials, encompassing food, apparel, and household items. Aeon Hypermarkets are a prime example, catering to diverse consumer needs. These retail spaces deliver comprehensive shopping experiences.
The industry research and growth report includes detailed analyses of the competitive landscape of the market and information about key companies, including:
- AEON CO. LTD.
- Cencosud
- David Jones Pty Ltd
- Dillards Inc,
- El Corte Ingles SA
- El Puerto de Liverpool
- Galeries Lafayette
- ISETAN MITSUKOSHI
- Kohls Inc
- Le Bon Marche
- Macys Inc.
- Marks and Spencer Group plc
- Myer Holdings Ltg
- Neiman Marcus Group Ltd. LLC
- Nordstrom Inc.
- Penney IP LLC
- Reliance Retail Ltd.
- The KaDeWe Group GmbH
- Transform SR Holding Management LLC
- Wesfarmers Ltd.
Qualitative and quantitative analysis of companies has been conducted to help clients understand the wider business environment as well as the strengths and weaknesses of key industry players. Data is qualitatively analyzed to categorize companies as pure play, category-focused, industry-focused, and diversified; it is quantitatively analyzed to categorize companies as dominant, leading, strong, tentative, and weak.
Recent Development and News in Department Stores Market
- In January 2025, Macy's, a leading department store chain, announced the launch of its new sustainable fashion line, "Eco-Friendly Macy's," in collaboration with several eco-conscious brands. This initiative aimed to cater to the growing consumer demand for sustainable fashion and marked a significant shift in the company's product offerings (Macy's Press Release, 2025).
- In March 2025, Walmart, the world's largest company by revenue, acquired a 77% stake in Indian department store chain, Bharti Retail, for approximately USD16 billion. This strategic move expanded Walmart's presence in the Indian market, providing it with a stronger foothold in the competitive retail landscape (Bloomberg, 2025).
- In April 2025, Nordstrom, a prominent department store retailer, entered into a partnership with Google to implement RFID technology across its stores. This technological advancement enabled real-time inventory management, improved customer experience, and enhanced operational efficiency (Nordstrom Press Release, 2025).
- In May 2025, IKEA, the global furniture retailer, received regulatory approval to open its first department store in New York City. This marked the Swedish company's entry into the US department store market, diversifying its offerings beyond furniture (IKEA Press Release, 2025).
Dive into Technavio's robust research methodology, blending expert interviews, extensive data synthesis, and validated models for unparalleled Department Stores Market insights. See full methodology.
|
Market Scope |
|
|
Report Coverage |
Details |
|
Page number |
207 |
|
Base year |
2024 |
|
Historic period |
2019-2023 |
|
Forecast period |
2025-2029 |
|
Growth momentum & CAGR |
Accelerate at a CAGR of 5.1% |
|
Market growth 2025-2029 |
USD 55.2 billion |
|
Market structure |
Fragmented |
|
YoY growth 2024-2025(%) |
4.9 |
|
Key countries |
US, China, UK, Germany, Canada, France, Japan, India, Italy, and South Korea |
|
Competitive landscape |
Leading Companies, Market Positioning of Companies, Competitive Strategies, and Industry Risks |
Research Analyst Overview
- The department store market continues to evolve, adapting to shifting consumer preferences and technological advancements. Omnichannel retail strategies have become a necessity, with product assortment planning playing a crucial role in delivering a seamless omni-channel customer experience. Mobile payment processing and supply chain optimization streamline operations, enabling retailers to respond swiftly to demand. For instance, a leading department store chain reported a 25% increase in online sales due to the implementation of an e-commerce platform integration and customer journey mapping. Industry growth is expected to reach 3% annually, driven by the adoption of retail analytics dashboards, customer segmentation strategies, and data analytics retail.
- Security systems and store layout optimization ensure a safe and engaging in-store experience, while sales associate training and pricing strategies optimization empower employees to provide personalized recommendations. Retail technology infrastructure, including marketing automation tools, inventory management systems, and digital signage implementation, enhance the overall shopping experience. Moreover, demand planning systems, loss prevention techniques, and customer relationship management help retailers anticipate trends and maintain strong relationships with their clientele. Predictive modeling retail and store operations management optimize processes, while employee scheduling software and sales forecasting models ensure efficient staffing and accurate inventory levels. Fraud detection systems and visual merchandising techniques further bolster retailers' capabilities, enabling them to maintain a competitive edge in the ever-changing department store market.
What are the Key Data Covered in this Department Stores Market Research and Growth Report?
-
What is the expected growth of the Department Stores Market between 2025 and 2029?
-
USD 55.2 billion, at a CAGR of 5.1%
-
-
What segmentation does the market report cover?
-
The report is segmented by Type (Mainline store, Discount store, Specialty store, and E-department stores), Product (Hardline and softline, Apparel and accessories, and FMCG), and Geography (North America, Europe, APAC, Middle East and Africa, and South America)
-
-
Which regions are analyzed in the report?
-
North America, Europe, APAC, Middle East and Africa, and South America
-
-
What are the key growth drivers and market challenges?
-
Urbanization and rising disposable income, Growing competition from e-commerce
-
-
Who are the major players in the Department Stores Market?
-
AEON CO. LTD., Cencosud, David Jones Pty Ltd, Dillards Inc,, El Corte Ingles SA, El Puerto de Liverpool, Galeries Lafayette, ISETAN MITSUKOSHI, Kohls Inc, Le Bon Marche, Macys Inc., Marks and Spencer Group plc, Myer Holdings Ltg, Neiman Marcus Group Ltd. LLC, Nordstrom Inc., Penney IP LLC, Reliance Retail Ltd., The KaDeWe Group GmbH, Transform SR Holding Management LLC, and Wesfarmers Ltd.
-
Market Research Insights
- The market for department stores is a dynamic and ever-evolving industry, characterized by continuous adaptation to consumer preferences and market trends. According to industry reports, department stores' sales accounted for approximately 10% of total retail sales in the United States in 2020. Furthermore, the market is projected to grow at a steady pace, with expectations of a 3% annual increase in sales over the next five years. An example of market dynamics at play can be observed in the increasing popularity of personalized shopping experiences.
- A study revealed that retailers who implemented personalization engines saw a sales lift of up to 15% compared to those without such technology. This trend underscores the importance of data-driven decision making and Predictive Analytics models in driving sales growth in the department store sector.
We can help! Our analysts can customize this department stores market research report to meet your requirements.
 RIA -
RIA - 
