Digital Education Content Market Analysis, Size, and Forecast 2026-2030: North America (US, Canada, and Mexico), APAC (China, India, and Japan), Europe (Germany, UK, and France), South America (Brazil and Argentina), Middle East and Africa (South Africa, Saudi Arabia, and UAE), and Rest of World (ROW)

Digital Education Content Market Analysis, Size, and Forecast 2026-2030:
North America (US, Canada, and Mexico), APAC (China, India, and Japan), Europe (Germany, UK, and France), South America (Brazil and Argentina), Middle East and Africa (South Africa, Saudi Arabia, and UAE), and Rest of World (ROW)

Published: Mar 2026 299 Pages SKU: IRTNTR43141

Market Overview at a Glance

$104.07 B
Market Opportunity
16.1%
CAGR 2025 - 2030
36.1%
North America Growth
$50.60 B
K-12 segment 2024

Digital Education Content Market Size 2026-2030

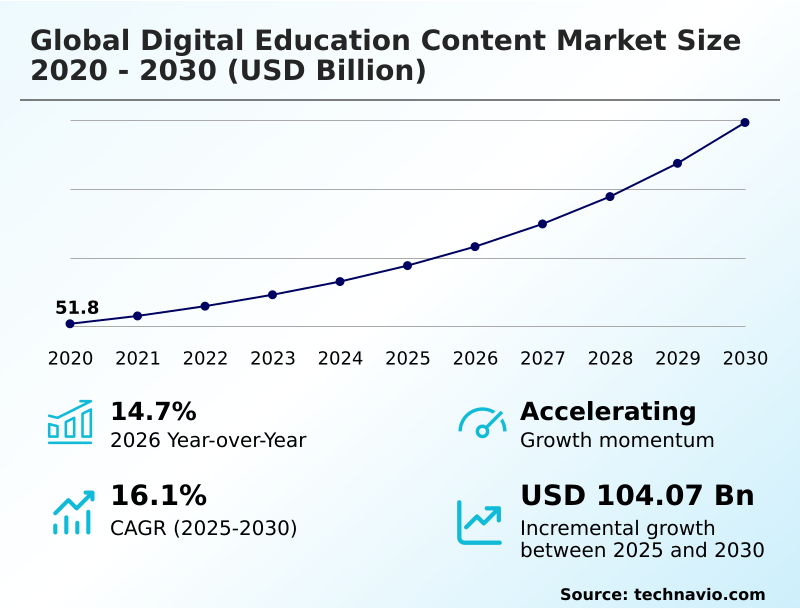
The digital education content market size is valued to increase by USD 104.07 billion, at a CAGR of 16.1% from 2025 to 2030. Integration of AI technologies will drive the digital education content market.

Major Market Trends & Insights

  • North America dominated the market and accounted for a 36.1% growth during the forecast period.
  • By End-user - K-12 segment was valued at USD 50.60 billion in 2024
  • By Delivery Mode - Web-based content segment accounted for the largest market revenue share in 2024

Market Size & Forecast

  • Market Opportunities: USD 146.37 billion
  • Market Future Opportunities: USD 104.07 billion
  • CAGR from 2025 to 2030 : 16.1%

Market Summary

  • The digital education content market is defined by a strategic shift toward dynamic, technology-driven learning ecosystems. Key drivers include the integration of AI technologies, which enable personalized learning pathways and adaptive content delivery, enhancing learner engagement. A prominent trend is the focus on corporate upskilling and reskilling programs, where organizations leverage digital platforms to maintain a competitive workforce.
  • For instance, a multinational corporation might deploy a learning management system with curriculum-aligned materials and virtual laboratories to ensure its engineering team remains current with industry standards, addressing compliance training needs efficiently. However, the market faces challenges related to maintaining learner engagement and retention in self-directed environments.
  • Additionally, ensuring data privacy and the credential credibility of digital certifications remain critical concerns for both learners and employers. Success in this landscape depends on creating secure, engaging, and outcome-oriented digital education solutions that cater to the evolving demands of academic institutions, corporations, and individual learners seeking flexible and effective lifelong learning opportunities.

What will be the Size of the Digital Education Content Market during the forecast period?

Get Key Insights on Market Forecast (PDF) Request Free Sample

How is the Digital Education Content Market Segmented?

The digital education content industry research report provides comprehensive data (region-wise segment analysis), with forecasts and estimates in "USD million" for the period 2026-2030, as well as historical data from 2020-2024 for the following segments.

  • End-user
    • K-12
    • Higher education
  • Delivery mode
    • Web-based content
    • Mobile applications
    • Offline accessible content
  • Content type
    • Video lectures and multimedia
    • Digital textbooks
    • Interactive content
    • Assessments and practice tests
    • Others
  • Geography
    • North America
      • US
      • Canada
      • Mexico
    • APAC
      • China
      • India
      • Japan
    • Europe
      • Germany
      • UK
      • France
    • South America
      • Brazil
      • Argentina
    • Middle East and Africa
      • South Africa
      • Saudi Arabia
      • UAE
    • Rest of World (ROW)

By End-user Insights

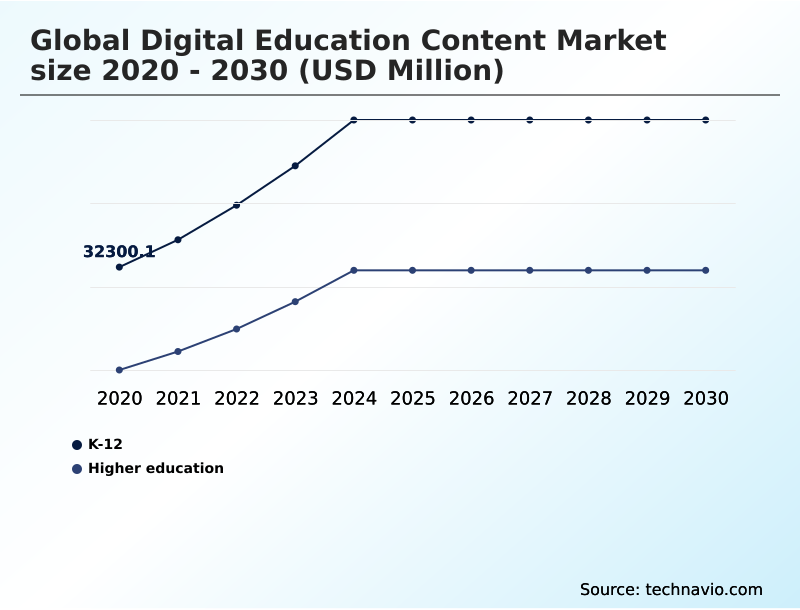
The k-12 segment is estimated to witness significant growth during the forecast period.

The K-12 segment is undergoing a significant transformation, driven by the shift toward interactive content and hybrid learning models.

Educational systems are moving away from static materials to embrace dynamic digital resources, including augmented reality content and gamification elements, which have been shown to increase student engagement by over 15%.

This transition is supported by advanced learning analytics that enable data-driven instruction and personalized student performance tracking. The focus is on providing curriculum-aligned materials that support various learning styles and foster digital skills development.

As institutions adopt these technologies, there is a greater emphasis on improving educational outcomes and facilitating peer-to-peer learning, preparing students for a digitally integrated future and improving learner engagement and retention.

Request Free Sample

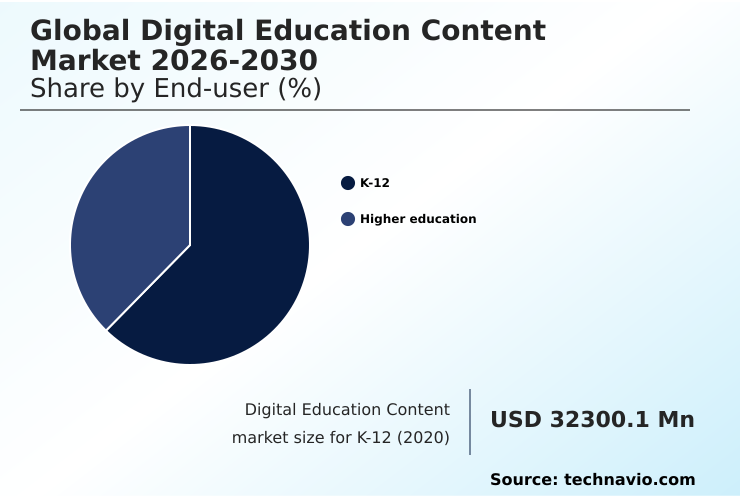
The K-12 segment was valued at USD 50.60 billion in 2024 and showed a gradual increase during the forecast period.

Request Free Sample

Regional Analysis

North America is estimated to contribute 36.1% to the growth of the global market during the forecast period.Technavio’s analysts have elaborately explained the regional trends and drivers that shape the market during the forecast period.

See How Digital Education Content Market Demand is Rising in North America Request Free Sample

The geographic landscape of the market is characterized by varied adoption rates and regional dynamics.

North America, which accounts for over 36% of the market's incremental growth, benefits from advanced infrastructure and high investment in corporate training initiatives that utilize sophisticated learning management systems.

In contrast, APAC is the fastest-growing region, with a CAGR of 16.6%, driven by widespread mobile applications and a focus on digital inclusion. This region's expansion is fueled by government programs promoting open educational resources.

Europe shows steady adoption focused on lifelong learning and compliance training, while emerging markets in South America and the Middle East and Africa are expanding access through offline accessible content and mobile optimization.

These regional differences highlight the importance of localized strategies in curriculum design and learner-centric experiences.

Market Dynamics

Our researchers analyzed the data with 2025 as the base year, along with the key drivers, trends, and challenges. A holistic analysis of drivers will help companies refine their marketing strategies to gain a competitive advantage.

  • The evolution of digital education platforms hinges on the successful integration of advanced technologies to create holistic learning environments. A key consideration is the impact of AI on personalized learning paths, which tailors content to individual user needs, significantly boosting engagement. The benefits of gamification in corporate training are increasingly recognized for enhancing motivation and knowledge retention.
  • This is complemented by trends in mobile learning application design, which prioritize on-the-go access and micro-learning modules. To refine these offerings, platforms are increasingly using learning analytics to improve student engagement, tracking progress to identify areas for improvement. The future of AI-powered student support systems lies in providing real-time, contextual assistance.
  • The challenges of implementing virtual reality in education, such as cost and scalability, are being addressed through more accessible hardware and software. The effectiveness of microlearning for professional development is evident in its ability to deliver just-in-time knowledge. Simultaneously, designing offline accessible content for remote learners ensures educational equity.
  • Integrating interactive content for skill development, especially through augmented reality in science classes, creates immersive experiences. For higher education, social learning platforms are becoming integral. The importance of open educational resources in K-12 is growing, offering cost-effective, quality content.
  • Strategies for effective upskilling and reskilling programs now focus on measurable outcomes, supported by personalizing assessments with adaptive testing technology, which can improve course completion rates by over 20% compared to static tests. The role of digital textbooks in hybrid learning continues to expand, while comparing synchronous vs asynchronous learning outcomes helps optimize instructional design.
  • Behind the scenes, robust security measures for learning management systems and a focus on best practices for creating accessible digital content are paramount. Finally, companies are keen on measuring ROI of corporate digital education to justify investments, and the use of generative AI for course creation is accelerating content development.

What are the key market drivers leading to the rise in the adoption of Digital Education Content Industry?

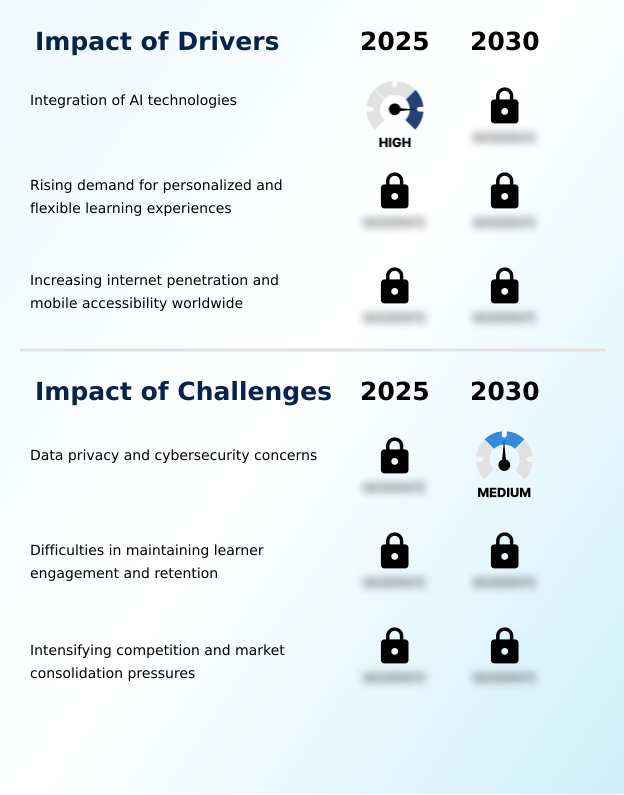
  • The integration of AI technologies is a primary driver for the market, enabling personalized learning and enhancing educational outcomes.

  • The primary driver propelling the market is the integration of AI-powered learning, which facilitates personalized learning and adaptive content delivery. Technologies such as generative AI and natural language processing are being used to create learner-centric experiences and skills-based content.
  • Platforms that provide real-time performance feedback have been shown to improve learner scores by an average of 15%. Moreover, AI-driven personalized learning pathways can accelerate skill acquisition by up to 40%, making continuous skill development more efficient.
  • This technological shift is enabling providers to offer more effective workforce development solutions, automate administrative support, and deliver highly customized, self-directed learning at scale, thereby improving knowledge acquisition.

What are the market trends shaping the Digital Education Content Industry?

  • The adoption of microlearning formats is an emerging trend. This approach delivers content in short, focused modules to improve knowledge retention.

  • Key trends shaping the market include the adoption of microlearning formats and the integration of gamification elements to boost learner engagement. Platforms are increasingly delivering content through mobile applications, which supports on-demand access for corporate training initiatives focused on upskilling and reskilling. These gamified platforms report a 30% higher daily user engagement rate compared to non-gamified counterparts.
  • Furthermore, microlearning modules have demonstrated a 17% better knowledge retention rate, making them highly effective for professional development programs. This shift toward bite-sized, interactive content reflects a broader move to accommodate flexible learning experiences and improve educational outcomes through more engaging and efficient delivery methods, which also enhances peer-to-peer learning.

What challenges does the Digital Education Content Industry face during its growth?

  • Data privacy and cybersecurity concerns represent a significant challenge, impacting user trust and platform adoption.

  • Key market challenges center on maintaining learner engagement and retention and addressing data privacy concerns. Ensuring assessment integrity and the credential credibility of remote examinations is a significant hurdle, as providers must balance accessibility with security. Platforms that incorporate robust community features and peer-to-peer learning opportunities have demonstrated 25% lower student dropout rates.
  • However, the operational cost of complying with stringent data protection regulations has increased overhead by over 10% for many providers. This creates a difficult trade-off between investing in user experience design to combat disengagement and allocating resources to cybersecurity and compliance to build and maintain user trust in their instructional design.

Exclusive Technavio Analysis on Customer Landscape

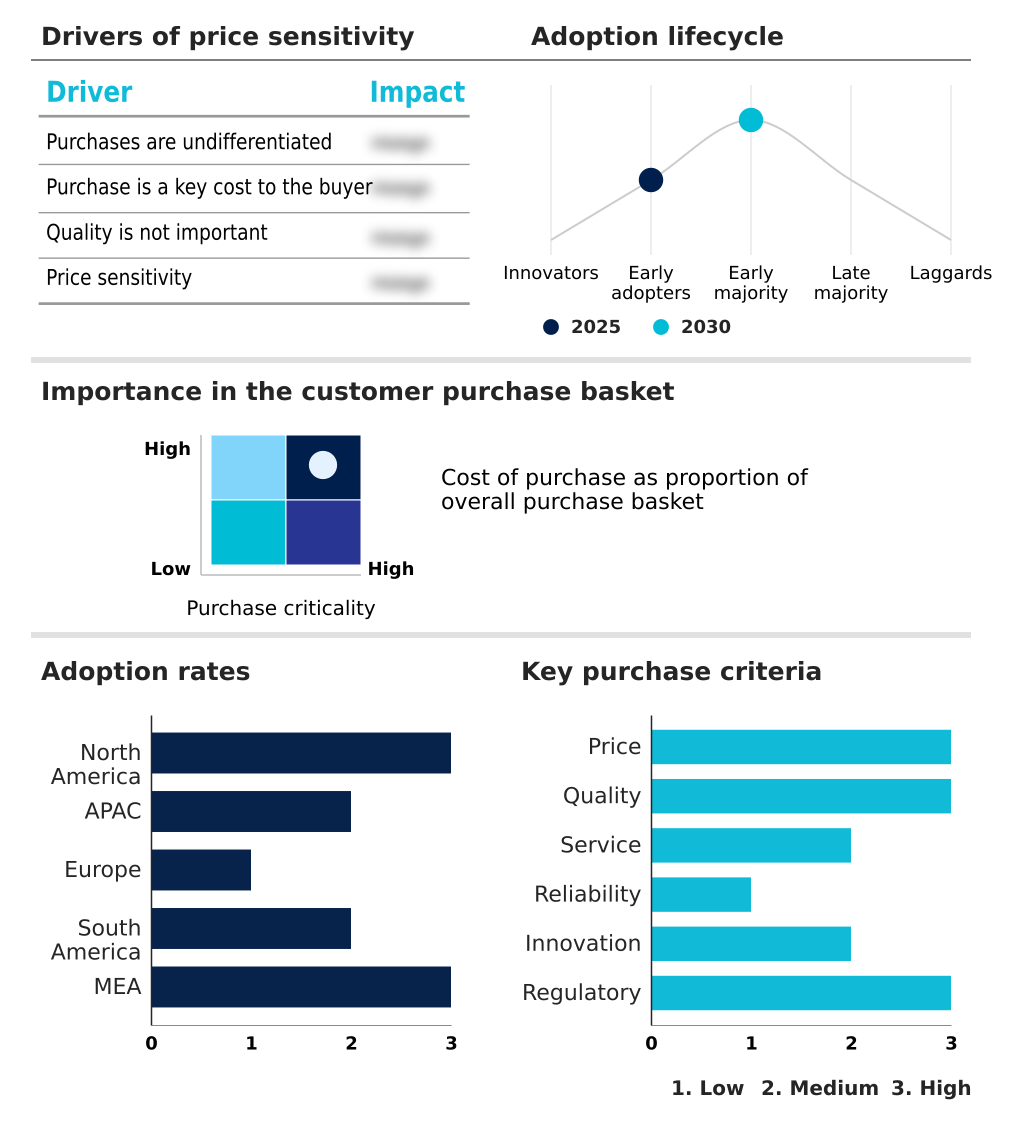
The digital education content market forecasting report includes the adoption lifecycle of the market, covering from the innovator’s stage to the laggard’s stage. It focuses on adoption rates in different regions based on penetration. Furthermore, the digital education content market report also includes key purchase criteria and drivers of price sensitivity to help companies evaluate and develop their market growth analysis strategies.

Customer Landscape of Digital Education Content Industry

Competitive Landscape

Companies are implementing various strategies, such as strategic alliances, digital education content market forecast, partnerships, mergers and acquisitions, geographical expansion, and product/service launches, to enhance their presence in the industry.

2U Inc. - Offers university-partnered online degrees and professional certificates, advancing higher education and workforce development through its comprehensive digital platform.

The industry research and growth report includes detailed analyses of the competitive landscape of the market and information about key companies, including:

  • 2U Inc.
  • Cambridge University Press
  • Cengage Learning Inc.
  • Chegg Inc.
  • City and Guilds Group
  • Coursera Inc.
  • D2L Corp.
  • Duolingo Inc.
  • Guild Education Inc
  • Hurix System Pvt. Ltd.
  • Integra Software Services Ltd.
  • Kaplan Inc.
  • Pearson Plc
  • Pluralsight LLC
  • Skillsoft Corp.
  • Sorting Hat Technologies Ltd.
  • Totara Learning Solutions Ltd.
  • Udacity Inc.
  • Udemy Inc.
  • Vedantu Innovations Pvt. Ltd.

Qualitative and quantitative analysis of companies has been conducted to help clients understand the wider business environment as well as the strengths and weaknesses of key industry players. Data is qualitatively analyzed to categorize companies as pure play, category-focused, industry-focused, and diversified; it is quantitatively analyzed to categorize companies as dominant, leading, strong, tentative, and weak.

Recent Development and News in Digital education content market

  • In September 2024, Coursera introduced eight professional certificates, one degree pathway, and multiple generative AI certifications and specialization courses aligned with current industry skill requirements.
  • In October 2024, Pearson released its Generative AI Foundations Certification, achieving strong monthly growth and appealing to learners across various professional backgrounds.
  • In February 2025, McGraw Hill launched an updated digital platform designed to support early literacy through AI-driven personalized learning pathways for K-12 students.
  • In April 2025, Duolingo expanded its language course offerings by launching 148 new courses, significantly increasing accessibility for speakers of numerous interface languages.

Dive into Technavio’s robust research methodology, blending expert interviews, extensive data synthesis, and validated models for unparalleled Digital Education Content Market insights. See full methodology.

Market Scope
Page number 299
Base year 2025
Historic period 2020-2024
Forecast period 2026-2030
Growth momentum & CAGR Accelerate at a CAGR of 16.1%
Market growth 2026-2030 USD 104070.6 million
Market structure Fragmented
YoY growth 2025-2026(%) 14.7%
Key countries US, Canada, Mexico, China, India, Japan, South Korea, Australia, Indonesia, Germany, UK, France, Italy, Spain, The Netherlands, Brazil, Argentina, Chile, South Africa, Saudi Arabia, UAE, Israel and Turkey
Competitive landscape Leading Companies, Market Positioning of Companies, Competitive Strategies, and Industry Risks

Request Free Sample

Research Analyst Overview

  • The digital education content market is evolving from static digital textbooks to dynamic ecosystems powered by AI-powered learning and real-time performance feedback. The integration of generative AI and machine learning algorithms is central to this shift, enabling the creation of personalized, adaptive content delivery at scale.
  • Boardroom decisions increasingly center on adopting learning management systems with sophisticated learning analytics and skills intelligence integration to measure the return on investment for upskilling and reskilling programs. For example, the use of generative AI for course creation has been shown to reduce content development timelines by up to 50%.
  • Key offerings now include everything from vocational training materials and curriculum-aligned materials to interactive content such as virtual laboratories and augmented reality content. The focus is on providing tangible outcomes through digital credentials with proven assessment integrity and credential credibility, especially for remote examinations.
  • As hybrid learning models become standard, the demand for high-quality, cloud-enabled platforms that support both synchronous learning and asynchronous elements, including offline accessible content and social learning tools, continues to accelerate. Success now depends on offering flexible, data-driven creation tools that support compliance training and continuous professional growth.

What are the Key Data Covered in this Digital Education Content Market Research and Growth Report?

  • What is the expected growth of the Digital Education Content Market between 2026 and 2030?

    • USD 104.07 billion, at a CAGR of 16.1%

  • What segmentation does the market report cover?

    • The report is segmented by End-user (K-12, and Higher education), Delivery Mode (Web-based content, Mobile applications, and Offline accessible content), Content Type (Video lectures and multimedia, Digital textbooks, Interactive content, Assessments and practice tests, and Others) and Geography (North America, APAC, Europe, South America, Middle East and Africa)

  • Which regions are analyzed in the report?

    • North America, APAC, Europe, South America and Middle East and Africa

  • What are the key growth drivers and market challenges?

    • Integration of AI technologies, Data privacy and cybersecurity concerns

  • Who are the major players in the Digital Education Content Market?

    • 2U Inc., Cambridge University Press, Cengage Learning Inc., Chegg Inc., City and Guilds Group, Coursera Inc., D2L Corp., Duolingo Inc., Guild Education Inc, Hurix System Pvt. Ltd., Integra Software Services Ltd., Kaplan Inc., Pearson Plc, Pluralsight LLC, Skillsoft Corp., Sorting Hat Technologies Ltd., Totara Learning Solutions Ltd., Udacity Inc., Udemy Inc. and Vedantu Innovations Pvt. Ltd.

Market Research Insights

  • The digital education content market is shaped by the demand for flexible learning experiences and measurable educational outcomes. Platforms integrating personalized learning pathways report a 25% higher course completion rate compared to static content models.
  • Corporate training initiatives are increasingly adopting on-demand formats and mobile optimization to facilitate continuous skill development, with some organizations reducing employee onboarding time by up to 40%. The emphasis on workforce development is driving investments in professional certificates and online degree programs that align with industry needs.
  • This learner-centric approach, supported by robust course authoring tools and curriculum design, ensures that content delivery is both effective and scalable, meeting the needs of a global audience seeking self-directed learning opportunities.

We can help! Our analysts can customize this digital education content market research report to meet your requirements.

Get in touch

1. Executive Summary

1.1 Market overview

Executive Summary - Chart on Market Overview
Executive Summary - Data Table on Market Overview
Executive Summary - Chart on Global Market Characteristics
Executive Summary - Chart on Market by Geography
Executive Summary - Chart on Market Segmentation by End-user
Executive Summary - Chart on Market Segmentation by Delivery Mode
Executive Summary - Chart on Market Segmentation by Content Type
Executive Summary - Chart on Incremental Growth
Executive Summary - Data Table on Incremental Growth
Executive Summary - Chart on Company Market Positioning

2. Technavio Analysis

2.1 Analysis of price sensitivity, lifecycle, customer purchase basket, adoption rates, and purchase criteria

2.2 Criticality of inputs and Factors of differentiation

Chart on Overview on criticality of inputs and factors of differentiation

2.3 Factors of disruption

Chart on Overview on factors of disruption

2.4 Impact of drivers and challenges

Chart on Impact of drivers and challenges in 2025 and 2030

3. Market Landscape

3.1 Market ecosystem

Chart on Parent Market
Data Table on - Parent Market

3.2 Market characteristics

Chart on Market characteristics analysis

3.3 Value chain analysis

Chart on Value chain analysis

4. Market Sizing

4.1 Market definition

Data Table on Offerings of companies included in the market definition

4.2 Market segment analysis

Market segments

4.3 Market size 2025

4.4 Market outlook: Forecast for 2025-2030

Chart on Global - Market size and forecast 2025-2030 ($ million)
Data Table on Global - Market size and forecast 2025-2030 ($ million)
Chart on Global Market: Year-over-year growth 2025-2030 (%)
Data Table on Global Market: Year-over-year growth 2025-2030 (%)

5. Historic Market Size

5.1 Global Digital Education Content Market 2020 - 2024

Historic Market Size - Data Table on Global Digital Education Content Market 2020 - 2024 ($ million)

5.2 End-user segment analysis 2020 - 2024

Historic Market Size - End-user Segment 2020 - 2024 ($ million)

5.3 Delivery Mode segment analysis 2020 - 2024

Historic Market Size - Delivery Mode Segment 2020 - 2024 ($ million)

5.4 Content Type segment analysis 2020 - 2024

Historic Market Size - Content Type Segment 2020 - 2024 ($ million)

5.5 Geography segment analysis 2020 - 2024

Historic Market Size - Geography Segment 2020 - 2024 ($ million)

5.6 Country segment analysis 2020 - 2024

Historic Market Size - Country Segment 2020 - 2024 ($ million)

6. Qualitative Analysis

6.1 Impact of AI on Global Digital Education Content Market

7. Five Forces Analysis

7.1 Five forces summary

Five forces analysis - Comparison between 2025 and 2030

7.2 Bargaining power of buyers

Bargaining power of buyers - Impact of key factors 2025 and 2030

7.3 Bargaining power of suppliers

Bargaining power of suppliers - Impact of key factors in 2025 and 2030

7.4 Threat of new entrants

Threat of new entrants - Impact of key factors in 2025 and 2030

7.5 Threat of substitutes

Threat of substitutes - Impact of key factors in 2025 and 2030

7.6 Threat of rivalry

Threat of rivalry - Impact of key factors in 2025 and 2030

7.7 Market condition

Chart on Market condition - Five forces 2025 and 2030

8. Market Segmentation by End-user

8.1 Market segments

Chart on End-user - Market share 2025-2030 (%)
Data Table on End-user - Market share 2025-2030 (%)

8.2 Comparison by End-user

Chart on Comparison by End-user
Data Table on Comparison by End-user

8.3 K-12 - Market size and forecast 2025-2030

Chart on K-12 - Market size and forecast 2025-2030 ($ million)
Data Table on K-12 - Market size and forecast 2025-2030 ($ million)
Chart on K-12 - Year-over-year growth 2025-2030 (%)
Data Table on K-12 - Year-over-year growth 2025-2030 (%)

8.4 Higher education - Market size and forecast 2025-2030

Chart on Higher education - Market size and forecast 2025-2030 ($ million)
Data Table on Higher education - Market size and forecast 2025-2030 ($ million)
Chart on Higher education - Year-over-year growth 2025-2030 (%)
Data Table on Higher education - Year-over-year growth 2025-2030 (%)

8.5 Market opportunity by End-user

Market opportunity by End-user ($ million)
Data Table on Market opportunity by End-user ($ million)

9. Market Segmentation by Delivery Mode

9.1 Market segments

Chart on Delivery Mode - Market share 2025-2030 (%)
Data Table on Delivery Mode - Market share 2025-2030 (%)

9.2 Comparison by Delivery Mode

Chart on Comparison by Delivery Mode
Data Table on Comparison by Delivery Mode

9.3 Web-based content - Market size and forecast 2025-2030

Chart on Web-based content - Market size and forecast 2025-2030 ($ million)
Data Table on Web-based content - Market size and forecast 2025-2030 ($ million)
Chart on Web-based content - Year-over-year growth 2025-2030 (%)
Data Table on Web-based content - Year-over-year growth 2025-2030 (%)

9.4 Mobile applications - Market size and forecast 2025-2030

Chart on Mobile applications - Market size and forecast 2025-2030 ($ million)
Data Table on Mobile applications - Market size and forecast 2025-2030 ($ million)
Chart on Mobile applications - Year-over-year growth 2025-2030 (%)
Data Table on Mobile applications - Year-over-year growth 2025-2030 (%)

9.5 Offline accessible content - Market size and forecast 2025-2030

Chart on Offline accessible content - Market size and forecast 2025-2030 ($ million)
Data Table on Offline accessible content - Market size and forecast 2025-2030 ($ million)
Chart on Offline accessible content - Year-over-year growth 2025-2030 (%)
Data Table on Offline accessible content - Year-over-year growth 2025-2030 (%)

9.6 Market opportunity by Delivery Mode

Market opportunity by Delivery Mode ($ million)
Data Table on Market opportunity by Delivery Mode ($ million)

10. Market Segmentation by Content Type

10.1 Market segments

Chart on Content Type - Market share 2025-2030 (%)
Data Table on Content Type - Market share 2025-2030 (%)

10.2 Comparison by Content Type

Chart on Comparison by Content Type
Data Table on Comparison by Content Type

10.3 Video lectures and multimedia - Market size and forecast 2025-2030

Chart on Video lectures and multimedia - Market size and forecast 2025-2030 ($ million)
Data Table on Video lectures and multimedia - Market size and forecast 2025-2030 ($ million)
Chart on Video lectures and multimedia - Year-over-year growth 2025-2030 (%)
Data Table on Video lectures and multimedia - Year-over-year growth 2025-2030 (%)

10.4 Digital textbooks - Market size and forecast 2025-2030

Chart on Digital textbooks - Market size and forecast 2025-2030 ($ million)
Data Table on Digital textbooks - Market size and forecast 2025-2030 ($ million)
Chart on Digital textbooks - Year-over-year growth 2025-2030 (%)
Data Table on Digital textbooks - Year-over-year growth 2025-2030 (%)

10.5 Interactive content - Market size and forecast 2025-2030

Chart on Interactive content - Market size and forecast 2025-2030 ($ million)
Data Table on Interactive content - Market size and forecast 2025-2030 ($ million)
Chart on Interactive content - Year-over-year growth 2025-2030 (%)
Data Table on Interactive content - Year-over-year growth 2025-2030 (%)

10.6 Assessments and practice tests - Market size and forecast 2025-2030

Chart on Assessments and practice tests - Market size and forecast 2025-2030 ($ million)
Data Table on Assessments and practice tests - Market size and forecast 2025-2030 ($ million)
Chart on Assessments and practice tests - Year-over-year growth 2025-2030 (%)
Data Table on Assessments and practice tests - Year-over-year growth 2025-2030 (%)

10.7 Others - Market size and forecast 2025-2030

Chart on Others - Market size and forecast 2025-2030 ($ million)
Data Table on Others - Market size and forecast 2025-2030 ($ million)
Chart on Others - Year-over-year growth 2025-2030 (%)
Data Table on Others - Year-over-year growth 2025-2030 (%)

10.8 Market opportunity by Content Type

Market opportunity by Content Type ($ million)
Data Table on Market opportunity by Content Type ($ million)

11. Customer Landscape

11.1 Customer landscape overview

Analysis of price sensitivity, lifecycle, customer purchase basket, adoption rates, and purchase criteria

12. Geographic Landscape

12.1 Geographic segmentation

Chart on Market share by geography 2025-2030 (%)
Data Table on Market share by geography 2025-2030 (%)

12.2 Geographic comparison

Chart on Geographic comparison
Data Table on Geographic comparison

12.3 North America - Market size and forecast 2025-2030

Chart on North America - Market size and forecast 2025-2030 ($ million)
Data Table on North America - Market size and forecast 2025-2030 ($ million)
Chart on North America - Year-over-year growth 2025-2030 (%)
Data Table on North America - Year-over-year growth 2025-2030 (%)
Chart on Regional Comparison - North America
Data Table on Regional Comparison - North America

12.3.1 US - Market size and forecast 2025-2030

Chart on US - Market size and forecast 2025-2030 ($ million)
Data Table on US - Market size and forecast 2025-2030 ($ million)
Chart on US - Year-over-year growth 2025-2030 (%)
Data Table on US - Year-over-year growth 2025-2030 (%)

12.3.2 Canada - Market size and forecast 2025-2030

Chart on Canada - Market size and forecast 2025-2030 ($ million)
Data Table on Canada - Market size and forecast 2025-2030 ($ million)
Chart on Canada - Year-over-year growth 2025-2030 (%)
Data Table on Canada - Year-over-year growth 2025-2030 (%)

12.3.3 Mexico - Market size and forecast 2025-2030

Chart on Mexico - Market size and forecast 2025-2030 ($ million)
Data Table on Mexico - Market size and forecast 2025-2030 ($ million)
Chart on Mexico - Year-over-year growth 2025-2030 (%)
Data Table on Mexico - Year-over-year growth 2025-2030 (%)

12.4 APAC - Market size and forecast 2025-2030

Chart on APAC - Market size and forecast 2025-2030 ($ million)
Data Table on APAC - Market size and forecast 2025-2030 ($ million)
Chart on APAC - Year-over-year growth 2025-2030 (%)
Data Table on APAC - Year-over-year growth 2025-2030 (%)
Chart on Regional Comparison - APAC
Data Table on Regional Comparison - APAC

12.4.1 China - Market size and forecast 2025-2030

Chart on China - Market size and forecast 2025-2030 ($ million)
Data Table on China - Market size and forecast 2025-2030 ($ million)
Chart on China - Year-over-year growth 2025-2030 (%)
Data Table on China - Year-over-year growth 2025-2030 (%)

12.4.2 India - Market size and forecast 2025-2030

Chart on India - Market size and forecast 2025-2030 ($ million)
Data Table on India - Market size and forecast 2025-2030 ($ million)
Chart on India - Year-over-year growth 2025-2030 (%)
Data Table on India - Year-over-year growth 2025-2030 (%)

12.4.3 Japan - Market size and forecast 2025-2030

Chart on Japan - Market size and forecast 2025-2030 ($ million)
Data Table on Japan - Market size and forecast 2025-2030 ($ million)
Chart on Japan - Year-over-year growth 2025-2030 (%)
Data Table on Japan - Year-over-year growth 2025-2030 (%)

12.4.4 South Korea - Market size and forecast 2025-2030

Chart on South Korea - Market size and forecast 2025-2030 ($ million)
Data Table on South Korea - Market size and forecast 2025-2030 ($ million)
Chart on South Korea - Year-over-year growth 2025-2030 (%)
Data Table on South Korea - Year-over-year growth 2025-2030 (%)

12.4.5 Australia - Market size and forecast 2025-2030

Chart on Australia - Market size and forecast 2025-2030 ($ million)
Data Table on Australia - Market size and forecast 2025-2030 ($ million)
Chart on Australia - Year-over-year growth 2025-2030 (%)
Data Table on Australia - Year-over-year growth 2025-2030 (%)

12.4.6 Indonesia - Market size and forecast 2025-2030

Chart on Indonesia - Market size and forecast 2025-2030 ($ million)
Data Table on Indonesia - Market size and forecast 2025-2030 ($ million)
Chart on Indonesia - Year-over-year growth 2025-2030 (%)
Data Table on Indonesia - Year-over-year growth 2025-2030 (%)

12.5 Europe - Market size and forecast 2025-2030

Chart on Europe - Market size and forecast 2025-2030 ($ million)
Data Table on Europe - Market size and forecast 2025-2030 ($ million)
Chart on Europe - Year-over-year growth 2025-2030 (%)
Data Table on Europe - Year-over-year growth 2025-2030 (%)
Chart on Regional Comparison - Europe
Data Table on Regional Comparison - Europe

12.5.1 Germany - Market size and forecast 2025-2030

Chart on Germany - Market size and forecast 2025-2030 ($ million)
Data Table on Germany - Market size and forecast 2025-2030 ($ million)
Chart on Germany - Year-over-year growth 2025-2030 (%)
Data Table on Germany - Year-over-year growth 2025-2030 (%)

12.5.2 UK - Market size and forecast 2025-2030

Chart on UK - Market size and forecast 2025-2030 ($ million)
Data Table on UK - Market size and forecast 2025-2030 ($ million)
Chart on UK - Year-over-year growth 2025-2030 (%)
Data Table on UK - Year-over-year growth 2025-2030 (%)

12.5.3 France - Market size and forecast 2025-2030

Chart on France - Market size and forecast 2025-2030 ($ million)
Data Table on France - Market size and forecast 2025-2030 ($ million)
Chart on France - Year-over-year growth 2025-2030 (%)
Data Table on France - Year-over-year growth 2025-2030 (%)

12.5.4 Italy - Market size and forecast 2025-2030

Chart on Italy - Market size and forecast 2025-2030 ($ million)
Data Table on Italy - Market size and forecast 2025-2030 ($ million)
Chart on Italy - Year-over-year growth 2025-2030 (%)
Data Table on Italy - Year-over-year growth 2025-2030 (%)

12.5.5 Spain - Market size and forecast 2025-2030

Chart on Spain - Market size and forecast 2025-2030 ($ million)
Data Table on Spain - Market size and forecast 2025-2030 ($ million)
Chart on Spain - Year-over-year growth 2025-2030 (%)
Data Table on Spain - Year-over-year growth 2025-2030 (%)

12.5.6 The Netherlands - Market size and forecast 2025-2030

Chart on The Netherlands - Market size and forecast 2025-2030 ($ million)
Data Table on The Netherlands - Market size and forecast 2025-2030 ($ million)
Chart on The Netherlands - Year-over-year growth 2025-2030 (%)
Data Table on The Netherlands - Year-over-year growth 2025-2030 (%)

12.6 South America - Market size and forecast 2025-2030

Chart on South America - Market size and forecast 2025-2030 ($ million)
Data Table on South America - Market size and forecast 2025-2030 ($ million)
Chart on South America - Year-over-year growth 2025-2030 (%)
Data Table on South America - Year-over-year growth 2025-2030 (%)
Chart on Regional Comparison - South America
Data Table on Regional Comparison - South America

12.6.1 Brazil - Market size and forecast 2025-2030

Chart on Brazil - Market size and forecast 2025-2030 ($ million)
Data Table on Brazil - Market size and forecast 2025-2030 ($ million)
Chart on Brazil - Year-over-year growth 2025-2030 (%)
Data Table on Brazil - Year-over-year growth 2025-2030 (%)

12.6.2 Argentina - Market size and forecast 2025-2030

Chart on Argentina - Market size and forecast 2025-2030 ($ million)
Data Table on Argentina - Market size and forecast 2025-2030 ($ million)
Chart on Argentina - Year-over-year growth 2025-2030 (%)
Data Table on Argentina - Year-over-year growth 2025-2030 (%)

12.6.3 Chile - Market size and forecast 2025-2030

Chart on Chile - Market size and forecast 2025-2030 ($ million)
Data Table on Chile - Market size and forecast 2025-2030 ($ million)
Chart on Chile - Year-over-year growth 2025-2030 (%)
Data Table on Chile - Year-over-year growth 2025-2030 (%)

12.7 Middle East and Africa - Market size and forecast 2025-2030

Chart on Middle East and Africa - Market size and forecast 2025-2030 ($ million)
Data Table on Middle East and Africa - Market size and forecast 2025-2030 ($ million)
Chart on Middle East and Africa - Year-over-year growth 2025-2030 (%)
Data Table on Middle East and Africa - Year-over-year growth 2025-2030 (%)
Chart on Regional Comparison - Middle East and Africa
Data Table on Regional Comparison - Middle East and Africa

12.7.1 South Africa - Market size and forecast 2025-2030

Chart on South Africa - Market size and forecast 2025-2030 ($ million)
Data Table on South Africa - Market size and forecast 2025-2030 ($ million)
Chart on South Africa - Year-over-year growth 2025-2030 (%)
Data Table on South Africa - Year-over-year growth 2025-2030 (%)

12.7.2 Saudi Arabia - Market size and forecast 2025-2030

Chart on Saudi Arabia - Market size and forecast 2025-2030 ($ million)
Data Table on Saudi Arabia - Market size and forecast 2025-2030 ($ million)
Chart on Saudi Arabia - Year-over-year growth 2025-2030 (%)
Data Table on Saudi Arabia - Year-over-year growth 2025-2030 (%)

12.7.3 UAE - Market size and forecast 2025-2030

Chart on UAE - Market size and forecast 2025-2030 ($ million)
Data Table on UAE - Market size and forecast 2025-2030 ($ million)
Chart on UAE - Year-over-year growth 2025-2030 (%)
Data Table on UAE - Year-over-year growth 2025-2030 (%)

12.7.4 Israel - Market size and forecast 2025-2030

Chart on Israel - Market size and forecast 2025-2030 ($ million)
Data Table on Israel - Market size and forecast 2025-2030 ($ million)
Chart on Israel - Year-over-year growth 2025-2030 (%)
Data Table on Israel - Year-over-year growth 2025-2030 (%)

12.7.5 Turkey - Market size and forecast 2025-2030

Chart on Turkey - Market size and forecast 2025-2030 ($ million)
Data Table on Turkey - Market size and forecast 2025-2030 ($ million)
Chart on Turkey - Year-over-year growth 2025-2030 (%)
Data Table on Turkey - Year-over-year growth 2025-2030 (%)

12.8 Market opportunity by geography

Market opportunity by geography ($ million)
Data Tables on Market opportunity by geography ($ million)

13. Drivers, Challenges, and Opportunity

13.1 Market drivers

Integration of AI technologies
Rising demand for personalized and flexible learning experiences
Increasing internet penetration and mobile accessibility worldwide

13.2 Market challenges

Data privacy and cybersecurity concerns
Difficulties in maintaining learner engagement and retention
Intensifying competition and market consolidation pressures

13.3 Impact of drivers and challenges

Impact of drivers and challenges in 2025 and 2030

13.4 Market opportunities

Adoption of microlearning formats
Rise of gamification elements in content delivery
Growth in corporate-focused upskilling and reskilling programs

14. Competitive Landscape

14.1 Overview

14.2

Overview on criticality of inputs and factors of differentiation

14.3 Landscape disruption

Overview on factors of disruption

14.4 Industry risks

Impact of key risks on business

15. Competitive Analysis

15.1 Companies profiled

Companies covered

15.2 Company ranking index

15.3 Market positioning of companies

Matrix on companies position and classification

15.4 2U Inc.

2U Inc. - Overview
2U Inc. - Product / Service
2U Inc. - Key offerings
SWOT

15.5 Cambridge University Press

Cambridge University Press - Overview
Cambridge University Press - Product / Service
Cambridge University Press - Key offerings
SWOT

15.6 Cengage Learning Inc.

Cengage Learning Inc. - Overview
Cengage Learning Inc. - Product / Service
Cengage Learning Inc. - Key offerings
SWOT

15.7 City and Guilds Group

City and Guilds Group - Overview
City and Guilds Group - Product / Service
City and Guilds Group - Key offerings
SWOT

15.8 Coursera Inc.

Coursera Inc. - Overview
Coursera Inc. - Business segments
Coursera Inc. - Key news
Coursera Inc. - Key offerings
Coursera Inc. - Segment focus
SWOT

15.9 D2L Corp.

D2L Corp. - Overview
D2L Corp. - Product / Service
D2L Corp. - Key news
D2L Corp. - Key offerings
SWOT

15.10 Hurix System Pvt. Ltd.

Hurix System Pvt. Ltd. - Overview
Hurix System Pvt. Ltd. - Product / Service
Hurix System Pvt. Ltd. - Key offerings
SWOT

15.11 Integra Software Services Ltd.

Integra Software Services Ltd. - Overview
Integra Software Services Ltd. - Product / Service
Integra Software Services Ltd. - Key offerings
SWOT

15.12 Kaplan Inc.

Kaplan Inc. - Overview
Kaplan Inc. - Product / Service
Kaplan Inc. - Key offerings
SWOT

15.13 Pearson Plc

Pearson Plc - Overview
Pearson Plc - Business segments
Pearson Plc - Key news
Pearson Plc - Key offerings
Pearson Plc - Segment focus
SWOT

15.14 Pluralsight LLC

Pluralsight LLC - Overview
Pluralsight LLC - Product / Service
Pluralsight LLC - Key offerings
SWOT

15.15 Sorting Hat Technologies Ltd.

Sorting Hat Technologies Ltd. - Overview
Sorting Hat Technologies Ltd. - Product / Service
Sorting Hat Technologies Ltd. - Key offerings
SWOT

15.16 Totara Learning Solutions Ltd.

Totara Learning Solutions Ltd. - Overview
Totara Learning Solutions Ltd. - Product / Service
Totara Learning Solutions Ltd. - Key offerings
SWOT

15.17 Udacity Inc.

Udacity Inc. - Overview
Udacity Inc. - Product / Service
Udacity Inc. - Key offerings
SWOT

15.18 Vedantu Innovations Pvt. Ltd.

Vedantu Innovations Pvt. Ltd. - Overview
Vedantu Innovations Pvt. Ltd. - Product / Service
Vedantu Innovations Pvt. Ltd. - Key offerings
SWOT

16. Appendix

16.1 Scope of the report

Market definition
Objectives
Notes and caveats

16.2 Inclusions and exclusions checklist

Inclusions checklist
Exclusions checklist

16.3 Currency conversion rates for US$

16.4 Research methodology

16.5 Data procurement

Information sources

16.6 Data validation

16.7 Validation techniques employed for market sizing

16.8 Data synthesis

16.9 360 degree market analysis

16.10 List of abbreviations

Research Methodology

Technavio presents a detailed picture of the market by way of study, synthesis, and summation of data from multiple sources. The analysts have presented the various facets of the market with a particular focus on identifying the key industry influencers. The data thus presented is comprehensive, reliable, and the result of extensive research, both primary and secondary.

INFORMATION SOURCES

Primary sources

  • Manufacturers and suppliers
  • Channel partners
  • Industry experts
  • Strategic decision makers

Secondary sources

  • Industry journals and periodicals
  • Government data
  • Financial reports of key industry players
  • Historical data
  • Press releases

DATA ANALYSIS

Data Synthesis

  • Collation of data
  • Estimation of key figures
  • Analysis of derived insights

Data Validation

  • Triangulation with data models
  • Reference against proprietary databases
  • Corroboration with industry experts

REPORT WRITING

Qualitative

  • Market drivers
  • Market challenges
  • Market trends
  • Five forces analysis

Quantitative

  • Market size and forecast
  • Market segmentation
  • Geographical insights
  • Competitive landscape

Interested in this report?

Get your sample now to see our research methodology and insights!

Download Now

Frequently Asked Questions

Digital Education Content market growth will increase by USD 104070.6 million during 2026-2030.

The Digital Education Content market is expected to grow at a CAGR of 16.1% during 2026-2030.

Digital Education Content market is segmented by End-user (K-12, Higher education) Delivery mode (Web-based content, Mobile applications, Offline accessible content) Content type (Video lectures and multimedia, Digital textbooks, Interactive content, Assessments and practice tests, Others)

2U Inc., Cambridge University Press, Cengage Learning Inc., Chegg Inc., City and Guilds Group, Coursera Inc., D2L Corp., Duolingo Inc., Guild Education Inc, Hurix System Pvt. Ltd., Integra Software Services Ltd., Kaplan Inc., Pearson Plc, Pluralsight LLC, Skillsoft Corp., Sorting Hat Technologies Ltd., Totara Learning Solutions Ltd., Udacity Inc., Udemy Inc., Vedantu Innovations Pvt. Ltd. are a few of the key vendors in the Digital Education Content market.

North America will register the highest growth rate of 36.1% among the other regions. Therefore, the Digital Education Content market in North America is expected to garner significant business opportunities for the vendors during the forecast period.

US, Canada, Mexico, China, India, Japan, South Korea, Australia, Indonesia, Germany, UK, France, Italy, Spain, The Netherlands, Brazil, Argentina, Chile, South Africa, Saudi Arabia, UAE, Israel, Turkey

  • Integration of AI technologies is the driving factor this market.

The Digital Education Content market vendors should focus on grabbing business opportunities from the End-user segment as it accounted for the largest market share in the base year.
RIA - Research AI Assistant
Ask RIA