Visual Effects (VFX) Market Size 2026-2030
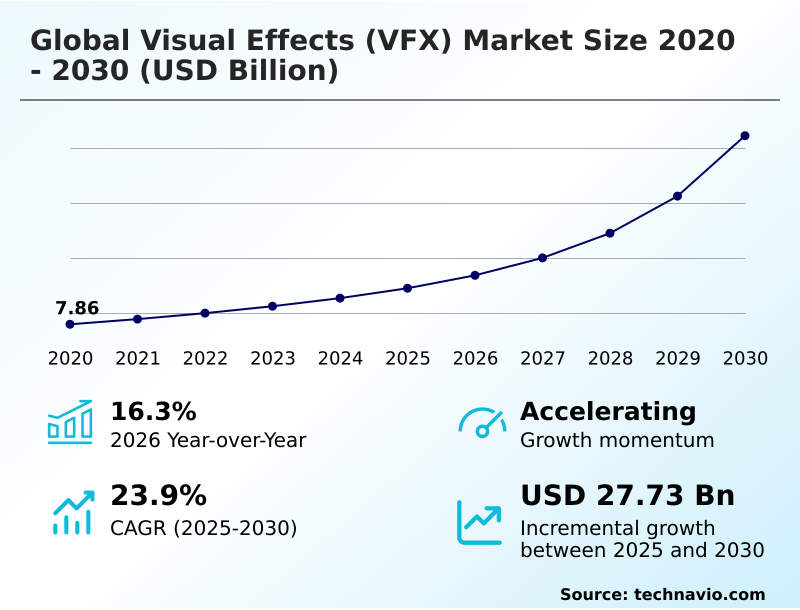
The visual effects (vfx) market size is valued to increase by USD 27.73 billion, at a CAGR of 23.9% from 2025 to 2030. Rising demand for high-fidelity episodic content on global subscription platforms will drive the visual effects (vfx) market.
Major Market Trends & Insights
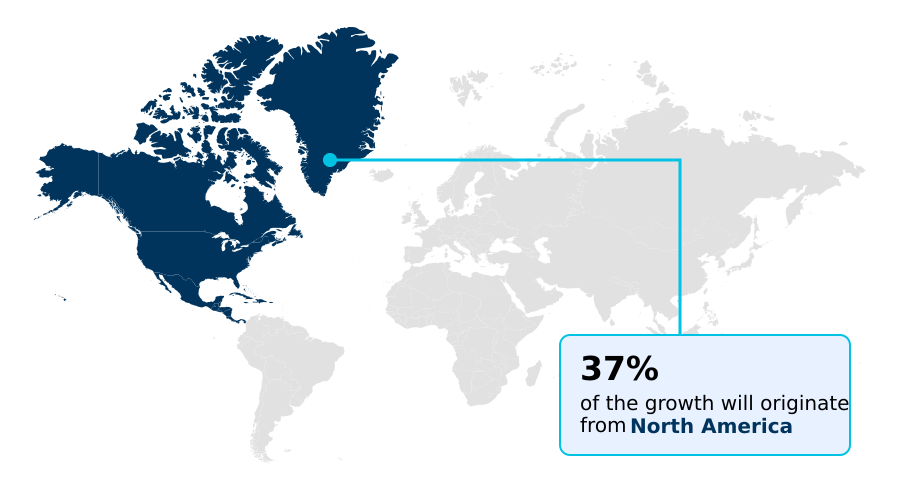
- North America dominated the market and accounted for a 37.1% growth during the forecast period.
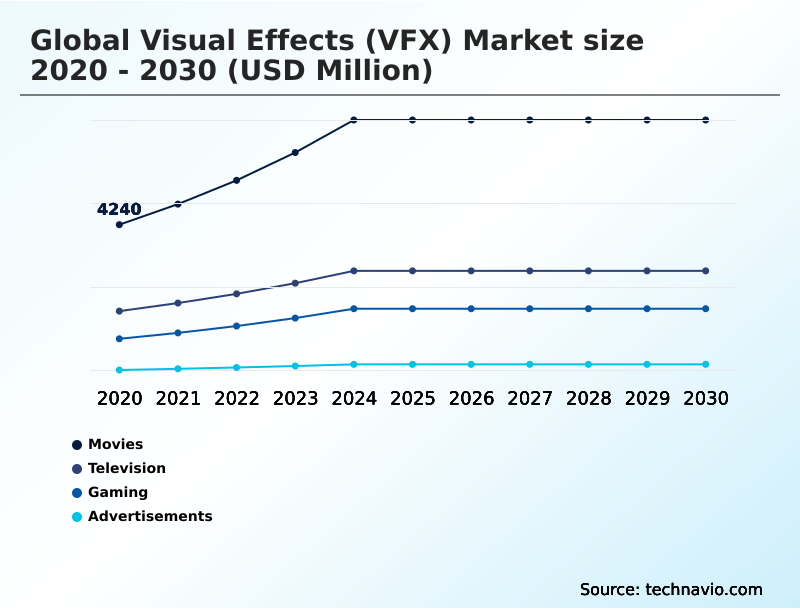
- By Application - Movies segment was valued at USD 7.00 billion in 2024
- By Component - Software segment accounted for the largest market revenue share in 2024
Market Size & Forecast
- Market Opportunities: USD 34.28 billion
- Market Future Opportunities: USD 27.73 billion
- CAGR from 2025 to 2030 : 23.9%
Market Summary
- The visual effects (VFX) market is a cornerstone of modern media, defined by its relentless integration of cutting-edge computational power and the pursuit of photorealism. The lines between production and post-production services are blurring as studios adopt real-time rendering systems and virtual production techniques.
- This paradigm shift, leveraging tools like light emitting diode walls, allows for the in-camera visualization of complex digital environments. The reliance on sophisticated digital assets necessitates decentralized production, making cloud-based collaborative workflows and robust digital asset management standard practice. AI-powered virtual humans and automated environment synthesis are transforming creative processes, enabling artists to focus on high-level concepts.
- For example, a studio producing episodic television content can now leverage a high-speed data synchronization network to manage volumetric data interchange across global teams, ensuring consistency and accelerating delivery timelines.
- This evolution toward open-source asset management frameworks and non-destructive workflows is driven by audience demand for more immersive and visually stunning content, pushing the industry to scale its technical infrastructure, from GPU infrastructure to liquid-cooled server blades, to meet these expectations. This focus on efficiency and creative flexibility underscores the industry's dynamic nature.
What will be the Size of the Visual Effects (VFX) Market during the forecast period?
Get Key Insights on Market Forecast (PDF) Get Free Sample
How is the Visual Effects (VFX) Market Segmented?
The visual effects (vfx) industry research report provides comprehensive data (region-wise segment analysis), with forecasts and estimates in "USD million" for the period 2026-2030, as well as historical data from 2020-2024 for the following segments.
- Application
- Movies
- Television
- Gaming
- Advertisements
- Component
- Software
- Services
- Hardware
- Type
- Simulation
- FX animation
- Compositing
- Modelling
- Matte painting
- Geography
- North America
- US
- Canada
- Mexico
- APAC
- China
- India
- Japan
- Europe
- Germany
- UK
- France
- Middle East and Africa
- Saudi Arabia
- UAE
- South Africa
- South America
- Brazil
- Argentina
- Rest of World (ROW)
- North America
By Application Insights
The movies segment is estimated to witness significant growth during the forecast period.
The movies application segment is a primary driver for innovation in the visual effects market, demanding exceptional digital craftsmanship for feature film productions.
This sector pioneers technologies such as high-fidelity simulations and digital creature design to meet the exacting standards of theatrical releases, pushing the boundaries of cinematic visual fidelity.
Studios are integrating proprietary software development and high-performance computing to manage the demands of new high-resolution formats and high dynamic range (HDR) workflows.
The adoption of systems leveraging machine learning has streamlined the creation of complex biological entities, reducing production cycles by over 15%.
This constant innovation in motion capture systems, advanced medical simulation, and sustainable rendering practices ensures the sector remains a benchmark for technical excellence in digital media processing.
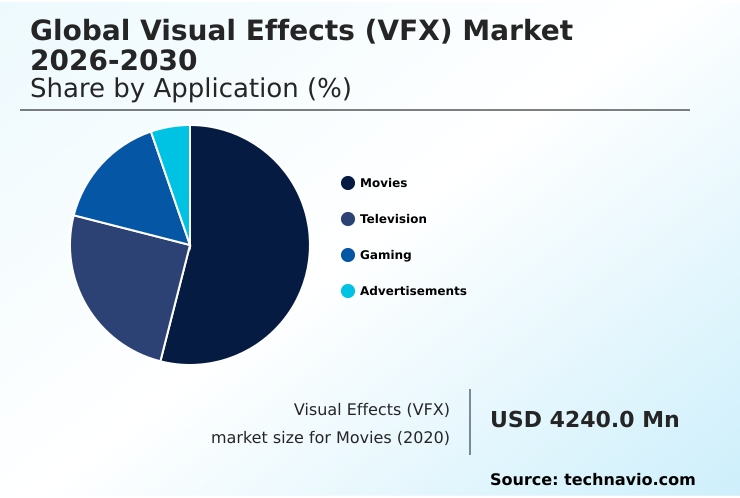
The Movies segment was valued at USD 7.00 billion in 2024 and showed a gradual increase during the forecast period.
Regional Analysis
North America is estimated to contribute 37.1% to the growth of the global market during the forecast period.Technavio’s analysts have elaborately explained the regional trends and drivers that shape the market during the forecast period.
See How Visual Effects (VFX) Market Demand is Rising in North America Get Free Sample
The geographic landscape is dominated by North America, which is projected to contribute over 37% of the market's incremental growth, driven by its concentration of major studios and technology firms. This region pioneers proprietary software development and virtual production techniques.
The APAC region, however, is expanding rapidly, transitioning from an outsourcing hub to a center for innovation in feature animation services and immersive mixed-reality experiences.
European hubs are distinguished by their focus on artistic quality and technical excellence in post-production services. The global distribution of talent is facilitated by cloud-based collaborative workflows, enabling studios to leverage high-performance computing resources from any location.
This interconnectedness allows for a 24-hour production cycle, with projects passing between regions, improving asset delivery times by up to 30%. The use of deep compositing techniques and a digital creature grooming system are becoming standard globally.
Market Dynamics
Our researchers analyzed the data with 2025 as the base year, along with the key drivers, trends, and challenges. A holistic analysis of drivers will help companies refine their marketing strategies to gain a competitive advantage.
- The industry is undergoing a significant transformation, compelling stakeholders to evaluate the benefits of real-time rendering vs traditional pipelines. The integration of generative AI in digital asset creation is automating complex tasks, while cloud collaboration for remote vfx becomes the new standard for global teams.
- The market is expanding beyond entertainment, with visual effects in medical simulation providing new avenues for growth, particularly through digital twin technology in healthcare. Simultaneously, virtual production for episodic television is reshaping on-set workflows. A major industry focus is on sustainable rendering in visual effects, which involves managing the carbon footprint of render farms to align with green initiatives.
- This includes exploring AI automation in rotoscoping tasks to reduce computational load. However, this raises ethical implications of AI in vfx, from job displacement to IP rights. The impact of cloud workflows on vfx is largely positive, enabling the creation of high-fidelity visuals in streaming media and supporting decentralized production models in vfx.
- This is particularly crucial for vfx for high-end television series, which operate on accelerated timelines. Furthermore, the convergence with interactive media is evident, with real-time rendering in game development setting new benchmarks for quality. This creates new hardware requirements for 8k rendering. Adherence to open-source standards in vfx pipelines is critical for interoperability.
- To prepare the future workforce, integrating AI into vfx curriculum is essential. Artists continue to refine cg character animation techniques and leverage high-end compositing software features, alongside procedural generation for digital environments and photogrammetry for realistic asset creation.
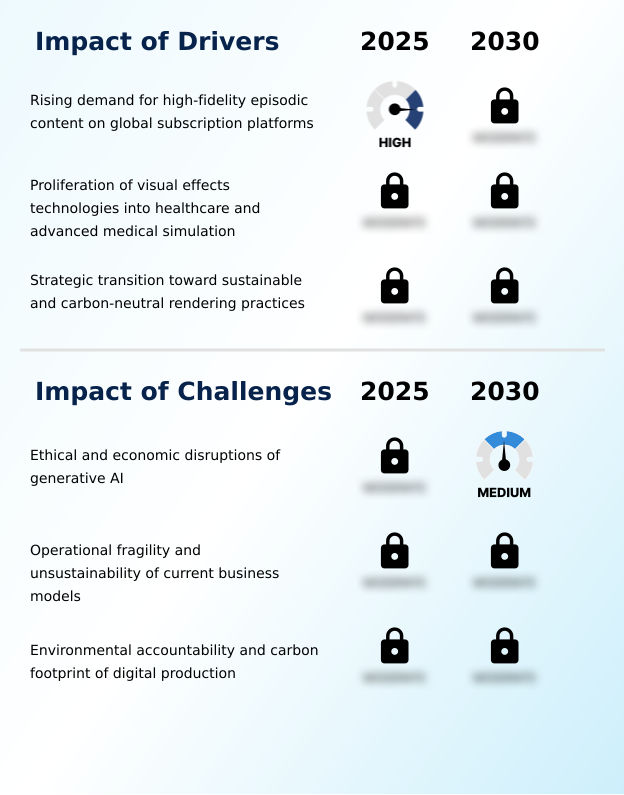
What are the key market drivers leading to the rise in the adoption of Visual Effects (VFX) Industry?
- The rising demand for high-fidelity episodic content on global subscription platforms serves as a key driver for market growth.
- A primary driver is the demand for cinematic visual fidelity in episodic television content, where the volume of digital assets for digital compositing tools has surged by over 40% in recent years.
- This necessitates sophisticated particle effects systems and robust post-production services. A significant new driver is the expansion into non-entertainment sectors, particularly healthcare, where digital twin development and hyper-realistic anatomical simulations are being created for surgical planning.
- This diversification offers a stable client base, with some studios seeing 15% year-over-year growth from these new applications.
- Additionally, the strategic shift toward green production practices, including carbon-neutral rendering and procedural animation, is a competitive advantage for firms offering stereo conversion services.
What are the market trends shaping the Visual Effects (VFX) Industry?
- The evolution of real-time rendering and virtual production systems represents a significant upcoming trend. This shift is reshaping traditional post-production workflows across the industry.
- Key trends are reshaping production, led by the evolution of real-time rendering systems. The adoption of advanced game engines and in-camera visual effects with light emitting diode walls enables dynamic on-set visualization, reducing reshoot necessities by over 20%. Concurrently, automation through generative artificial intelligence is transforming asset creation.
- The use of a neural motion synthesis engine and other machine learning models for digital environment creation facilitates rapid generation of visual elements, with studios reporting a 30% boost in artist productivity.
- Finally, the move toward cloud-based collaborative workflows, supported by a proprietary cloud-based rendering farm and high-speed data synchronization, allows global teams to work on high-resolution master files simultaneously, accelerating project timelines and improving resource allocation through tools like the real-time physics engine update and augmented reality integration.
What challenges does the Visual Effects (VFX) Industry face during its growth?
- The ethical and economic disruptions caused by generative AI present a key challenge affecting industry growth.
- The market confronts significant challenges, led by the ethical and economic disruptions from generative artificial intelligence. While automation via neural rendering algorithms and advanced rendering software streamlines tasks, it threatens to displace junior positions, with projections suggesting a 20% role reduction over five years.
- Another critical challenge is the instability of fixed-bid project models, which offer thin profit margins, often under 5%, and contribute to burnout.
- Environmental accountability is also a major concern, as the energy required for 3d modeling software and high-fidelity simulations continues to rise, pushing studios to invest in more efficient liquid-cooled server blades and adopt a unified multi-physics solver and other sustainable rendering practices.
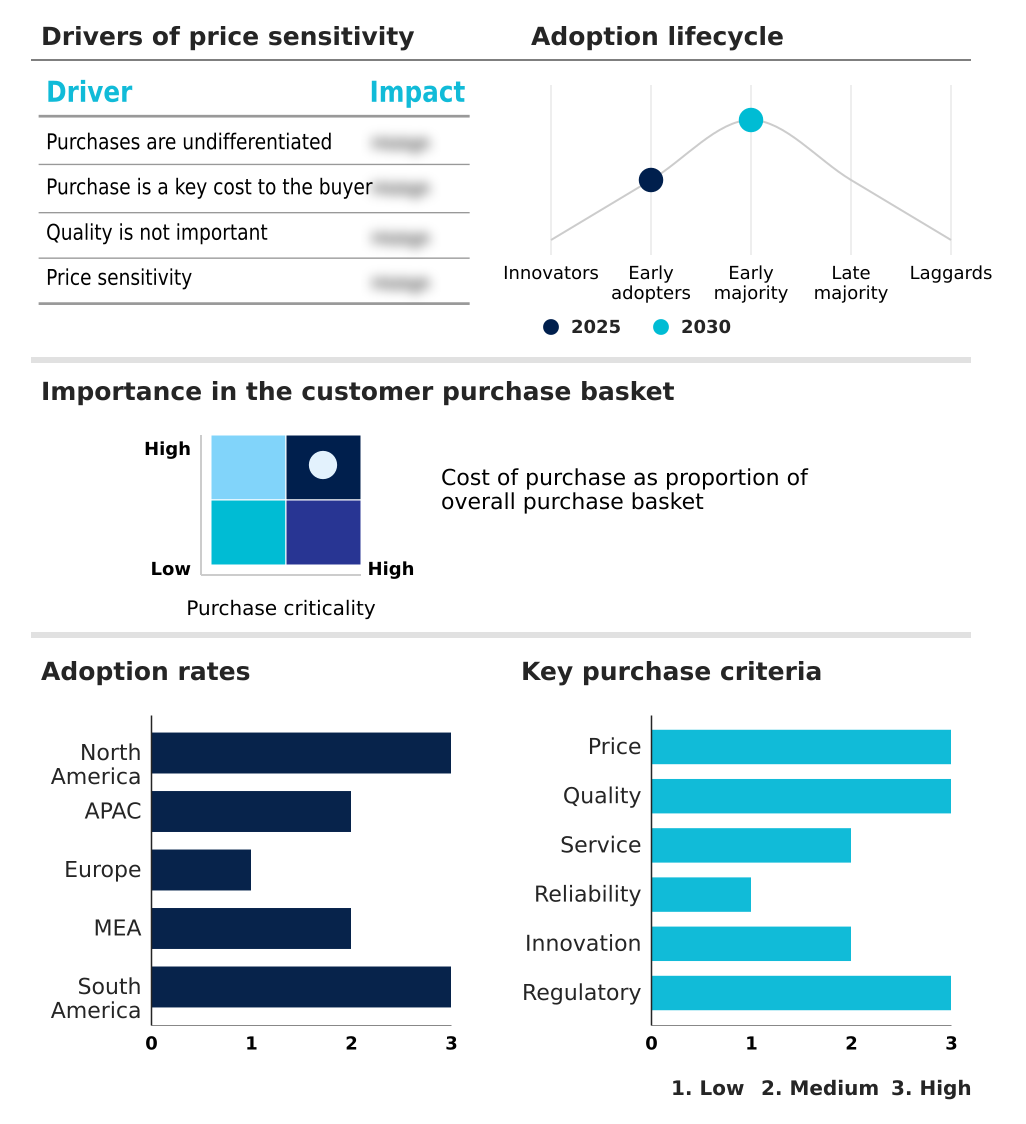
Exclusive Technavio Analysis on Customer Landscape
The visual effects (vfx) market forecasting report includes the adoption lifecycle of the market, covering from the innovator’s stage to the laggard’s stage. It focuses on adoption rates in different regions based on penetration. Furthermore, the visual effects (vfx) market report also includes key purchase criteria and drivers of price sensitivity to help companies evaluate and develop their market growth analysis strategies.
Customer Landscape of Visual Effects (VFX) Industry
Competitive Landscape
Companies are implementing various strategies, such as strategic alliances, visual effects (vfx) market forecast, partnerships, mergers and acquisitions, geographical expansion, and product/service launches, to enhance their presence in the industry.
Animal Logic - A research analyst's view on a company offering advanced visual effects, virtual production, and AI-powered digital humans for diverse media applications.
The industry research and growth report includes detailed analyses of the competitive landscape of the market and information about key companies, including:
- Animal Logic
- BUF
- Cinesite
- Digital Domain Holdings Ltd.
- DNEG
- Eyeline Studios
- Framestore Ltd.
- FuseFX Inc.
- Hydraulx VFX Ltd
- Industrial Light and Magic
- Ingenuity Studios Inc.
- Method Studios Inc.
- Milk VFX
- Moving Picture Company.
- Prime Focus Ltd.
- RISE FX GmbH
- Rodeo FX Inc.
- Sony Pictures Imageworks Inc.
- Vantiva S.A.
- Weta Digital Ltd.
Qualitative and quantitative analysis of companies has been conducted to help clients understand the wider business environment as well as the strengths and weaknesses of key industry players. Data is qualitatively analyzed to categorize companies as pure play, category-focused, industry-focused, and diversified; it is quantitatively analyzed to categorize companies as dominant, leading, strong, tentative, and weak.
Recent Development and News in Visual effects (vfx) market
- In February 2025, Epic Games unveiled the Unreal Engine 6.0 platform, which revolutionized how cinematographers interact with digital environments, allowing studios to execute complex lighting simulations on set.
- In March 2025, NVIDIA Corporation introduced the Omniverse VFX Generative Suite, providing artists with a comprehensive toolset for automated environment synthesis and streamlining creature design processes with neural networks.
- In April 2025, Netflix and Scanline VFX announced a strategic initiative to deploy a proprietary deep-sea simulation engine for a new high-budget maritime drama, investing in custom technological solutions.
- In May 2025, Unity Technologies collaborated with the Mayo Clinic to create photorealistic three-dimensional anatomical models, enabling surgeons to perform virtual practice sessions before operations.
Dive into Technavio’s robust research methodology, blending expert interviews, extensive data synthesis, and validated models for unparalleled Visual Effects (VFX) Market insights. See full methodology.
| Market Scope | |
|---|---|
| Page number | 302 |
| Base year | 2025 |
| Historic period | 2020-2024 |
| Forecast period | 2026-2030 |
| Growth momentum & CAGR | Accelerate at a CAGR of 23.9% |
| Market growth 2026-2030 | USD 27726.2 million |
| Market structure | Fragmented |
| YoY growth 2025-2026(%) | 16.3% |
| Key countries | US, Canada, Mexico, China, India, Japan, South Korea, Australia, Indonesia, Germany, UK, France, Italy, Spain, The Netherlands, Saudi Arabia, UAE, South Africa, Egypt, Qatar, Brazil, Argentina and Chile |
| Competitive landscape | Leading Companies, Market Positioning of Companies, Competitive Strategies, and Industry Risks |
Research Analyst Overview
- The visual effects (VFX) market is undergoing a profound evolution, driven by the convergence of computer-generated imagery (CGI) and cinematic visual fidelity. The widespread adoption of real-time rendering systems and virtual production techniques, often utilizing light emitting diode walls for in-camera visual effects, is reshaping production pipelines.
- Generative artificial intelligence and sophisticated machine learning models are automating digital creature design and digital environment creation, while neural rendering algorithms enhance photorealism. This technological shift is supported by cloud-based collaborative workflows and robust digital asset management. Firms are leveraging proprietary software development and high-performance computing on advanced GPU infrastructure to manage complex high-fidelity simulations and particle effects systems.
- The use of motion capture systems and advanced rendering software is standard. Procedural animation, digital compositing tools, and 3d modeling software are core to creating immersive mixed-reality experiences and AI-powered virtual humans. Studios specializing in feature animation services are also offering post-production services, including stereo conversion services and digital media processing.
- Adherence to standards like universal scene description (usd) for volumetric data interchange and adopting high dynamic range (hdr) workflows has improved cross-studio collaboration, reducing integration errors by over 25%.
What are the Key Data Covered in this Visual Effects (VFX) Market Research and Growth Report?
-
What is the expected growth of the Visual Effects (VFX) Market between 2026 and 2030?
-
USD 27.73 billion, at a CAGR of 23.9%
-
-
What segmentation does the market report cover?
-
The report is segmented by Application (Movies, Television, Gaming, and Advertisements), Component (Software, Services, and Hardware), Type (Simulation, FX animation, Compositing, Modelling, and Matte painting) and Geography (North America, APAC, Europe, Middle East and Africa, South America)
-
-
Which regions are analyzed in the report?
-
North America, APAC, Europe, Middle East and Africa and South America
-
-
What are the key growth drivers and market challenges?
-
Rising demand for high-fidelity episodic content on global subscription platforms, Ethical and economic disruptions of generative AI
-
-
Who are the major players in the Visual Effects (VFX) Market?
-
Animal Logic, BUF, Cinesite, Digital Domain Holdings Ltd., DNEG, Eyeline Studios, Framestore Ltd., FuseFX Inc., Hydraulx VFX Ltd, Industrial Light and Magic, Ingenuity Studios Inc., Method Studios Inc., Milk VFX, Moving Picture Company., Prime Focus Ltd., RISE FX GmbH, Rodeo FX Inc., Sony Pictures Imageworks Inc., Vantiva S.A. and Weta Digital Ltd.
-
Market Research Insights
- Market dynamics are increasingly shaped by the adoption of real-time physics engines and neural rigging systems, which significantly accelerate production timelines. The integration of sustainable rendering practices has become a competitive differentiator, with firms leveraging carbon-neutral rendering achieving up to a 15% reduction in energy costs.
- The application of visual effects technology in advanced medical simulation is opening new revenue streams, where hyper-realistic anatomical simulations are improving surgical planning accuracy by over 20%. Furthermore, the development of proprietary cloud-based rendering farm architecture allows studios to handle the surge in demand for high-fidelity episodic television content, improving global resource allocation by 30%.
- These shifts highlight a move toward efficiency, sustainability, and market diversification.
We can help! Our analysts can customize this visual effects (vfx) market research report to meet your requirements.
 RIA -
RIA - 
