
District Cooling Market Size 2025-2029
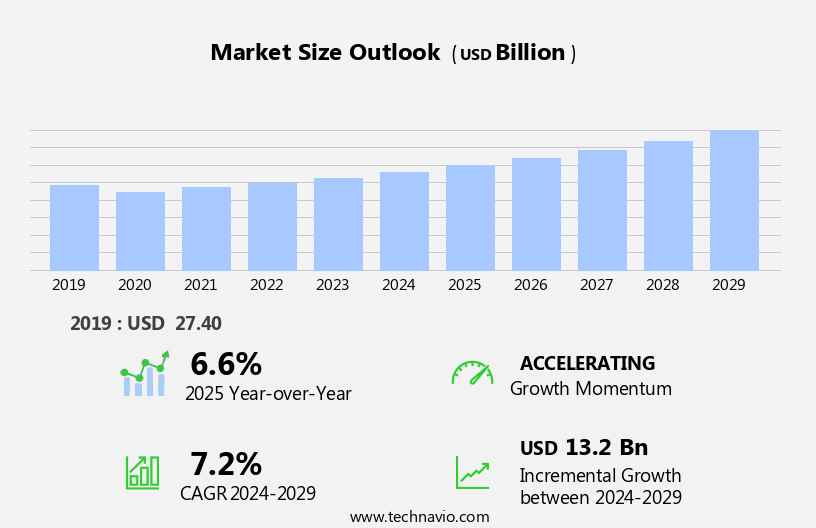
The district cooling market size is forecast to increase by USD 13.2 billion at a CAGR of 7.2% between 2024 and 2029.
- The market is experiencing significant growth, driven by the increasing global population and rapid urbanization, leading to a deluge in demand for energy-efficient cooling solutions. Technological advancements in district cooling systems, including energy recovery and smart grid integration, are enhancing their efficiency and competitiveness against traditional air conditioning systems. However, the high installation cost of district cooling systems remains a significant challenge, limiting their widespread adoption, particularly in developing regions. Regulatory hurdles, such as complex approval processes and stringent safety standards, further impede market growth.
- Moreover, Providers are integrating smart control systems into district cooling networks, utilizing advanced sensors, IoT devices, and data analytics for real-time monitoring and management. To capitalize on the market opportunities, companies must focus on cost reduction strategies, collaborate with governments to streamline regulatory processes, and invest in research and development to improve system efficiency and affordability. Effective supply chain management and partnerships with key stakeholders, including manufacturers, distributors, and installers, are also essential for market success.
What will be the Size of the District Cooling Market during the forecast period?
- The market is experiencing significant growth, driven by increasing energy consumption data and the need for climate change mitigation. Energy efficiency financing, such as performance contracts and green bonds, are facilitating the adoption of advanced HVAC design, including variable speed drives, air-cooled and water-cooled condensers, and cooling towers. Solar thermal and geothermal energy are gaining popularity as renewable energy sources for district cooling systems. Building commissioning and performance analysis ensure thermal comfort and indoor air quality while reducing the heat island effect and carbon footprint.
- Smart metering, energy modeling, and energy management software enable efficient energy usage and demand response. Public-private partnerships and infrastructure investment in cooling infrastructure development are essential for sustainable urban planning and reducing energy tariffs. Waste heat recovery and district heating systems are also crucial components of energy-efficient, smart cities.
How is this District Cooling Industry segmented?
The district cooling industry research report provides comprehensive data (region-wise segment analysis), with forecasts and estimates in "USD billion" for the period 2025-2029, as well as historical data from 2019-2023 for the following segments.
- Product Type
- Electric chillers
- Free cooling
- Absorption cooling
- End-user
- Commercial
- Industrial
- Residential
- Source
- Fossil fuel
- Renewable energy
- Geography
- North America
- US
- Canada
- Mexico
- Europe
- France
- Germany
- Middle East and Africa
- Bahrain
- Qatar
- UAE
- APAC
- Japan
- Rest of World (ROW)
- North America
By Product Type Insights
The electric chillers segment is estimated to witness significant growth during the forecast period.
Electric chillers, a crucial component of district cooling systems, convert electricity into cooling capacity by compressing and expanding refrigerant gases. Their precision and controllability ensure consistent indoor comfort levels in commercial and residential buildings. Operators can adjust cooling capacity based on demand, conditions, and preferences, enhancing operational efficiency and energy management. This control leads to improved performance and cost savings for end-users. Centralized cooling systems, aided by energy audits and building codes, promote carbon emissions reduction and water conservation through heat recovery systems and chilled water systems. Smart building technologies, such as predictive maintenance and performance monitoring, further optimize system performance and regulatory compliance.
Distributed generation, renewable energy integration, and peak load management contribute to energy efficiency and sustainability. Green building standards, like LEED certification and BREEAM certification, prioritize operational efficiency and environmental stewardship. HVAC systems, cooling towers, heat exchangers, and thermal energy storage systems also play essential roles in district cooling infrastructure. Urban development and smart grids, incorporating ice storage and data centers, expand the application scope of district cooling systems.
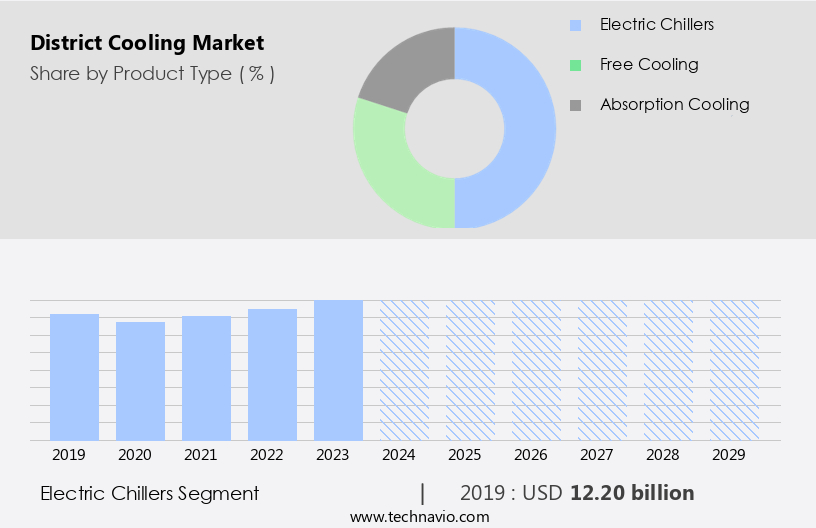
The Electric chillers segment was valued at USD 12.20 billion in 2019 and showed a gradual increase during the forecast period.
Regional Analysis
The Middle East and Africa is estimated to contribute 31% to the growth of the global market during the forecast period. Technavio's analysts have elaborately explained the regional trends and drivers that shape the market during the forecast period.

The market in the Middle East and Africa (MEA) is experiencing growth due to the increasing construction activity in the region. Governments and private investors in countries like Iran, Saudi Arabia, and the UAE are investing in luxury hotels, resorts, parks, and religious monuments to cater to the rising number of tourists. The Middle East construction sector is growing steadily due to ongoing and upcoming mega infrastructure projects. Furthermore, there is a shift in focus from process industries, such as oil and gas, to improving discrete manufacturing capabilities. Centralized cooling systems, including chilled water systems, cooling towers, heat exchangers, and various chiller types like reciprocating, centrifugal, screw, and absorption chillers, are essential components of this market.
Energy efficiency, green building standards, and regulatory compliance are crucial factors driving market growth. Building automation, smart grids, thermal energy storage, and ice storage are some advanced technologies integrated into district cooling systems to optimize energy usage and reduce carbon emissions. Maintenance and repair, fault detection, and performance monitoring are essential aspects of ensuring operational efficiency. Water conservation and peak load management are also significant considerations for the market. Urban development and sustainable development initiatives are further boosting the market. Distributed generation, renewable energy integration, and data centers are emerging trends. The cost-benefit analysis of district cooling systems versus traditional HVAC systems is a critical factor in the market's decision-making process.
The market's return on investment is attractive due to the energy savings and operational efficiency.
Market Dynamics
Our researchers analyzed the data with 2024 as the base year, along with the key drivers, trends, and challenges. A holistic analysis of drivers will help companies refine their marketing strategies to gain a competitive advantage.
What are the District Cooling market drivers leading to the rise in the adoption of Industry?
- The global population growth and rapid urbanization are the primary factors fueling market expansion. The market is experiencing substantial growth due to the global population increase and urbanization, leading to a heightened demand for energy-efficient cooling solutions in densely populated areas. In response, cities are adopting district cooling technologies to provide sustainable and cost-effective alternatives to individual cooling units. For instance, in expanding urban centers like Dubai, large-scale district cooling infrastructure has become essential to meet the cooling requirements of residential and commercial buildings. These district cooling plants utilize centralized chilled water systems, including centrifugal chillers, heat exchangers, and cooling towers, to deliver cooling services to multiple buildings.
- Additionally, the integration of renewable energy sources, distributed generation, and smart building technologies, such as peak load management and green building standards, further enhances the energy efficiency of district cooling systems. Overall, the market growth is driven by the need for sustainable cooling solutions and the potential for significant energy savings.
What are the District Cooling market trends shaping the Industry?
- District cooling systems are experiencing significant technological advancements, making them the current market trend in this sector. These innovations aim to enhance energy efficiency, reduce operational costs, and improve overall system performance. The market is experiencing significant technological advancements, transforming the infrastructure landscape. This proactive approach optimizes energy usage, identifies potential issues, and enhances system performance, contributing to operational efficiency and cost savings.
- Additionally, green building practices, such as LEED and BREEAM certifications, are increasingly driving demand for district cooling systems due to their energy optimization capabilities. Regulatory compliance and the integration of refrigeration systems, thermal energy storage, and screw chillers in district cooling plants further bolster market growth. These advancements are revolutionizing the district cooling industry, making it a key player in the global shift towards sustainable energy solutions.
How does District Cooling market faces challenges face during its growth?
- The significant expense associated with installing district cooling systems poses a substantial challenge to the industry's growth trajectory. District cooling systems, a key component of urban infrastructure, have gained significant traction due to their ability to efficiently manage cooling loads in large buildings and contribute to sustainable development. However, the high return on investment required for their implementation remains a significant barrier to market growth. The high initial costs are primarily driven by the extensive installation of cooling infrastructure, including pipelines, absorption chillers, and performance monitoring systems. These costs can range from USD0.05 to USD0.15 per ton-hour of cooling capacity, translating to an annual expense of USD5,000 to USD15,000 for a typical office building. Environmental regulations and the push for energy efficiency are driving the adoption of district cooling systems, which offer several advantages over traditional cooling methods.
- These advantages include improved energy efficiency, reduced greenhouse gas emissions, and the ability to integrate energy storage technologies and smart grids for enhanced performance. Building automation and ice storage are also becoming increasingly popular, enabling better management of cooling capacity and demand. Despite the challenges, the potential benefits of district cooling systems make them an attractive option for businesses seeking to reduce their carbon footprint and optimize their energy usage.
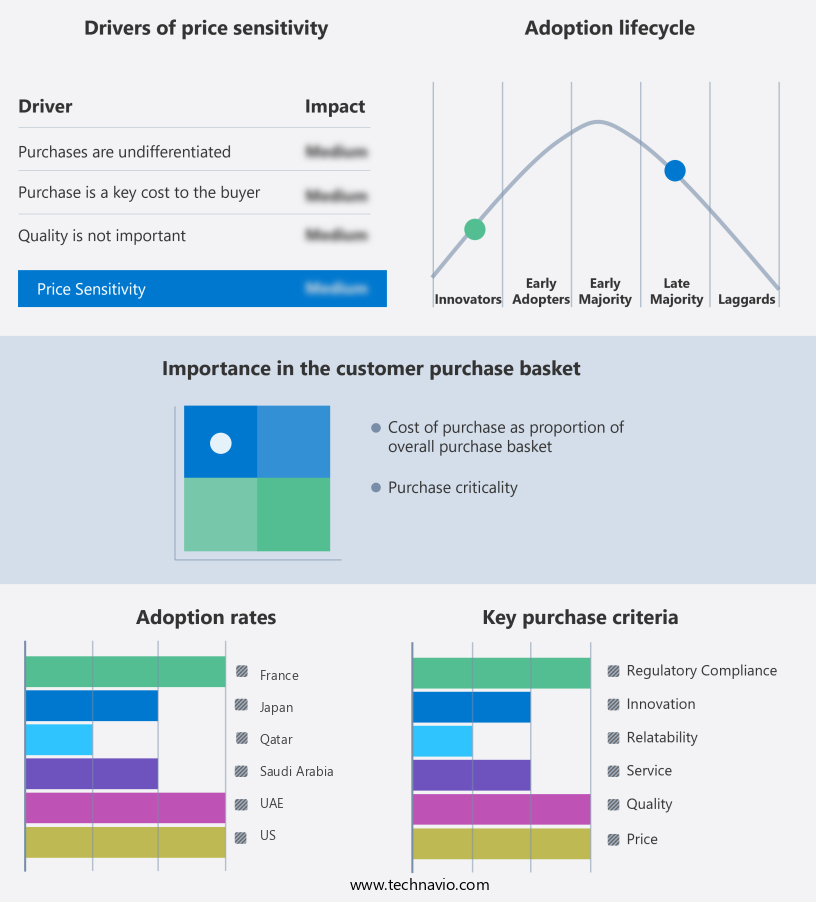
Exclusive Customer Landscape
The district cooling market forecasting report includes the adoption lifecycle of the market, covering from the innovator's stage to the laggard's stage. It focuses on adoption rates in different regions based on penetration. Furthermore, the district cooling market report also includes key purchase criteria and drivers of price sensitivity to help companies evaluate and develop their market growth analysis strategies.
Customer Landscape
Key Companies & Market Insights
Companies are implementing various strategies, such as strategic alliances, district cooling market forecast, partnerships, mergers and acquisitions, geographical expansion, and product/service launches, to enhance their presence in the industry.
AtkinsRealis Group Inc.- The company offers district cooling services which includes engineering, procurement, and construction services for the Parks district cooling plant with ultimate capacity of 60000 TR.
The industry research and growth report includes detailed analyses of the competitive landscape of the market and information about key companies, including:
- ADC Energy Systems
- Alfa Laval AB
- Danfoss AS
- DESMI AS
- Electricite de France SA
- Emicool
- Emirates Central Cooling Systems Corp. PJSC
- ENGIE SA
- Fortum Oyj
- Johnson Controls International Plc
- Keppel Ltd.
- LOGSTOR Denmark Holding ApS
- National Central Cooling Co. PJSC
- Ramboll Group AS
- Shinryo Corp.
- Siemens AG
- SP Group
- Trane Technologies plc
- Veolia Environnement SA
Qualitative and quantitative analysis of companies has been conducted to help clients understand the wider business environment as well as the strengths and weaknesses of key industry players. Data is qualitatively analyzed to categorize companies as pure play, category-focused, industry-focused, and diversified; it is quantitatively analyzed to categorize companies as dominant, leading, strong, tentative, and weak.
Recent Development and News in District Cooling Market
- In February 2024, Saudi Arabian Oil Company (SABIC) and Danish firm, District Cooling Copenhagen A/S, announced a strategic partnership to develop and expand district cooling projects in Saudi Arabia. This collaboration marks a significant stride in the Middle East's the market, as SABIC aims to reduce carbon emissions and enhance energy efficiency (SABIC Press Release, 2024).
- In May 2025, Enel X, the advanced energy services business line of Italian energy company Enel, launched its district cooling business in the United States. This expansion represents a key geographic entry for Enel X, positioning them to serve a growing demand for energy-efficient cooling solutions in the US market (Enel X Press Release, 2025).
- In August 2024, Dubai Electricity and Water Authority (DEWA) announced the completion of the world's largest district cooling plant, with a capacity of 1.4 GW. This significant technological advancement underscores DEWA's commitment to reducing carbon emissions and enhancing energy efficiency in the district cooling sector (DEWA Press Release, 2024).
- In December 2025, Emirates District Cooling (Emicool), a subsidiary of Dubai Investments, secured a major contract from Expo 2020 Dubai to provide district cooling services for the event. This strategic win highlights Emicool's market leadership and its ability to cater to large-scale cooling requirements (Emicool Press Release, 2025).
Research Analyst Overview
The market continues to evolve, driven by the increasing demand for energy-efficient and sustainable cooling solutions across various sectors. Centralized cooling systems, such as piping networks, have gained significant traction in both residential and commercial buildings due to their cost-benefit analysis and ability to reduce carbon emissions and conserve water. The integration of heat recovery systems and absorption chillers in these systems further enhances their efficiency and sustainability. Performance monitoring and maintenance and repair have become essential components of district cooling infrastructure, ensuring regulatory compliance and operational efficiency. Smart building technologies, including remote monitoring and predictive maintenance, have emerged as key trends, enabling real-time fault detection and optimization of cooling demand.
Energy efficiency and green building standards, such as LEED and BREEAM certifications, are driving the adoption of district cooling systems. Renewable energy integration, peak load management, and distributed generation are also gaining momentum, enhancing the sustainability and resilience of these systems. Urban development and building automation are key applications of district cooling, providing cooling capacity to large-scale projects and optimizing energy usage. Cooling infrastructure continues to evolve, with advancements in chilled water systems, cooling towers, heat exchangers, and thermal energy storage. Energy optimization and operational efficiency remain top priorities, with a focus on cooling demand management and performance monitoring.
The integration of smart grids and energy storage technologies, such as ice storage, is enabling more efficient and cost-effective cooling solutions. The market is characterized by continuous innovation and evolving patterns, with a focus on sustainability, energy efficiency, and regulatory compliance. Absorption chillers, centrifugal chillers, reciprocating chillers, and screw chillers are among the technologies shaping the market, offering various advantages in terms of cost, efficiency, and environmental impact. The market is a dynamic and ever-evolving landscape, driven by the need for sustainable, energy-efficient, and cost-effective cooling solutions. The integration of various technologies and practices, from cooling infrastructure and building automation to renewable energy and green building standards, is shaping the future of district cooling and its applications across various sectors.
Dive into Technavio's strong research methodology, blending expert interviews, extensive data synthesis, and validated models for unparalleled District Cooling Market insights. See full methodology.
|
Market Scope |
|
|
Report Coverage |
Details |
|
Page number |
223 |
|
Base year |
2024 |
|
Historic period |
2019-2023 |
|
Forecast period |
2025-2029 |
|
Growth momentum & CAGR |
Accelerate at a CAGR of 7.2% |
|
Market growth 2025-2029 |
USD 13.2 billion |
|
Market structure |
Fragmented |
|
YoY growth 2024-2025(%) |
6.6 |
|
Key countries |
US, UAE, Saudi Arabia, Qatar, France, Canada, Germany, Bahrain, Japan, and Mexico |
|
Competitive landscape |
Leading Companies, Market Positioning of Companies, Competitive Strategies, and Industry Risks |
What are the Key Data Covered in this District Cooling Market Research and Growth Report?
- CAGR of the District Cooling industry during the forecast period
- Detailed information on factors that will drive the growth and forecasting between 2025 and 2029
- Precise estimation of the size of the market and its contribution of the industry in focus to the parent market
- Accurate predictions about upcoming growth and trends and changes in consumer behaviour
- Growth of the market across Middle East and Africa, North America, Europe, APAC, and South America
- Thorough analysis of the market's competitive landscape and detailed information about companies
- Comprehensive analysis of factors that will challenge the district cooling market growth and forecasting
We can help! Our analysts can customize this district cooling market research report to meet your requirements.
 RIA -
RIA - 
