US Do-it-yourself (DIY) Home Improvement Market Size 2026-2030
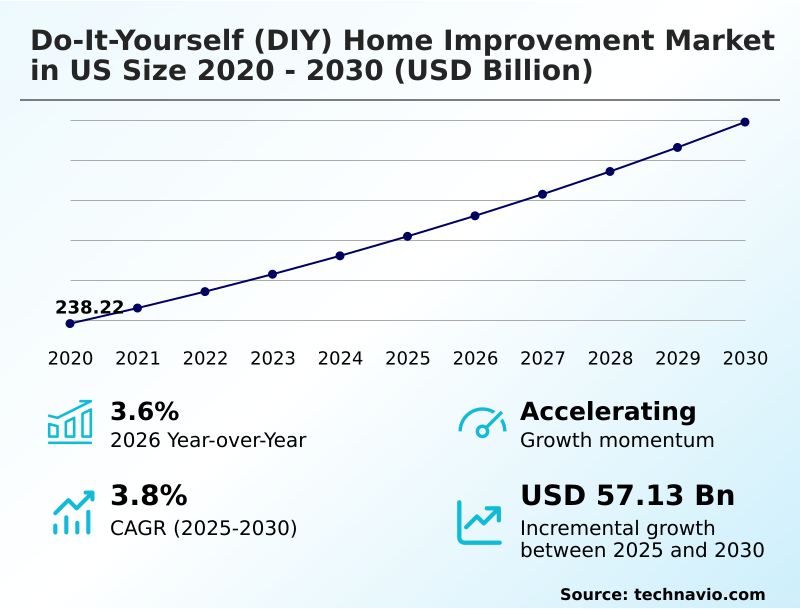
The us do-it-yourself (diy) home improvement market size is valued to increase by USD 57.13 billion, at a CAGR of 3.8% from 2025 to 2030. Rising focus on DIY home improvement for personalized interior design will drive the us do-it-yourself (diy) home improvement market.
Major Market Trends & Insights
- By Product - Lumber and landscape management segment was valued at USD 66.25 billion in 2024
- By Distribution Channel - Offline segment accounted for the largest market revenue share in 2024
Market Size & Forecast
- Market Opportunities: USD 100.75 billion
- Market Future Opportunities: USD 57.13 billion
- CAGR from 2025 to 2030 : 3.8%
Market Summary
- The do-it-yourself (DIY) home improvement market in US is undergoing a significant transformation, driven by evolving consumer behaviors and technological integration. Homeowners are increasingly motivated by a desire for personalized living spaces, viewing their homes as extensions of their identity.
- This trend fuels demand for accessible products like modular flooring systems and user-friendly paint solutions, which empower individuals to undertake projects previously reserved for professionals. The rising influence of social media and online tutorials provides inspiration and guidance, making complex tasks feel more manageable.
- For example, a homeowner can now access a virtual room designer tool to visualize a kitchen remodel before purchasing materials, optimizing their budget and reducing waste. However, the market faces a structural shift as consumers opt for professional services for more complex or time-intensive jobs, particularly those involving electrical or plumbing work.
- This dynamic requires companies to balance their offerings, providing both simple, accessible DIY solutions and robust support for professional contractors. The integration of sustainable building materials and energy-efficient technologies further shapes the landscape, reflecting a broader consumer consciousness toward environmental impact and long-term value.
What will be the Size of the US Do-it-yourself (DIY) Home Improvement Market during the forecast period?
Get Key Insights on Market Forecast (PDF) Get Free Sample
How is the US Do-it-yourself (DIY) Home Improvement Market Segmented?
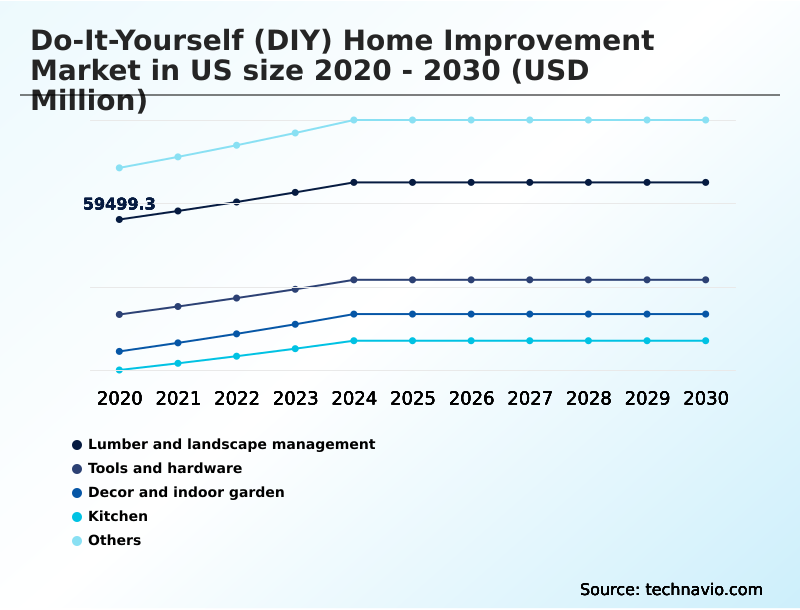
The us do-it-yourself (diy) home improvement industry research report provides comprehensive data (region-wise segment analysis), with forecasts and estimates in "USD million" for the period 2026-2030, as well as historical data from 2020-2024 for the following segments.
- Product
- Lumber and landscape management
- Tools and hardware
- Decor and indoor garden
- Kitchen
- Others
- Distribution channel
- Offline
- Online
- Application
- Residential
- Commercial
- Geography
- North America
- US
- North America
By Product Insights
The lumber and landscape management segment is estimated to witness significant growth during the forecast period.
The lumber and landscape management segment is integral to the Do-it-yourself (DIY) Home Improvement Market in the US, driven by consumer investment in creating functional outdoor living space designs.
Demand is strong for products that adhere to pressure-treated lumber standards for structural integrity and for advanced composite decking materials that offer enhanced exterior paint durability.
Innovations in sustainable building materials, such as permeable paving solutions that help manage water runoff, are gaining traction. The adoption of smart technologies like automated garden irrigation systems and LED landscape lighting reflects a focus on energy efficiency upgrades.
For instance, integrated systems have demonstrated a 20% reduction in water usage. The market also emphasizes ease of maintenance, with products like weatherproofing tape and a seasonal maintenance checklist supporting landscaping for beginners and deck maintenance tips.
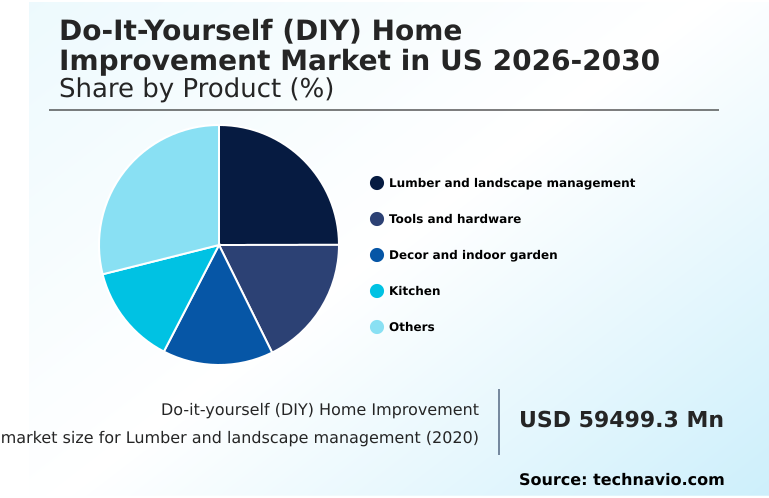
The Lumber and landscape management segment was valued at USD 66.25 billion in 2024 and showed a gradual increase during the forecast period.
Market Dynamics
Our researchers analyzed the data with 2025 as the base year, along with the key drivers, trends, and challenges. A holistic analysis of drivers will help companies refine their marketing strategies to gain a competitive advantage.
- The modern consumer journey in the do-it-yourself space is increasingly research-driven, with specific, long-tail queries guiding purchasing decisions. Homeowners often begin by searching for the best cordless drill for home use or the best tools for beginner woodworkers before committing to a project.
- For interior renovations, popular inquiries include how to install laminate flooring and understanding the diy kitchen cabinet painting cost. Budget-conscious consumers explore small bathroom remodel budget ideas and options for patching drywall holes effectively. Material selection is critical, with searches for eco-friendly interior paint options and low-maintenance composite decking reviews reflecting a desire for both sustainability and durability.
- Smart home integration is another key area, with users seeking guidance on the best smart lighting system for living room setups and energy-efficient window replacement guides. For structural and outdoor projects, queries range from how to build a raised garden bed and outdoor patio paver installation to more complex tasks like soundproofing a home office room.
- Foundational knowledge is sought through guides on how to replace a faucet and exterior house painting preparation. Effective planning tools such as diy built-in bookshelf plans and garage organization and storage systems have become essential, with data showing that consumers who use detailed plans complete projects 15% faster than those who do not.
What are the key market drivers leading to the rise in the adoption of US Do-it-yourself (DIY) Home Improvement Industry?
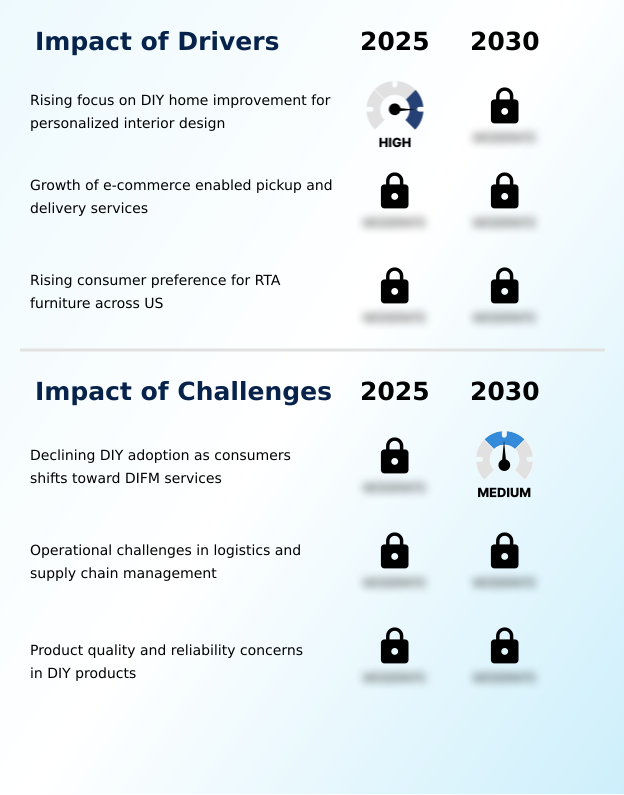
- The rising focus on do-it-yourself (DIY) home improvement for personalized interior design is a key driver for market growth.
- The market is propelled by a strong consumer desire for personalization and cost-effective home upgrades, facilitated by a new generation of user-friendly products.
- The availability of modular flooring systems and peel-and-stick backsplash options has significantly lowered the barrier to entry for kitchen and bathroom renovation guides.
- These products allow homeowners to achieve professional-looking results with minimal expertise, leading to a 15% increase in project completion rates without professional help.
- A surge in upcycled furniture projects, often inspired by how-to video tutorials on social media, drives demand for water-based wood stain and tools for pocket-hole joinery.
- This trend, combined with accessible home improvement financing, empowers consumers to undertake ambitious tasks like kitchen cabinet refacing and building custom storage solutions.
What are the market trends shaping the US Do-it-yourself (DIY) Home Improvement Industry?
- The increasing adoption of augmented reality (AR) in home improvement projects is an emerging trend. It transforms how consumers visualize and execute renovations by enabling immersive, risk-reduced decision-making.
- Technological advancements are reshaping the do-it-yourself market, with a significant trend toward digitalization and sustainability. Consumers are increasingly using a virtual room designer tool and other DIY project planning apps to visualize outcomes, reducing project errors by up to 25%.
- The proliferation of smart home integration kits and devices with smart thermostat compatibility allows for sophisticated home automation and energy efficiency upgrades. In product development, a shift towards low-VOC paint formulation and fire-resistant building material aligns with modern interior design trends and safety standards.
- This focus on user empowerment is further supported by the growing accessibility of online hardware stores and streamlined smart home device setup, making complex projects like home security system installation more attainable for the average consumer.
What challenges does the US Do-it-yourself (DIY) Home Improvement Industry face during its growth?
- Declining do-it-yourself (DIY) adoption, as consumers shift toward do-it-for-me (DIFM) services, presents a key challenge to industry growth.
- A primary challenge facing the DIY market is the increasing complexity of home systems, which prompts a shift toward professional services for certain tasks and inflates project costs by an average of 40%.
- Projects involving electrical wiring conduit, circuit breaker panel upgrades, and radon mitigation systems are often outsourced due to safety concerns and regulatory requirements, driving growth in contractor referral networks. Even seemingly straightforward tasks such as a basement finishing project or applying self-leveling concrete can present unforeseen difficulties.
- This trend is compounded by supply chain disruptions that impact the availability of specialized items like high r-value insulation material, leading to project delays. Consequently, consumers are becoming more reliant on professional guidance for tasks like plumbing repair basics and understanding roof repair guides, underscoring the need for enhanced product support and clear instructions.
Exclusive Technavio Analysis on Customer Landscape
The us do-it-yourself (diy) home improvement market forecasting report includes the adoption lifecycle of the market, covering from the innovator’s stage to the laggard’s stage. It focuses on adoption rates in different regions based on penetration. Furthermore, the us do-it-yourself (diy) home improvement market report also includes key purchase criteria and drivers of price sensitivity to help companies evaluate and develop their market growth analysis strategies.

Customer Landscape of US Do-it-yourself (DIY) Home Improvement Industry
Competitive Landscape
Companies are implementing various strategies, such as strategic alliances, us do-it-yourself (diy) home improvement market forecast, partnerships, mergers and acquisitions, geographical expansion, and product/service launches, to enhance their presence in the industry.
3M Co. - Analysis indicates a focus on DIY solutions encompassing abrasives, adhesives, tapes, and surface finishing products for household repair and renovation.
The industry research and growth report includes detailed analyses of the competitive landscape of the market and information about key companies, including:
- 3M Co.
- Allegion Public Ltd. Co.
- Benjamin Moore and Co.
- Robert Bosch GmbH
- Fortune Brands Innovations Inc.
- Klein Tools Inc.
- Kohler Co
- Kreg Tool Co.
- Masco Corp.
- Mohawk Industries Inc.
- Owens Corning
- Pella Corp.
- Positec Tool Corp.
- PPG Industries Inc.
- RPM International Inc.
- The Sherwin Williams Co.
- Stanley Black and Decker Inc.
- The Toro Co.
- Trex Co. Inc.
- Techtronic Industries Co. Ltd.
Qualitative and quantitative analysis of companies has been conducted to help clients understand the wider business environment as well as the strengths and weaknesses of key industry players. Data is qualitatively analyzed to categorize companies as pure play, category-focused, industry-focused, and diversified; it is quantitatively analyzed to categorize companies as dominant, leading, strong, tentative, and weak.
Recent Development and News in Us do-it-yourself (diy) home improvement market
- In September 2024, Harbor Freight Tools announced the opening of its fifteen hundredth store, emphasizing its commitment to expanding its physical footprint in underserved markets.
- In November 2024, Hunter Industries released a new smart valve system that integrates with local weather stations to prevent overwatering, targeting efficiency-focused homeowners.
- In January 2025, Behr Process Corporation announced a new collection of interior finishes that prioritize ease of application for the average homeowner.
- In March 2025, The Home Depot company expanded its mobile application capabilities with enhanced augmented reality features, permitting users to utilize image search and virtual placement tools.
Dive into Technavio’s robust research methodology, blending expert interviews, extensive data synthesis, and validated models for unparalleled US Do-it-yourself (DIY) Home Improvement Market insights. See full methodology.
| Market Scope | |
|---|---|
| Page number | 191 |
| Base year | 2025 |
| Historic period | 2020-2024 |
| Forecast period | 2026-2030 |
| Growth momentum & CAGR | Accelerate at a CAGR of 3.8% |
| Market growth 2026-2030 | USD 57134.1 million |
| Market structure | Fragmented |
| YoY growth 2025-2026(%) | 3.6% |
| Key countries | US |
| Competitive landscape | Leading Companies, Market Positioning of Companies, Competitive Strategies, and Industry Risks |
Research Analyst Overview
- The Do-it-yourself (DIY) Home Improvement Market in US is defined by continuous innovation in both materials and user-centric solutions. Boardroom strategies now prioritize product lines that simplify complex tasks, such as kitchen cabinet refacing using advanced abrasive finishing products or installing modular flooring systems with integrated laminate flooring underlayment.
- The emphasis is on power tool ergonomics and cordless tool battery platform compatibility, which has improved user adoption for residential projects by over 25%. Key product categories seeing significant development include low-VOC paint formulation, water-based wood stain, and durable composite decking materials that meet stringent pressure-treated lumber standards.
- Innovations extend to essential systems, with easier-to-install options for pvc pipe fitting, electrical wiring conduit, and even radon mitigation systems. Specialized compounds like self-leveling concrete, drywall repair compound, and epoxy garage floor coating are becoming more accessible. For exterior applications, advancements in roofing shingle technology, vinyl siding installation, and permeable paving solutions are noteworthy.
- The integration of fire-resistant building material and soundproofing insulation panels addresses growing consumer demand for safety and comfort, shaping both product development and marketing priorities.
What are the Key Data Covered in this US Do-it-yourself (DIY) Home Improvement Market Research and Growth Report?
-
What is the expected growth of the US Do-it-yourself (DIY) Home Improvement Market between 2026 and 2030?
-
USD 57.13 billion, at a CAGR of 3.8%
-
-
What segmentation does the market report cover?
-
The report is segmented by Product (Lumber and landscape management, Tools and hardware, Decor and indoor garden, Kitchen, and Others), Distribution Channel (Offline, and Online), Application (Residential, and Commercial) and Geography (North America)
-
-
Which regions are analyzed in the report?
-
North America
-
-
What are the key growth drivers and market challenges?
-
Rising focus on DIY home improvement for personalized interior design, Declining DIY adoption as consumers shifts toward DIFM services
-
-
Who are the major players in the US Do-it-yourself (DIY) Home Improvement Market?
-
3M Co., Allegion Public Ltd. Co., Benjamin Moore and Co., Robert Bosch GmbH, Fortune Brands Innovations Inc., Klein Tools Inc., Kohler Co, Kreg Tool Co., Masco Corp., Mohawk Industries Inc., Owens Corning, Pella Corp., Positec Tool Corp., PPG Industries Inc., RPM International Inc., The Sherwin Williams Co., Stanley Black and Decker Inc., The Toro Co., Trex Co. Inc. and Techtronic Industries Co. Ltd.
-
Market Research Insights
- The Do-it-yourself (DIY) Home Improvement Market is characterized by dynamic shifts as consumers leverage digital tools and accessible products for home personalization. The use of DIY project planning apps and online hardware store platforms has streamlined project execution, with users reporting a 15% reduction in planning time.
- A key driver is the pursuit of energy efficiency upgrades, where the installation of smart home devices has been shown to lower utility costs by up to 20%. While how-to video tutorials empower consumers for many tasks, complex projects increasingly push them toward a contractor referral network.
- This bifurcation shapes the market, creating opportunities for vendors who can cater to both empowered DIY enthusiasts and those seeking professional validation for tasks like plumbing repair basics or electrical work safety.
We can help! Our analysts can customize this us do-it-yourself (diy) home improvement market research report to meet your requirements.
 RIA -
RIA - 
