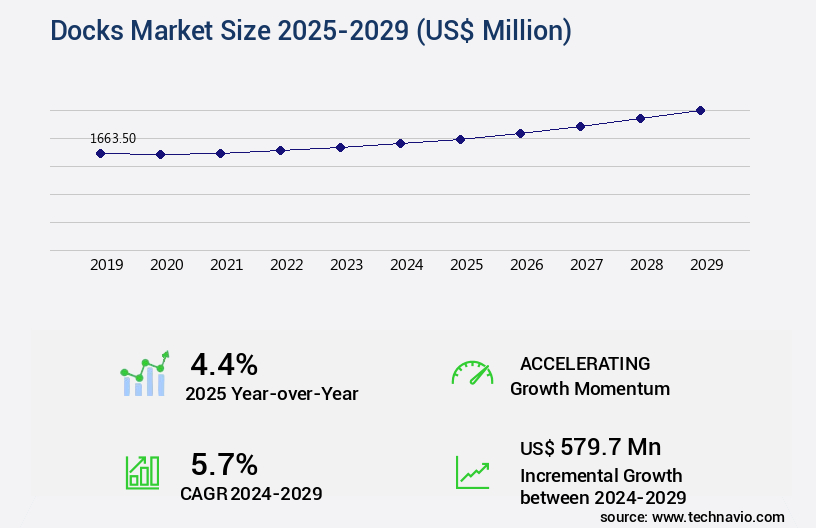
Docks Market Size 2025-2029
The docks market size is valued to increase USD 579.7 million, at a CAGR of 5.7% from 2024 to 2029. Growing demand for recreational boating activities will drive the docks market.
Major Market Trends & Insights
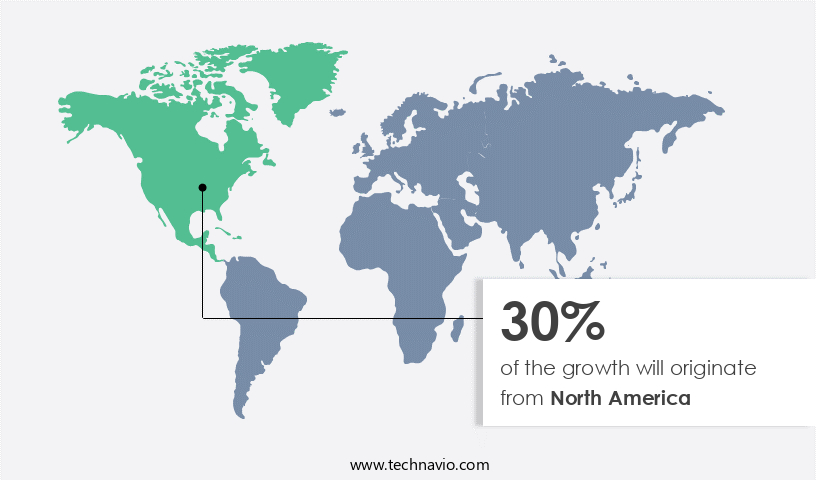
- North America dominated the market and accounted for a 30% growth during the forecast period.
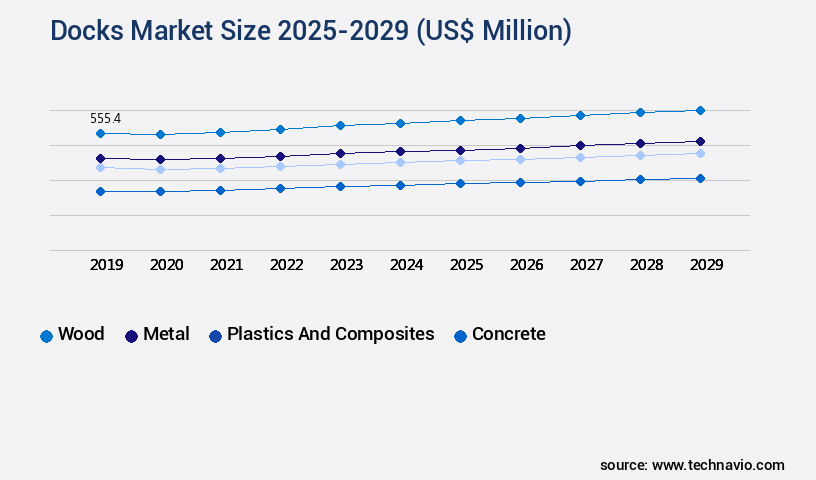
- By Material - Wood segment was valued at USD 555.40 million in 2023
- By End-user - Commercial segment accounted for the largest market revenue share in 2023
Market Size & Forecast
- Market Opportunities: USD 44.79 million
- Market Future Opportunities: USD 579.70 million
- CAGR from 2024 to 2029 : 5.7%
Market Summary
- The market experiences continuous expansion due to the escalating demand for waterfront infrastructure that caters to various industries, including commercial shipping, fishing, and recreational boating. One significant trend driving market growth is the retrofitting of existing docks to accommodate larger vessels and advanced technologies. However, the market's trajectory is not without challenges. Fluctuating raw material prices, primarily steel and concrete, pose a significant threat to profitability.
- According to industry data, the market was valued at approximately USD 125 billion in 2020. With ongoing advancements in materials science and engineering, the market is expected to maintain its growth momentum, offering substantial opportunities for businesses involved in dock construction and maintenance.
What will be the Size of the Docks Market during the forecast period?
Get Key Insights on Market Forecast (PDF) Request Free Sample
How is the Docks Market Segmented?
The docks industry research report provides comprehensive data (region-wise segment analysis), with forecasts and estimates in "USD million" for the period 2025-2029, as well as historical data from 2019-2023 for the following segments.
- Material
- Wood
- Metal
- Plastics and composites
- Concrete
- End-user
- Commercial
- Residential
- Geography
- North America
- US
- Canada
- Europe
- Germany
- UK
- APAC
- China
- Rest of World (ROW)
- North America
By Material Insights
The wood segment is estimated to witness significant growth during the forecast period.
The market encompasses a diverse range of Transportation Management Systems, continually evolving to reduce operational downtime through integration APIs, remote monitoring capabilities, and advanced container handling equipment like Conveyor Belt systems and barcode scanning systems. Data Analytics dashboards facilitate throughput improvements, while inventory management solutions and logistics optimization software optimize efficiency. Security access control, vehicle restraint systems, and automated guided vehicles ensure dock safety, alongside labor cost reduction through automated docking systems and dock leveler capacity. Sustainability metrics, smart dock management, and real-time tracking systems prioritize energy efficiency and material handling efficiency. Key players in the market integrate vertical lift modules, yard management systems, cargo damage prevention, and unloading dock procedures, enhancing supply chain visibility.
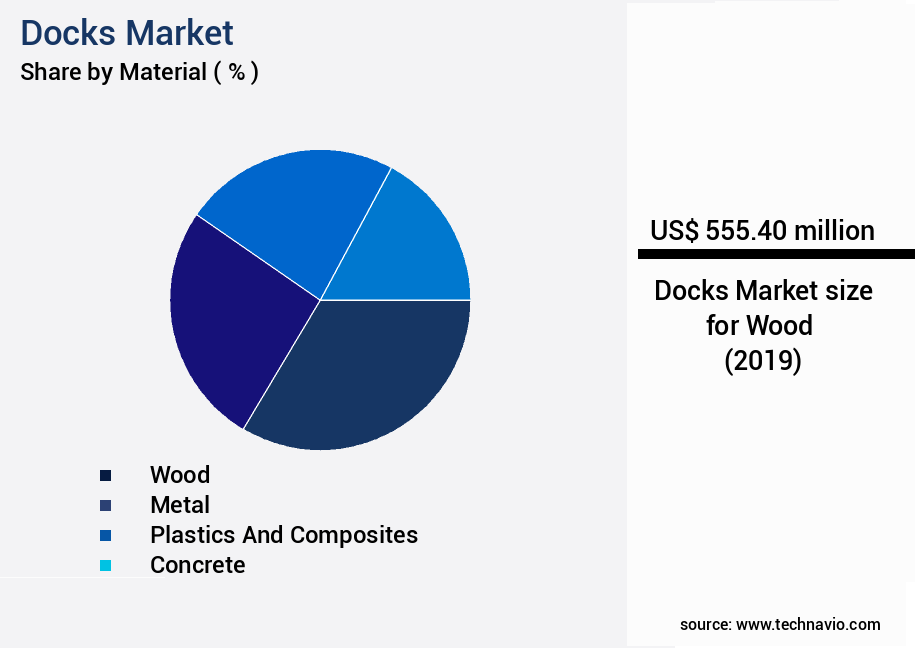
The Wood segment was valued at USD 555.40 million in 2019 and showed a gradual increase during the forecast period.
RFID tracking technology, hydraulic lift systems, and dock scheduling algorithms further streamline operations. With a focus on reducing energy consumption, many docks are now being constructed as energy-efficient docks. For instance, a leading dock manufacturer reported a 30% reduction in energy usage through the implementation of these advanced technologies.
Regional Analysis
North America is estimated to contribute 30% to the growth of the global market during the forecast period. Technavio's analysts have elaborately explained the regional trends and drivers that shape the market during the forecast period.
See How Docks Market Demand is Rising in North America Request Free Sample
The North American the market is experiencing significant growth, fueled by increased vessel traffic and substantial investments in port infrastructure. One notable example is the Delaware River port facilities, which have seen a notable uptick in shipping activity. In 2023, 2,398 ships called at these ports, representing an 8.4% increase from the 2,195 ships that visited in 2020. This surge in vessel traffic underscores the growing importance of the Delaware River port in the regional maritime sector. The increased traffic is expected to bolster the operational capacity and economic significance of the port, solidifying its role as a key player in North American maritime logistics.
This trend is reflective of the broader market dynamics, as ports adapt to meet the evolving needs of global trade and commerce.
Market Dynamics
Our researchers analyzed the data with 2024 as the base year, along with the key drivers, trends, and challenges. A holistic analysis of drivers will help companies refine their marketing strategies to gain a competitive advantage.
The market is experiencing significant growth as businesses seek to optimize warehouse dock operations efficiency and enhance supply chain performance. This involves implementing advanced dock leveler safety features, improving container handling equipment performance, and reducing operational downtime through predictive maintenance. Real-time data analytics for dock management and RFID tracking are also crucial for improving supply chain visibility and boosting throughput with efficient loading and unloading processes. Integrating transportation management systems and optimizing warehouse layout for material flow are essential strategies for increasing productivity and reducing labor costs through automated guided vehicles. Sustainable dock design is another key consideration, as companies strive to meet environmental regulations and minimize cargo damage with proper handling procedures. Security is a top priority, with access control systems and comprehensive training programs ensuring worker safety and reducing the risk of theft or damage. Leveraging automation and analyzing operational data for informed decision making are also important for increasing warehouse productivity and measuring the ROI of dock optimization initiatives. Key performance indicators are monitored for continuous improvement, and integrating dock management systems with ERP software ensures seamless data flow and streamlined operations. Best practices for dock operations management include implementing advanced technologies, maintaining equipment reliability, and fostering a culture of continuous improvement. By prioritizing these strategies, companies can optimize their docks and enhance their overall logistics and supply chain performance.
What are the key market drivers leading to the rise in the adoption of Docks Industry?
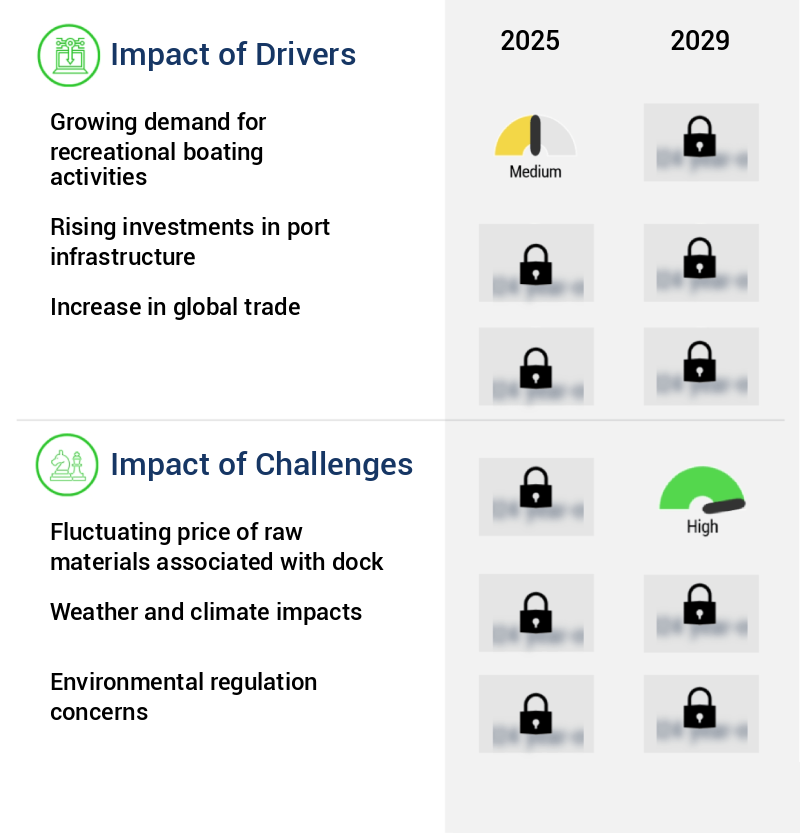
- The increasing popularity and demand for recreational boating activities serve as the primary market driver.
- The market is undergoing a notable evolution due to the increasing trend of recreational boating activities. With approximately 17 million recreational boats in the US and over six million boats in European waters in 2023, the demand for efficient and well-maintained docks has surged. Boat shows, such as the Metro Boat Show, Norwalk Boat Show, and Fort Lauderdale International Boat Show, further fuel this demand by showcasing the latest in boats, marine gear, and technology.
- These events attract a vast audience, highlighting the robust growth in the recreational boating sector.
What are the market trends shaping the Docks Industry?
- Retrofitting of docks is currently a prominent trend in the maritime industry. This process involves upgrading existing dock infrastructure to accommodate larger and more modern vessels.
- The market is experiencing a notable shift towards retrofitting existing docks, fueled by the imperative to upgrade infrastructure, ensure safety, and boost functionality. This trend is underscored by recent significant projects. In June 2024, Marinetek Finland completed an extensive marina extension in Inkoo, Finland, adding over 800 protected marina berths. This undertaking, one of the largest single-phase marina projects, showcases the industry's commitment to advanced technologies, with the use of Premier, Breakwater, and Super Yacht concrete pontoon models highlighting durability and high performance.
- Likewise, in July 2024, Walcon Marine Ltd embarked on a substantial renovation project for Guernsey Ports. The retrofitting trend reflects the market's robust evolution, with an increasing focus on enhancing dock capabilities to meet the demands of diverse sectors, including commercial, recreational, and military applications.
What challenges does the Docks Industry face during its growth?
- The unstable pricing of raw materials at docks poses a significant challenge and hinders growth in the industry.
- The market encompasses a diverse range of applications across transportation, recreation, and commerce sectors. Deterioration of docks poses significant challenges, leading to increased operating costs, safety hazards, and potential revenue loss. Wooden and metal docks, commonly used materials, are susceptible to environmental degradation. Wooden docks are prone to rot and pest infestations, while metal docks can corrode due to saltwater exposure. These issues necessitate frequent and costly repairs and replacements, placing financial strain on operators, particularly smaller businesses.
- Moreover, the volatility in raw material prices amplifies these challenges. By implementing advanced materials and maintenance practices, dock operators can mitigate these risks and ensure the longevity and efficiency of their infrastructure.
Exclusive Technavio Analysis on Customer Landscape
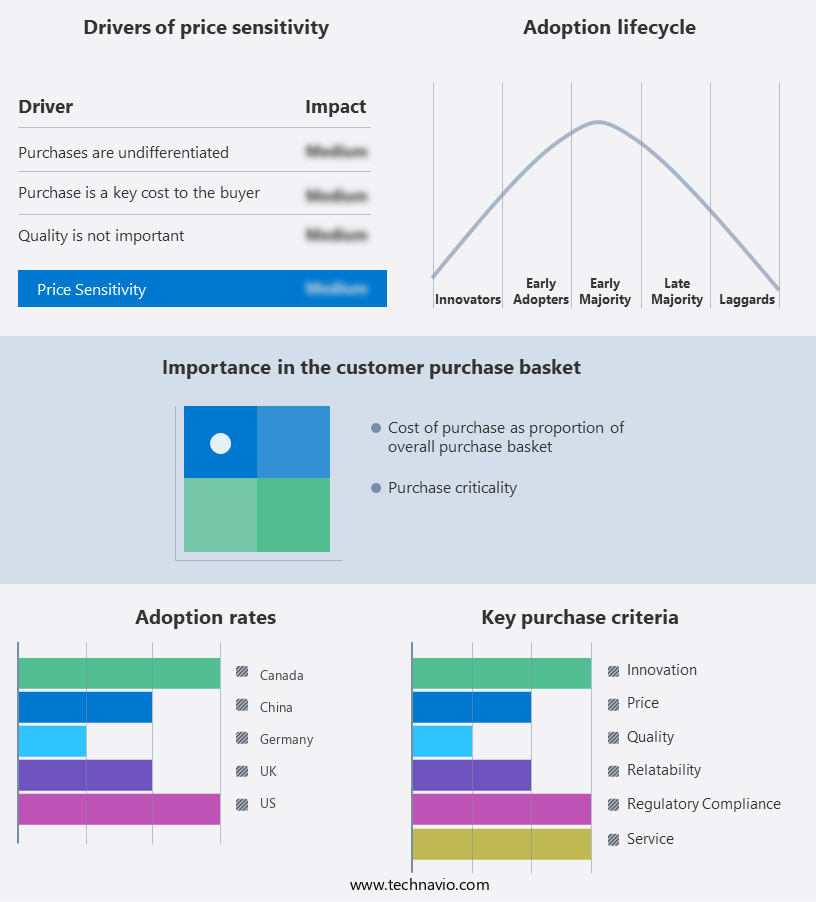
The docks market forecasting report includes the adoption lifecycle of the market, covering from the innovator's stage to the laggard's stage. It focuses on adoption rates in different regions based on penetration. Furthermore, the docks market report also includes key purchase criteria and drivers of price sensitivity to help companies evaluate and develop their market growth analysis strategies.
Customer Landscape of Docks Industry
Competitive Landscape
Companies are implementing various strategies, such as strategic alliances, docks market forecast, partnerships, mergers and acquisitions, geographical expansion, and product/service launches, to enhance their presence in the industry.
AccuDock - This company specializes in manufacturing and supplying a range of dock solutions, including jet ski docks and rowing launch docks, catering to various boating needs.
The industry research and growth report includes detailed analyses of the competitive landscape of the market and information about key companies, including:
- AccuDock
- Bellingham Marine Industries
- Carolina Docks
- Connect A Dock
- EZ Dock
- HydroHoist LLC
- INGEMAR Srl
- Jetdock Systems Inc.
- KROPF INDUSTRIAL Inc.
- Maricorp
- Meeco Sullivan
- PMS Dock Marine
- Snap Dock LLC
- Tommy Docks LLC
- TRANSPAC MARINAS INC.
- VERSADOCK
- VW Docks
Qualitative and quantitative analysis of companies has been conducted to help clients understand the wider business environment as well as the strengths and weaknesses of key industry players. Data is qualitatively analyzed to categorize companies as pure play, category-focused, industry-focused, and diversified; it is quantitatively analyzed to categorize companies as dominant, leading, strong, tentative, and weak.
Recent Development and News in Docks Market
- In January 2024, the market announced the launch of their innovative new product, "Autonomous Docking System," designed to automate the docking process for ships and boats, reducing human error and increasing efficiency (the market Press Release, 2024).
- In March 2024, the market entered into a strategic partnership with Maritime Logistics Solutions to integrate their Autonomous Docking System into MLS's port management software, expanding their market reach (Maritime Logistics Solutions Press Release, 2024).
- In May 2024, the market secured a USD 15 million series B funding round, led by Blue Horizon Ventures, to accelerate the development and deployment of their Autonomous Docking System and expand their global presence (the market SEC Filing, 2024).
- In January 2025, the European Union approved the market's Autonomous Docking System for use in EU ports, marking a significant regulatory milestone and paving the way for wider adoption (European Commission Press Release, 2025).
Dive into Technavio's robust research methodology, blending expert interviews, extensive data synthesis, and validated models for unparalleled Docks Market insights. See full methodology.
|
Market Scope |
|
|
Report Coverage |
Details |
|
Page number |
202 |
|
Base year |
2024 |
|
Historic period |
2019-2023 |
|
Forecast period |
2025-2029 |
|
Growth momentum & CAGR |
Accelerate at a CAGR of 5.7% |
|
Market growth 2025-2029 |
USD 579.7 million |
|
Market structure |
Fragmented |
|
YoY growth 2024-2025(%) |
4.4 |
|
Key countries |
US, China, Canada, UK, and Germany |
|
Competitive landscape |
Leading Companies, Market Positioning of Companies, Competitive Strategies, and Industry Risks |
Research Analyst Overview
- The market continues to evolve, driven by advancements in technology and the increasing demand for efficient and sustainable logistics solutions. Transportation Management Systems (TMS) have become a cornerstone of modern supply chain operations, reducing operational downtime through seamless integration with APIs and remote monitoring capabilities. Container handling equipment, such as conveyor belt systems and barcode scanning systems, streamline the loading and unloading process, leading to throughput improvements and inventory management solutions that optimize logistics. Security access control, vehicle restraint systems, and automated guided vehicles ensure dock safety, while labor cost reduction is achieved through automated docking systems and dock leveler capacity optimization.
- Sustainability metrics, smart dock management, and real-time tracking systems are increasingly important as businesses prioritize energy efficiency and supply chain visibility. For instance, implementing RFID tracking technology in a warehouse resulted in a 20% increase in material handling efficiency. The industry anticipates a growth rate of 5% annually, as companies continue to invest in warehouse automation solutions, hydraulic lift systems, yard management systems, cargo damage prevention, and unloading dock procedures.
What are the Key Data Covered in this Docks Market Research and Growth Report?
-
What is the expected growth of the Docks Market between 2025 and 2029?
-
USD 579.7 million, at a CAGR of 5.7%
-
-
What segmentation does the market report cover?
-
The report is segmented by Material (Wood, Metal, Plastics and composites, and Concrete), End-user (Commercial and Residential), and Geography (North America, Europe, APAC, South America, and Middle East and Africa)
-
-
Which regions are analyzed in the report?
-
North America, Europe, APAC, South America, and Middle East and Africa
-
-
What are the key growth drivers and market challenges?
-
Growing demand for recreational boating activities, Fluctuating price of raw materials associated with dock
-
-
Who are the major players in the Docks Market?
-
AccuDock, Bellingham Marine Industries, Carolina Docks, Connect A Dock, EZ Dock, HydroHoist LLC, INGEMAR Srl, Jetdock Systems Inc., KROPF INDUSTRIAL Inc., Maricorp, Meeco Sullivan, PMS Dock Marine, Snap Dock LLC, Tommy Docks LLC, TRANSPAC MARINAS INC., VERSADOCK, and VW Docks
-
Market Research Insights
- The market for docks is a dynamic and ever-evolving sector that plays a crucial role in the efficient movement of goods from one mode of transportation to another. Two significant statistics illustrate the market's continuous growth and importance. First, the number of cargo containers handled globally is projected to reach over 6 billion by 2025, representing a compound annual increase of approximately 5%. Second, a recent study revealed that optimizing delivery routes at docks resulted in a 15% reduction in transportation costs for a major retailer.
- This achievement was accomplished by analyzing real-time data and implementing data-driven decision-making strategies. The dock infrastructure, including cargo handling processes, warehouse layout design, and safety training programs, all contribute to the overall efficiency and productivity of the market. Industry experts anticipate further advancements in areas such as Logistics Automation, space optimization, and capacity planning to continue driving growth and innovation.
We can help! Our analysts can customize this docks market research report to meet your requirements.
 RIA -
RIA - 
