Dravet Syndrome Treatment Market Size 2025-2029
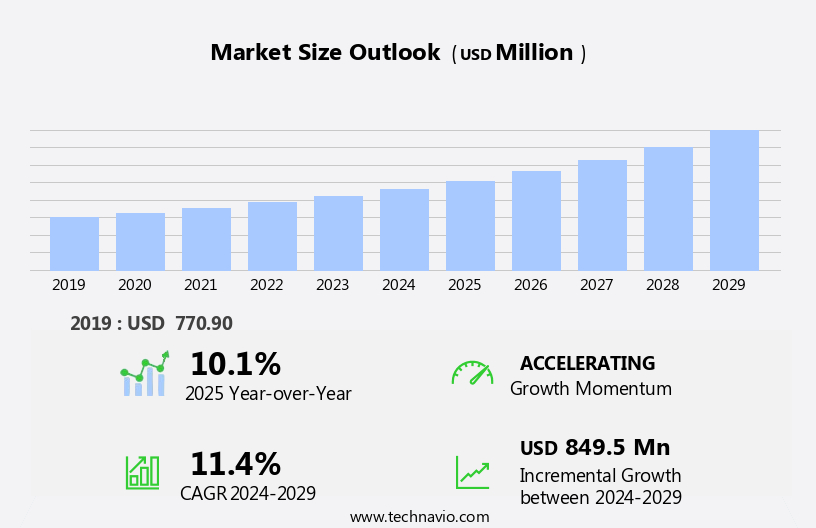
The dravet syndrome treatment market size is forecast to increase by USD 849.5 million, at a CAGR of 11.4% between 2024 and 2029.
- The market is experiencing significant growth, driven by the increasing number of special regulatory designations for Dravet Syndrome treatments. These designations, such as Orphan Drug Designation and Fast Track Designation, offer incentives for pharmaceutical companies to invest in research and development for this rare condition. Additionally, the use of new-generation drugs, like sodium channel blockers and cannabidiol, is gaining momentum due to their efficacy in managing seizures and improving overall quality of life for patients. However, the market faces a notable challenge: low awareness of Dravet Syndrome. Doctors often prescribe anticonvulsants, benzodiazepines, and cannabinoids to manage symptoms.
- This lack of awareness hampers early diagnosis and treatment, limiting the potential market size and growth. Companies seeking to capitalize on market opportunities must focus on raising awareness, collaborating with patient advocacy groups, and investing in research and development for effective treatments. Navigating this challenge will require strategic partnerships and targeted marketing efforts to reach the underserved patient population. Another trend is the growing utilization of new-generation drugs, such as Cannabidiol (CBD) and ketogenic diet, which have shown promising results in managing Dravet Syndrome symptoms.
What will be the Size of the Dravet Syndrome Treatment Market during the forecast period?
- The market, particularly those related to epilepsy, continues to evolve with a focus on improving seizure control measures for various seizure types. Seizure triggers and emergency management are critical areas of research, as status epilepticus and refractory epilepsy pose significant challenges for both patients and healthcare providers. Orphan drug designation has accelerated the development of innovative treatments for severe epilepsy, including epilepsy surgery and brain stimulation techniques like electrocorticography (ECOG). Biopharmaceutical companies are investing in fast track approval for new drugs and therapies to address the unmet needs of those with epilepsy, particularly those experiencing generalized seizures, focal seizures, and infantile spasms.
- Seizure duration, frequency, severity, and seizure types vary widely among patients, necessitating individualized care plans. First aid training and effective emergency management are essential components of epilepsy care, while intensive care units provide critical support for patients during seizure episodes. Drug monitoring and seizure control measures are ongoing priorities for epilepsy management, with a focus on minimizing the risk of adverse effects and optimizing treatment efficacy.
How is this Dravet Syndrome Treatment Industry segmented?
The dravet syndrome treatment industry research report provides comprehensive data (region-wise segment analysis), with forecasts and estimates in "USD million" for the period 2025-2029, as well as historical data from 2019-2023 for the following segments.
- Product
- SGDs
- TGDs
- FGDs
- Diagnostic Methods
- Magnetic resonance imaging
- Electroencephalography
- SCN1A genetic testing
- Others
- Distribution Channel
- Hospital pharmacy
- Retail pharmacy
- E-commerce
- Others
- Geography
- North America
- US
- Canada
- Mexico
- Europe
- France
- Germany
- Italy
- UK
- APAC
- China
- India
- Japan
- Rest of World (ROW)
- North America
By Product Insights
The SGDs segment is estimated to witness significant growth during the forecast period. The market encompasses various interventions, including gene therapy, personalized medicine, and surgical procedures, aiming to improve the quality of life and manage adverse effects for patients. Gene therapy holds promise through its potential to address the underlying genetic cause, while personalized medicine allows for tailored treatment plans based on individual genetic profiles. Support groups offer vital psychosocial support for patients and their families, and pharmacodynamic studies contribute to a better understanding of drug efficacy and interactions. Genetic counseling is essential for patients and families to make informed decisions regarding diagnosis, treatment, and potential risks. Non-resective surgery, such as vagus nerve stimulation, can help reduce seizure frequency, while symptomatic treatment focuses on managing seizures and associated symptoms.
End-of-life care and palliative measures are crucial for managing the complexities of Dravet syndrome during advanced stages. Drug resistance is a significant challenge, necessitating ongoing research and development of new treatment options. Patient advocacy groups, such as the Dravet Syndrome Foundation, play a vital role in raising awareness, funding research, and providing education and training. Cannabidiol (CBD) is a promising alternative treatment, with insurance coverage and clinical trials underway to explore its potential benefits. Clinical pharmacology, public awareness, and genetic testing are essential components of disease management, allowing for early intervention and effective treatment strategies. Developmental delays and cognitive impairment require a multidisciplinary approach, involving education, behavioral interventions, and long-term care.
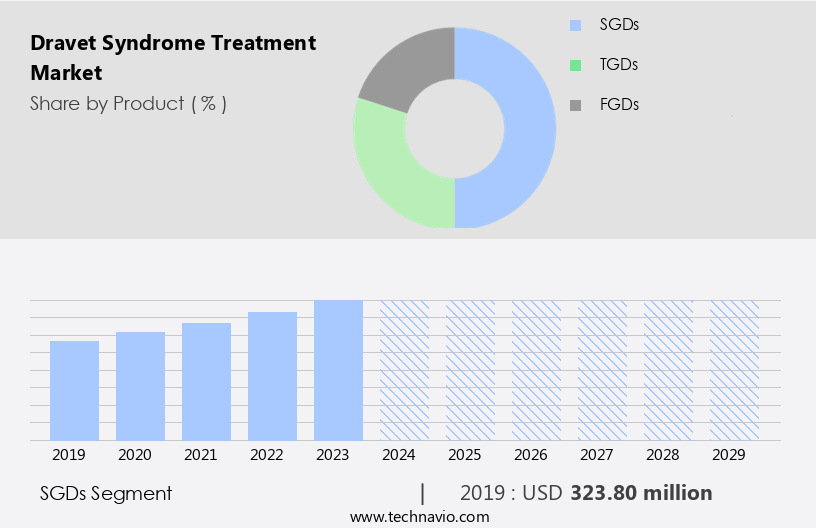
The SGDs segment was valued at USD 323.80 million in 2019 and showed a gradual increase during the forecast period.
Sodium channel blockers (SGDs) represent a significant segment of the market, offering benefits through their pharmacokinetic profiles and tolerability. Topiramate is a notable example of an SGD used in Dravet syndrome treatment, while stiripentol, although commonly prescribed, functions primarily through GABAergic mechanisms and is not categorized as an SGD. In the context of Dravet syndrome treatment, healthcare professionals must consider various factors, including drug metabolism, interactions, dose optimization, and patient management. Seizure control, healthcare costs, and medication compliance are crucial aspects of disease management, with anticonvulsant medications and the ketogenic diet being essential components. Brain imaging, neurological monitoring, and regulatory approvals are essential for ensuring effective and safe treatment options.
The Dravet Syndrome Treatment Market is witnessing significant advancements with a focus on improving outcomes for individuals with resistant epilepsy. Dravet syndrome is a rare but severe form of epilepsy characterized by frequent epileptic seizures that are difficult to manage with conventional treatments. Addressing seizure severity is crucial, as uncontrolled episodes can lead to serious complications and impact the quality of life. The market is expanding with new therapies, including targeted medications and gene-based treatments. Additionally, innovations in home care are enhancing patient support, providing safer environments, and optimizing rescue interventions.
Biotech companies are at the forefront of Dravet syndrome research and drug development, focusing on precision medicine and patient management strategies. Neurological disorders, such as Dravet syndrome, require a collaborative approach, involving ongoing research, education, and advocacy efforts to improve patient outcomes.
Regional Analysis
North America is estimated to contribute 42% to the growth of the global market during the forecast period. Technavio's analysts have elaborately explained the regional trends and drivers that shape the market during the forecast period.
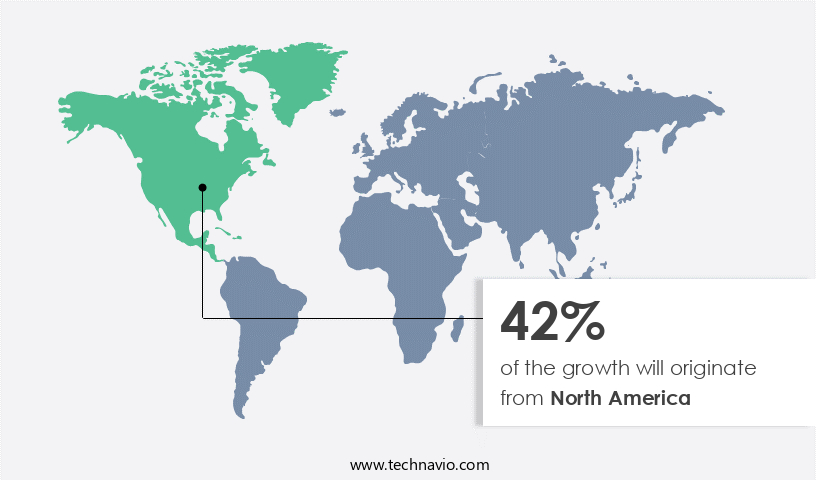
The market encompasses various interventions aimed at improving quality of life and managing symptoms for individuals diagnosed with this severe form of epilepsy. In North America, this market is currently the largest, driven by increased initiatives and funding from organizations to develop new treatments. The US and Canada are significant contributors to the market, with established medical facilities and rising healthcare expenditures playing crucial roles. These countries have seen substantial growth in healthcare spending, according to the Centers for Medicare and Medicaid Services. Gene therapy, personalized medicine, and surgical interventions like non-resective surgery and vagus nerve stimulation are among the treatment options.
Pharmacodynamic studies and clinical trials are ongoing to assess the efficacy of various anticonvulsant medications, sodium channel blockers, potassium channel blockers, and gabaergic drugs. Precision medicine and patient management strategies, such as dose optimization, medication compliance, and psychosocial support, are essential components of the treatment approach. Support groups, patient advocacy organizations like the Dravet Syndrome Foundation and Epilepsy Foundation, and educational resources provide essential resources for patients and families. Drug metabolism, interactions, and safety are crucial considerations, with pharmacokinetic profiling and regulatory approvals ensuring optimal treatment outcomes. Neurological monitoring, long-term care, and palliative care are essential aspects of managing Dravet syndrome, particularly during end-of-life care.
Developmental delays, cognitive impairment, behavioral issues, and seizure control are significant challenges faced by individuals with Dravet syndrome. Research funding and drug development efforts are ongoing to address these challenges, with biotech companies exploring innovative treatments like cannabidiol (CBD) and ketogenic diet. Healthcare professionals play a vital role in patient education, treatment adherence, and disease management, with early intervention being crucial for optimal outcomes. Despite these advancements, challenges remain, including drug resistance and healthcare costs. Insurance coverage and access to treatment remain significant barriers for many patients. Ongoing research, public awareness campaigns, and collaborative efforts between stakeholders are essential to addressing these challenges and improving the lives of individuals with Dravet syndrome.
Market Dynamics
Our researchers analyzed the data with 2024 as the base year, along with the key drivers, trends, and challenges. A holistic analysis of drivers will help companies refine their marketing strategies to gain a competitive advantage.
What are the Dravet Syndrome Treatment market drivers leading to the rise in the adoption of Industry?
- The growth of special regulatory designations serves as the primary catalyst for market expansion. Dravet Syndrome, a severe and complex epilepsy disorder, necessitates effective treatment options for managing seizures, behavioral issues, and long-term care. The Dravet Syndrome Foundation and healthcare professionals are dedicated to advancing drug development and improving patient outcomes. Encouragingly, regulatory authorities like the US FDA and European Medicines Agency (EMA) expedite the approval process for drugs treating serious conditions through designations such as Orphan Drug, Fast Track, and Breakthrough Therapy. For instance, Encoded Therapeutics Inc.'s ETX101, a gene regulation therapy designed to upregulate SCN1A gene expression, received Fast Track, Rare Pediatric Disease, Orphan Drug Designations from the US FDA and Orphan Designation from the EMA for Dravet syndrome treatment.
- Neurological monitoring, gabaergic drugs, potassium channel blockers, dietary therapy, brain imaging, and computed tomography (CT) are essential treatment approaches. Education and training for patients and caregivers, as well as ensuring treatment adherence, are crucial for optimal seizure control and managing healthcare costs. Behavioral issues and healthcare professionals' collaboration are vital for addressing the unique challenges of Dravet Syndrome. Continuous research and advancements in understanding this condition will contribute significantly to improving treatment options and enhancing patient quality of life.
What are the Dravet Syndrome Treatment market trends shaping the Industry?
- The use of new-generation drugs is gaining significant traction in the market. This trend reflects the increasing demand for advanced medical solutions. Dravet Syndrome, a severe and complex epilepsy disorder, necessitates effective treatment approaches. Traditional anticonvulsant medications like clobazam and valproate, which have been in use for decades, offer limitations due to their side effects and narrow therapeutic indices. However, the advent of newer generations of antiepileptic drugs (SGDs and TGDs) has brought about significant advancements in Dravet Syndrome treatment. During the 1990s and early 2000s, SGDs such as stiripentol and topiramate, along with other drugs like lamotrigine, levetiracetam, and gabapentin, entered the market. These drugs, compared to the first-generation anticonvulsants, have fewer side effects and wider therapeutic ranges. Consequently, the adoption of new-generation drugs is more prevalent than that of earlier-generation drugs.
- However, SGDs remain popular due to their superior efficacy in managing Dravet Syndrome. Neurological disorders like Dravet Syndrome necessitate a comprehensive approach to treatment, which includes electroencephalography (EEG), drug safety evaluations, patient education, palliative care, and early intervention. The Epilepsy Foundation plays a crucial role in providing resources and support for patients and their families. Additionally, therapeutic interventions like resective surgery and the ketogenic diet can be employed in specific cases. As research and development continue, the focus on disease management and improving patient outcomes remains paramount.
How does Dravet Syndrome Treatment market face challenges during its growth?
- Low awareness poses a significant challenge to the industry's growth. This issue hinders the expansion and progression of the sector, requiring increased efforts in marketing, education, and public relations to raise awareness and attract new customers. Dravet Syndrome (DS), a rare and severe form of epilepsy, primarily affects infants with normal development prior to the onset of seizures, often triggered by fever. Misunderstood symptoms and delayed diagnosis can lead to unnecessary pain and distress for children. To address this, advancements in healthcare include gene therapy, personalized medicine, and clinical trials. These approaches aim to improve quality of life for DS patients, minimize adverse effects, and provide effective symptomatic treatment.
- Insurance coverage and clinical pharmacology research are ongoing priorities to ensure accessibility and affordability for patients. End-of-life care is another essential aspect of DS management, focusing on palliative care and symptom relief. As research continues to unravel the complexities of DS, the emphasis on understanding and addressing its challenges remains a priority. Recent research highlights the importance of early diagnosis and intervention, underscoring the need for continued awareness and education. The DS treatment landscape is evolving, with a focus on personalized medicine, genetic counseling, and innovative therapies. Through collaboration between medical professionals, researchers, and patient advocacy groups, the goal is to improve the lives of those affected by DS and address the unique challenges it presents.
Exclusive Customer Landscape
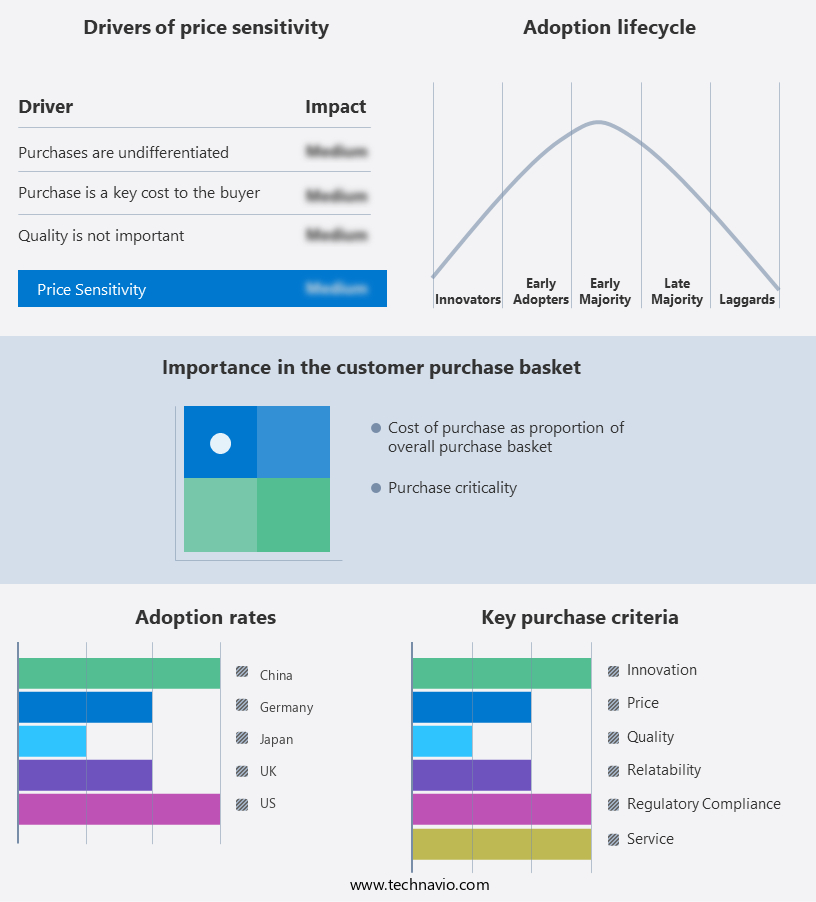
The dravet syndrome treatment market forecasting report includes the adoption lifecycle of the market, covering from the innovator's stage to the laggard's stage. It focuses on adoption rates in different regions based on penetration. Furthermore, the dravet syndrome treatment market report also includes key purchase criteria and drivers of price sensitivity to help companies evaluate and develop their market growth analysis strategies.
Customer Landscape
Key Companies & Market Insights
Companies are implementing various strategies, such as strategic alliances, dravet syndrome treatment market forecast, partnerships, mergers and acquisitions, geographical expansion, and product/service launches, to enhance their presence in the industry.
AbbVie Inc. - The company provides a solution for Dravet syndrome through a 5 mL single dose injection vial of Valproic acid, marketed as Depacon.
The industry research and growth report includes detailed analyses of the competitive landscape of the market and information about key companies, including:
- AbbVie Inc.
- BIOCODEX SAS
- Encoded Therapeutics Inc.
- Epygenix Therapeutics Inc.
- H Lundbeck AS
- Jazz Pharmaceuticals Plc
- Johnson and Johnson Services Inc.
- Lupin Ltd.
- PTC Therapeutics Inc.
- Stoke Therapeutics Inc.
- Sun Pharmaceutical Industries Ltd.
- Supernus Pharmaceuticals Inc.
- Takeda Pharmaceutical Co. Ltd.
- UCB SA
- Viatris Inc.
- Xenon Pharmaceuticals Inc.
- Zydus Lifesciences Ltd.
Qualitative and quantitative analysis of companies has been conducted to help clients understand the wider business environment as well as the strengths and weaknesses of key industry players. Data is qualitatively analyzed to categorize companies as pure play, category-focused, industry-focused, and diversified; it is quantitatively analyzed to categorize companies as dominant, leading, strong, tentative, and weak.
Recent Development and News in Dravet Syndrome Treatment Market
- In February 2023, the U.S. Food and Drug Administration (FDA) granted accelerated approval to Zogenix's Fintepla (fenfluramine), an oral solution for the treatment of seizures associated with Dravet Syndrome in patients two years and older (FDA press release, 2023). This marks a significant regulatory milestone, providing a new therapeutic option for patients suffering from this severe and lifelong epilepsy condition.
- In November 2022, Eisai and Biogen announced a strategic collaboration to co-develop and commercialize their investigational treatment, BAN-2401, for Dravet Syndrome. This partnership combines Eisai's expertise in neuroscience and Biogen's experience in rare diseases, aiming to accelerate the development and potential approval of this treatment (Eisai press release, 2022).
- In July 2021, Marinus Pharmaceuticals reported positive results from a Phase 3 trial of ganaxolone in the treatment of Dravet Syndrome. The study met its primary and secondary endpoints, demonstrating a significant reduction in seizure frequency, providing hope for a potential new treatment option for this patient population (Marinus Pharmaceuticals press release, 2021).
- In March 2020, Sage Therapeutics and Biogen entered into a definitive agreement for Biogen to acquire Sage Therapeutics for approximately USD 6.7 billion. This acquisition granted Biogen access to Sage's investigational Dravet Syndrome treatment, SAGE-217, which is currently in Phase 3 trials (Business Wire, 2020). This strategic move strengthened Biogen's position in the rare disease market and provided resources for the continued development of potential treatments for Dravet Syndrome.
Research Analyst Overview
Dravet syndrome, a severe and complex form of epilepsy, continues to challenge the medical community with its intricacies and evolving treatment landscape. The dynamic nature of this market is characterized by ongoing research and development in various sectors. For instance, electroencephalography (EEG), a diagnostic tool used to assess neurological disorders, plays a crucial role in understanding the underlying electrical activity of the brain in Dravet syndrome patients. Moreover, the pharmacodynamic studies of anticonvulsant medications, such as sodium channel blockers and GABAergic drugs, are a significant focus in the quest for effective treatment. Biotech companies are at the forefront of innovation, exploring gene therapy and personalized medicine approaches to address the unique genetic basis of Dravet syndrome.
Regulatory approvals and clinical trials are essential components of the drug development process, ensuring the safety and efficacy of new treatment options. Neurological monitoring, including brain imaging techniques like computed tomography (CT) and EEG, contributes to the early identification and intervention of seizures and associated complications. Patient education and support groups are integral to managing the disease, addressing behavioral issues, medication compliance, and psychosocial aspects of living with Dravet syndrome. The Epilepsy Foundation and Dravet Syndrome Foundation play essential roles in raising public awareness, advocating for insurance coverage, and providing resources for patients and families.
Palliative care, ketogenic diet, vagus nerve stimulation, and resective surgery are among the various treatment options employed in the management of Dravet syndrome, each with its unique benefits and challenges. Ongoing research in clinical pharmacology, drug metabolism, and drug interactions aims to optimize treatment and improve patient outcomes. The continuous unfolding of market activities and evolving patterns in the Dravet syndrome treatment landscape underscores the importance of a collaborative, multidisciplinary approach to disease management. This includes the involvement of healthcare professionals, patient management, and long-term care strategies to ensure the best possible quality of life for those affected by this condition.
Dive into Technavio's strong research methodology, blending expert interviews, extensive data synthesis, and validated models for unparalleled Dravet Syndrome Treatment Market insights. See full methodology.
|
Market Scope |
|
|
Report Coverage |
Details |
|
Page number |
222 |
|
Base year |
2024 |
|
Historic period |
2019-2023 |
|
Forecast period |
2025-2029 |
|
Growth momentum & CAGR |
Accelerate at a CAGR of 11.4% |
|
Market growth 2025-2029 |
USD 849.5 million |
|
Market structure |
Fragmented |
|
YoY growth 2024-2025(%) |
10.1 |
|
Key countries |
US, China, Canada, Germany, France, Japan, UK, India, Mexico, and Italy |
|
Competitive landscape |
Leading Companies, Market Positioning of Companies, Competitive Strategies, and Industry Risks |
What are the Key Data Covered in this Dravet Syndrome Treatment Market Research and Growth Report?
- CAGR of the Dravet Syndrome Treatment industry during the forecast period
- Detailed information on factors that will drive the growth and forecasting between 2025 and 2029
- Precise estimation of the size of the market and its contribution of the industry in focus to the parent market
- Accurate predictions about upcoming growth and trends and changes in consumer behaviour
- Growth of the market across North America, Europe, Asia, and Rest of World (ROW)
- Thorough analysis of the market's competitive landscape and detailed information about companies
- Comprehensive analysis of factors that will challenge the dravet syndrome treatment market growth of industry companies
We can help! Our analysts can customize this dravet syndrome treatment market research report to meet your requirements.
 RIA -
RIA - 
