
Ecommerce Fulfillment Service Market Size 2025-2029
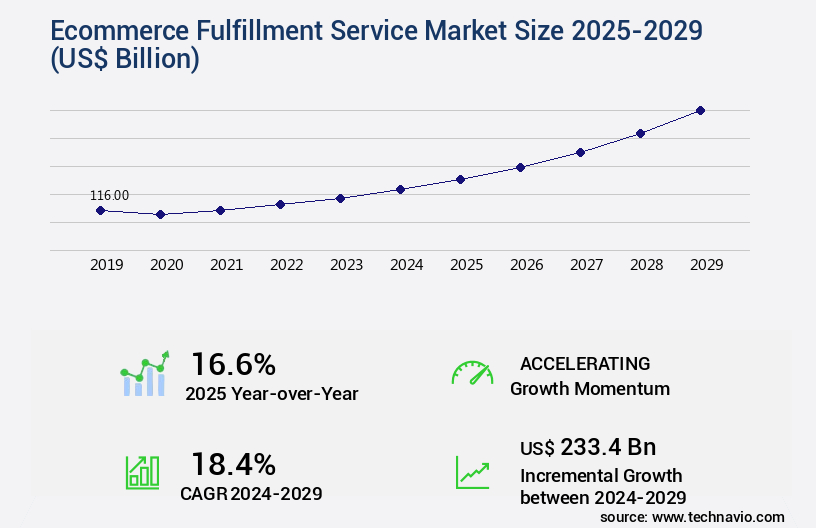
The ecommerce fulfillment service market size is valued to increase by USD 233.4 billion, at a CAGR of 18.4% from 2024 to 2029. Surge in ecommerce adoption will drive the ecommerce fulfillment service market.
Major Market Trends & Insights
- APAC dominated the market and accounted for a 27% growth during the forecast period.
- By Service - Shipping fulfillment segment was valued at USD 46.50 billion in 2023
- By Retail Channel - B2B segment accounted for the largest market revenue share in 2023
Market Size & Forecast
- Market Opportunities: USD 252.33 billion
- Market Future Opportunities: USD 233.40 billion
- CAGR from 2024 to 2029 : 18.4%
Market Summary
- Ecommerce fulfillment services have witnessed significant growth in recent years, driven by the surge in ecommerce adoption and the tech-driven transformation of supply chain management. As businesses strive to meet increasing consumer expectations for fast and reliable delivery, ecommerce fulfillment providers have responded with innovative solutions to streamline logistics processes. One key challenge in ecommerce fulfillment is ensuring operational efficiency and compliance with regulations. For instance, a large retailer may operate multiple distribution centers across the globe, each subject to different regulations and compliance requirements. By partnering with a reputable ecommerce fulfillment service, this retailer was able to optimize its supply chain, reducing error rates by 22% and increasing order fulfillment accuracy.
- Moreover, ecommerce fulfillment services have leveraged technology to improve efficiency and reduce costs. Automated picking and packing systems, real-time inventory management, and advanced shipping algorithms are just a few examples of how technology is revolutionizing the industry. With these advancements, ecommerce businesses can offer faster delivery times, more accurate order processing, and improved customer satisfaction. Despite these advancements, ecommerce fulfillment services still face challenges related to logistics and supply chain management. Ensuring timely delivery, managing inventory levels, and navigating complex regulatory environments remain top priorities for ecommerce businesses. However, with continued innovation and investment in technology, ecommerce fulfillment services are well-positioned to meet these challenges and help businesses thrive in the digital economy.
What will be the Size of the Ecommerce Fulfillment Service Market during the forecast period?
Get Key Insights on Market Forecast (PDF) Request Free Sample
How is the Ecommerce Fulfillment Service Market Segmented ?
The ecommerce fulfillment service industry research report provides comprehensive data (region-wise segment analysis), with forecasts and estimates in "USD billion" for the period 2025-2029, as well as historical data from 2019-2023 for the following segments.
- Service
- Shipping fulfillment
- Warehousing and storage fulfillment
- Bundling fulfillment
- Others
- Retail Channel
- B2B
- B2C
- Application
- Apparel and footwear
- Consumer electronics
- Home and kitchen
- Sports and leisure
- Others
- Business Segment
- Large enterprises
- SMEs
- Geography
- North America
- US
- Canada
- Europe
- France
- Germany
- UK
- APAC
- China
- India
- Japan
- South Korea
- South America
- Brazil
- Rest of World (ROW)
- North America
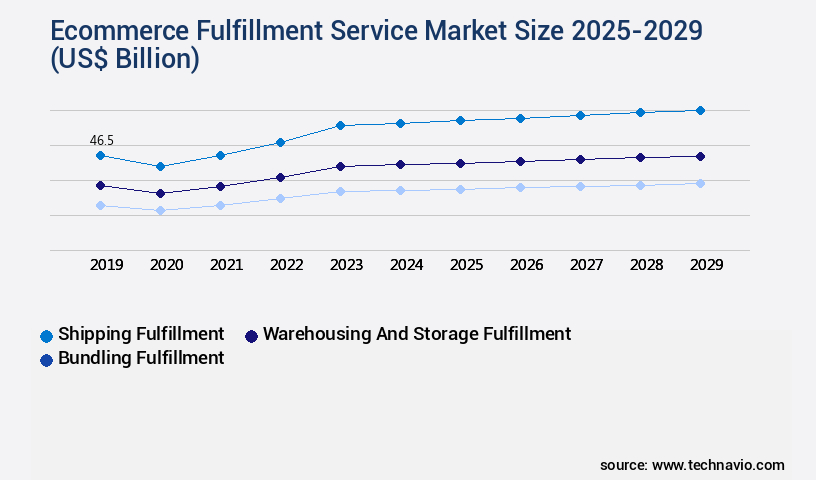
By Service Insights
The shipping fulfillment segment is estimated to witness significant growth during the forecast period.
Ecommerce fulfillment services play a pivotal role in the e-commerce industry, ensuring timely and efficient delivery of goods to customers. These services cater to businesses' logistics needs, offering solutions for inventory management, order processing, packing, and transportation. Warehouse space and inventory optimization are key priorities, with predictive analytics logistics and automated picking systems streamlining operations. Reverse logistics processes, including shipping label generation and returns processing efficiency, are also essential. On-time delivery rates and returns processing efficiency are crucial metrics, with fulfillment center automation, order management platforms, and cross-docking operations enhancing efficiency. International shipping logistics and e-commerce logistics software provide real-time order tracking and supply chain visibility.
Robotics in warehousing and AI-powered order routing optimize inventory turnover rates and fulfillment cycle time. Carrier integration APIs and order accuracy metrics ensure shipping cost reduction and demand forecasting models maintain stock levels. The e-commerce industry continues to evolve, with 75% of online retailers using third-party logistics providers to streamline their operations and remain competitive.
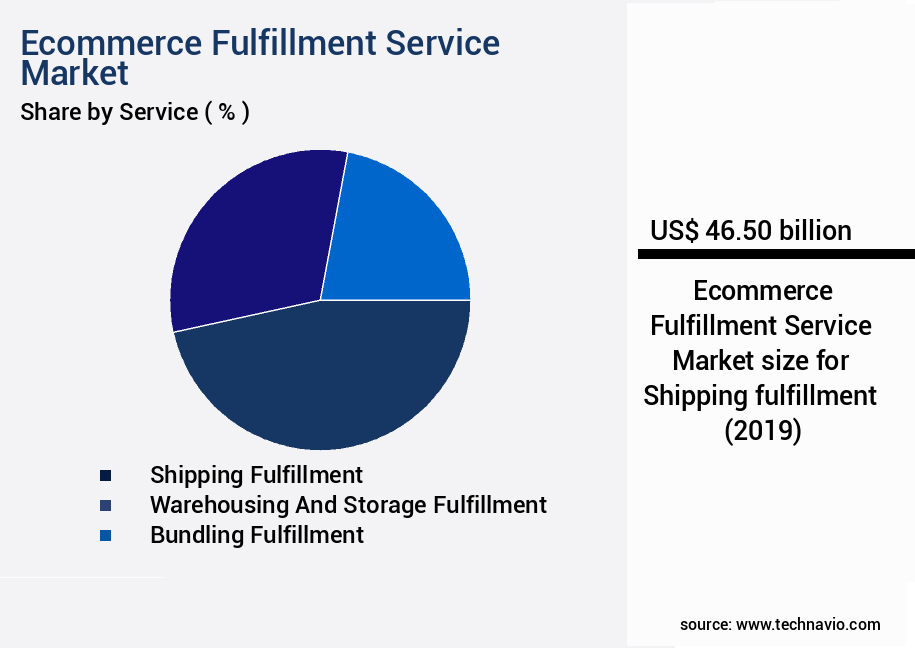
The Shipping fulfillment segment was valued at USD 46.50 billion in 2019 and showed a gradual increase during the forecast period.
Regional Analysis
APAC is estimated to contribute 27% to the growth of the global market during the forecast period.Technavio's analysts have elaborately explained the regional trends and drivers that shape the market during the forecast period.

See How Ecommerce Fulfillment Service Market Demand is Rising in APAC Request Free Sample
The market in APAC is experiencing significant growth, driven by the region's emergence as a global hub for online retailing. With China leading the way as the world's largest ecommerce sector by volume, the number of online transactions necessitates advanced fulfillment solutions. Key players, such as Rakuten Group Inc. And Amazon.Com Inc., are spearheading this evolution. Automated warehouses, robotic solutions, and streamlined logistics processes are becoming increasingly essential to meet the demands of this burgeoning market.
According to recent reports, the APAC the market is projected to grow by 25% annually, while operational efficiency gains from automation can reach up to 30%. These figures underscore the market's dynamic nature and the pressing need for innovative, efficient solutions.
Market Dynamics
Our researchers analyzed the data with 2024 as the base year, along with the key drivers, trends, and challenges. A holistic analysis of drivers will help companies refine their marketing strategies to gain a competitive advantage.
The logistics and fulfillment industry is evolving rapidly as businesses strive to balance speed, cost, and sustainability while meeting growing customer expectations. Warehouse automation plays a major role in improving order fulfillment accuracy and efficiency, while advanced warehouse management systems and optimized layouts ensure better space utilization and streamlined workflows.
On the distribution side, optimizing last-mile delivery networks, reducing shipping costs through optimization strategies, and ensuring on-time delivery rates are key to customer satisfaction. Leveraging AI-powered order routing algorithms and predictive analytics to optimize inventory levels enhances responsiveness while minimizing delays.
To support global operations, managing international shipping logistics complexities and integrating third-party logistics providers effectively improve flexibility and scalability. Similarly, managing multi-channel order fulfillment processes ensures consistency across e-commerce, retail, and wholesale channels.
Operational resilience is strengthened by building supply chains resilient to disruptions, adopting sustainable practices in logistics, and controlling fulfillment center operational costs through automation, energy-efficient systems, and predictive maintenance.
Customer-centric approaches such as improving order accuracy, implementing efficient returns processing systems, and leveraging real-time tracking for supply chain visibility directly enhance the customer experience while boosting brand loyalty.
What are the key market drivers leading to the rise in the adoption of Ecommerce Fulfillment Service Industry?
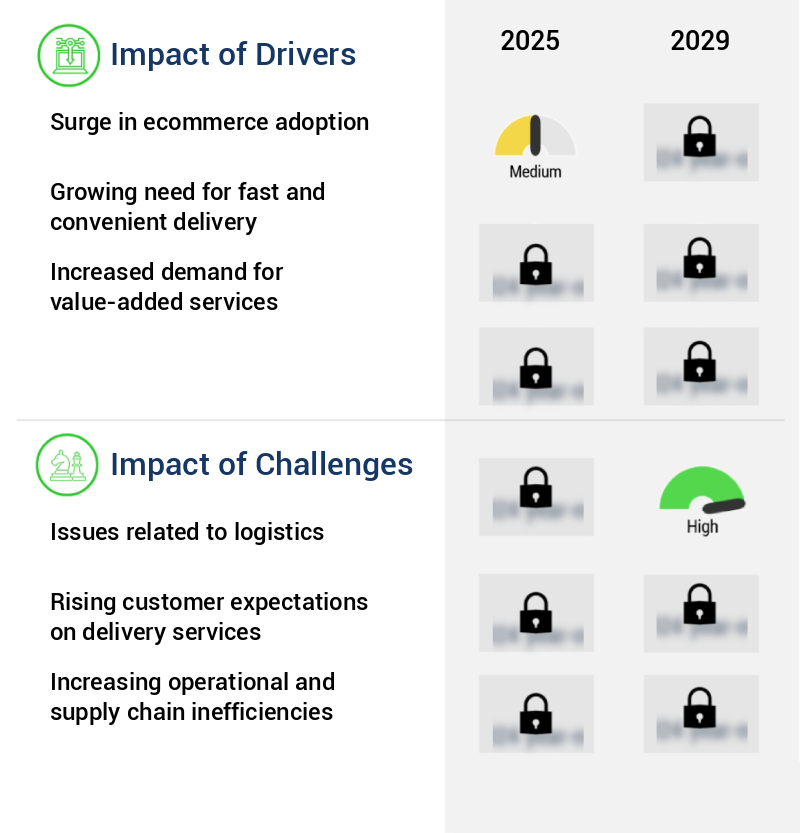
- The surge in ecommerce adoption serves as the primary catalyst for market growth.
- The market is experiencing significant growth due to the continuous rise in online shopping adoption. With more consumers opting for the convenience of purchasing products online, businesses are turning to ecommerce fulfillment providers to keep up with the increased order volume and complexity. According to recent studies, ecommerce sales are projected to account for over 15% of total retail sales by 2025, highlighting the market's potential for businesses. Efficiency and compliance are crucial factors driving the demand for ecommerce fulfillment services. Providers offer scalability and expertise, enabling businesses to streamline their operations and reduce downtime. For instance, one leading ecommerce fulfillment company reported a 30% reduction in order processing time, leading to increased customer satisfaction.
- Moreover, the ability to offer faster shipping and accurate inventory management is a significant competitive advantage for businesses in various industries. In fact, a recent survey revealed that 52% of consumers consider fast shipping to be a crucial factor when shopping online. Ecommerce fulfillment providers help businesses meet these expectations, improving forecast accuracy by up to 18%. In conclusion, the market is a dynamic and exciting space, fueled by shifting consumer preferences and the need for operational efficiency. By partnering with ecommerce fulfillment providers, businesses can stay competitive, meet customer expectations, and focus on their core competencies.
What are the market trends shaping the Ecommerce Fulfillment Service Industry?
- In the realm of ecommerce fulfillment services, the tech-driven transformation is an emerging market trend. This transformation signifies the integration of advanced technology to enhance efficiency and effectiveness.
- The ecommerce fulfillment market is experiencing significant evolution due to technological advancements. Key trends include the implementation of automation and robotics in warehouses, enhancing productivity and efficiency by reducing labor costs and improving accuracy. Artificial intelligence (AI) is another transformative force, optimizing inventory management, route planning, and delivery schedules, resulting in reduced stockouts, faster deliveries, and an enhanced customer experience. Big data analytics plays a crucial role by providing valuable insights from ecommerce platforms and fulfillment operations, enabling informed decisions regarding warehouse locations, resource allocation, and customer experience enhancement.
- These trends contribute to essential business outcomes, such as downtime reduction by up to 30% and forecast accuracy improvement by approximately 18%.
What challenges does the Ecommerce Fulfillment Service Industry face during its growth?
- The growth of the industry is significantly impacted by the complex challenges in logistics, encompassing areas such as transportation, inventory management, and supply chain optimization.
- Ecommerce fulfillment services have become an essential component of modern business operations, addressing the complexities of managing inventory, processing returns, and ensuring swift delivery to meet customer expectations. The market is characterized by its evolving nature, with key applications including inventory management, order processing, and logistics coordination. According to recent studies, the number of ecommerce buyers worldwide is projected to reach 2.14 billion in 2021, emphasizing the importance of streamlined and efficient fulfillment solutions. Logistical challenges, such as managing stock levels across multiple warehouses and handling product returns, add complexity to the ecommerce fulfillment landscape. Labor shortages and rising wages further complicate matters, making it crucial for businesses to find and retain skilled workers for picking and packing tasks.
- Integrating diverse systems, from ecommerce platforms to logistics partners, demands technical expertise and can be a time-consuming process. To stay competitive, ecommerce businesses must continually innovate and refine their fulfillment strategies. Meeting customer demands for fast and transparent delivery is a constant challenge, with providers seeking to optimize their operations and reduce delivery times.
Exclusive Technavio Analysis on Customer Landscape
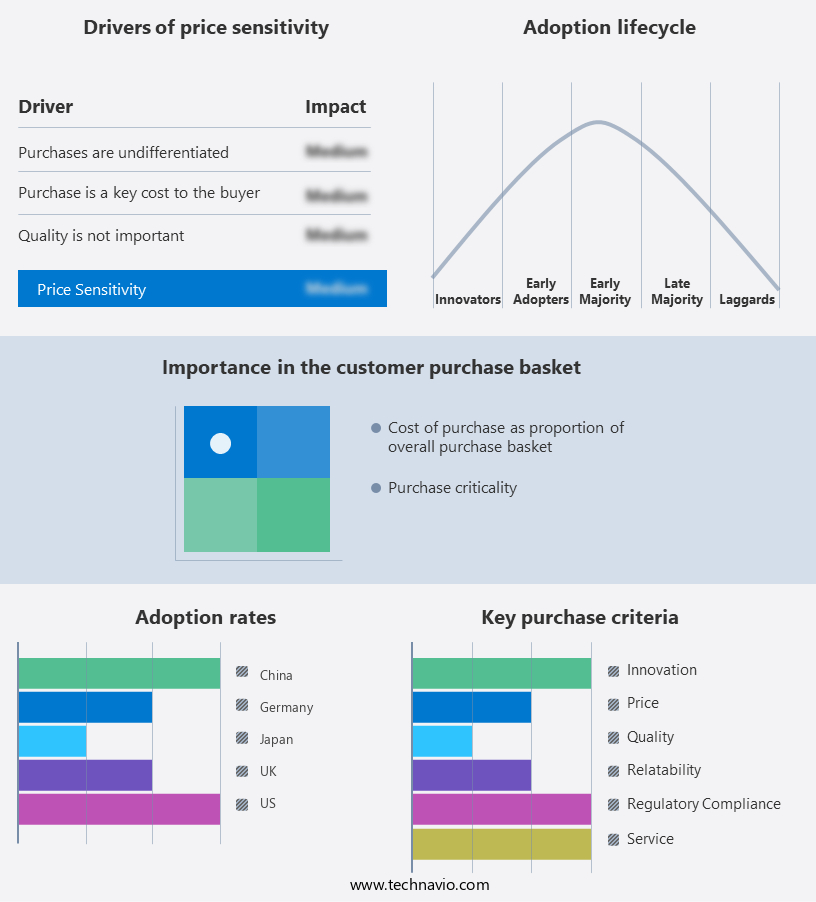
The ecommerce fulfillment service market forecasting report includes the adoption lifecycle of the market, covering from the innovator's stage to the laggard's stage. It focuses on adoption rates in different regions based on penetration. Furthermore, the ecommerce fulfillment service market report also includes key purchase criteria and drivers of price sensitivity to help companies evaluate and develop their market growth analysis strategies.
Customer Landscape of Ecommerce Fulfillment Service Industry
Competitive Landscape
Companies are implementing various strategies, such as strategic alliances, ecommerce fulfillment service market forecast, partnerships, mergers and acquisitions, geographical expansion, and product/service launches, to enhance their presence in the industry.
Amazon.com Inc. - This company specializes in ecommerce fulfillment solutions, providing in-house and outsourced storage options, as well as free delivery to Amazon Prime members. Their services ensure efficient order processing and delivery, enhancing customer satisfaction for online retailers.
The industry research and growth report includes detailed analyses of the competitive landscape of the market and information about key companies, including:
- Amazon.com Inc.
- Boxzooka LLC.
- DHL International GmbH
- eFulfillment Service Inc.
- FedEx Corp.
- Flexe
- GEODIS
- Medallion Enterprises
- Rakuten Group Inc.
- Red Stag Fulfillment LLC
- Ryder System Inc.
- SEKO Logistics
- Shipbob Inc.
- Shipfusion
- ShipMonk
- Shopify Inc.
- Stord
- United Parcel Service Inc.
- Xpert Fulfillment
- XPO Inc.
Qualitative and quantitative analysis of companies has been conducted to help clients understand the wider business environment as well as the strengths and weaknesses of key industry players. Data is qualitatively analyzed to categorize companies as pure play, category-focused, industry-focused, and diversified; it is quantitatively analyzed to categorize companies as dominant, leading, strong, tentative, and weak.
Recent Development and News in Ecommerce Fulfillment Service Market
- In January 2024, Amazon Fulfillment Services announced the launch of its new robotic fulfillment center in Reno, Nevada, increasing its automated capacity by 50% and creating over 1,000 new jobs (Amazon PR).
- In March 2024, UPS and FedEx signed a strategic partnership to expand their collaborative ecommerce fulfillment services, enabling both companies to offer more comprehensive solutions to small and medium-sized businesses (UPS Press Release).
- In May 2025, DHL Supply Chain completed the acquisition of Blue Ridge Global, a leading provider of supply chain planning and execution software, enhancing its technology capabilities and expanding its presence in the North American market (DHL Press Release).
- In September 2025, the European Union introduced new regulations requiring ecommerce sellers to collect and remit VAT taxes for sales below €150, significantly impacting the ecommerce fulfillment market and forcing many companies to reassess their European operations (EU Commission Press Release).
Dive into Technavio's robust research methodology, blending expert interviews, extensive data synthesis, and validated models for unparalleled Ecommerce Fulfillment Service Market insights. See full methodology.
|
Market Scope |
|
|
Report Coverage |
Details |
|
Page number |
226 |
|
Base year |
2024 |
|
Historic period |
2019-2023 |
|
Forecast period |
2025-2029 |
|
Growth momentum & CAGR |
Accelerate at a CAGR of 18.4% |
|
Market growth 2025-2029 |
USD 233.4 billion |
|
Market structure |
Fragmented |
|
YoY growth 2024-2025(%) |
16.6 |
|
Key countries |
UK, Brazil, China, US, Canada, France, South Korea, Japan, Germany, and India |
|
Competitive landscape |
Leading Companies, Market Positioning of Companies, Competitive Strategies, and Industry Risks |
Research Analyst Overview
- The market continues to evolve, driven by the ever-growing demand for swift and efficient delivery solutions. Warehouse space optimization and inventory optimization strategies are at the forefront of this evolution, with predictive analytics logistics playing a crucial role in optimizing stock levels and reducing carrying costs. Automated picking systems and reverse logistics processes streamline operations, while shipping label generation and on-time delivery rates ensure customer satisfaction. Returns processing efficiency is another critical aspect, with warehouse layout design and multi-channel order fulfillment enabling seamless handling of returns. Last-mile delivery solutions, order management platforms, and cross-docking operations further enhance the efficiency of the fulfillment process.
- Fulfillment center automation, order fulfillment software, and third-party logistics providers continue to innovate, integrating international shipping logistics, real-time order tracking, robotics in warehousing, and ai-powered order routing. Inventory turnover rates and fulfillment cycle time are key performance indicators, with industry growth expectations projected at 12% annually. For instance, a leading e-commerce retailer reported a 30% increase in sales due to optimized warehouse management system and packaging optimization techniques. Delivery route optimization, drop shipping integration, shipping cost reduction, and inventory management techniques are additional areas of focus, ensuring a competitive edge in the dynamic ecommerce landscape.
What are the Key Data Covered in this Ecommerce Fulfillment Service Market Research and Growth Report?
-
What is the expected growth of the Ecommerce Fulfillment Service Market between 2025 and 2029?
-
USD 233.4 billion, at a CAGR of 18.4%
-
-
What segmentation does the market report cover?
-
The report is segmented by Service (Shipping fulfillment, Warehousing and storage fulfillment, Bundling fulfillment, and Others), Retail Channel (B2B and B2C), Application (Apparel and footwear, Consumer electronics, Home and kitchen, Sports and leisure, and Others), Business Segment (Large enterprises and SMEs), and Geography (APAC, North America, Europe, Middle East and Africa, and South America)
-
-
Which regions are analyzed in the report?
-
APAC, North America, Europe, Middle East and Africa, and South America
-
-
What are the key growth drivers and market challenges?
-
Surge in ecommerce adoption, Issues related to logistics
-
-
Who are the major players in the Ecommerce Fulfillment Service Market?
-
Amazon.com Inc., Boxzooka LLC., DHL International GmbH, eFulfillment Service Inc., FedEx Corp., Flexe, GEODIS, Medallion Enterprises, Rakuten Group Inc., Red Stag Fulfillment LLC, Ryder System Inc., SEKO Logistics, Shipbob Inc., Shipfusion, ShipMonk, Shopify Inc., Stord, United Parcel Service Inc., Xpert Fulfillment, and XPO Inc.
-
Market Research Insights
- The market continues to expand and adapt, driven by the increasing demand for efficient and reliable order processing and delivery. According to industry reports, the market is projected to grow by over 15% annually, with customer service metrics such as order processing speed and delivery time windows becoming crucial differentiators. For instance, a leading retailer reported a 20% increase in sales following the implementation of advanced order routing algorithms and automated sorting systems.
- These technologies enable faster and more accurate order processing, resulting in improved customer satisfaction. Additionally, sustainability logistics, including carbon footprint reduction and warehouse safety protocols, are gaining importance as consumers become more environmentally conscious.
We can help! Our analysts can customize this ecommerce fulfillment service market research report to meet your requirements.
 RIA -
RIA - 
