Elderberry Market Analysis, Size, and Forecast 2026-2030: Europe (Germany, UK, and France), North America (US, Canada, and Mexico), APAC (China, Japan, and India), South America (Brazil and Argentina), Middle East and Africa (Saudi Arabia, UAE, and South Africa), and Rest of World (ROW)

Elderberry Market Analysis, Size, and Forecast 2026-2030:
Europe (Germany, UK, and France), North America (US, Canada, and Mexico), APAC (China, Japan, and India), South America (Brazil and Argentina), Middle East and Africa (Saudi Arabia, UAE, and South Africa), and Rest of World (ROW)

Published: Mar 2026 302 Pages SKU: IRTNTR44935

Market Overview at a Glance

$384.8 Mn
Market Opportunity
7.8%
CAGR 2025 - 2030
42.6%
North America Growth
$525.6 Mn
Health and wellness segment 2024

Elderberry Market Size 2026-2030

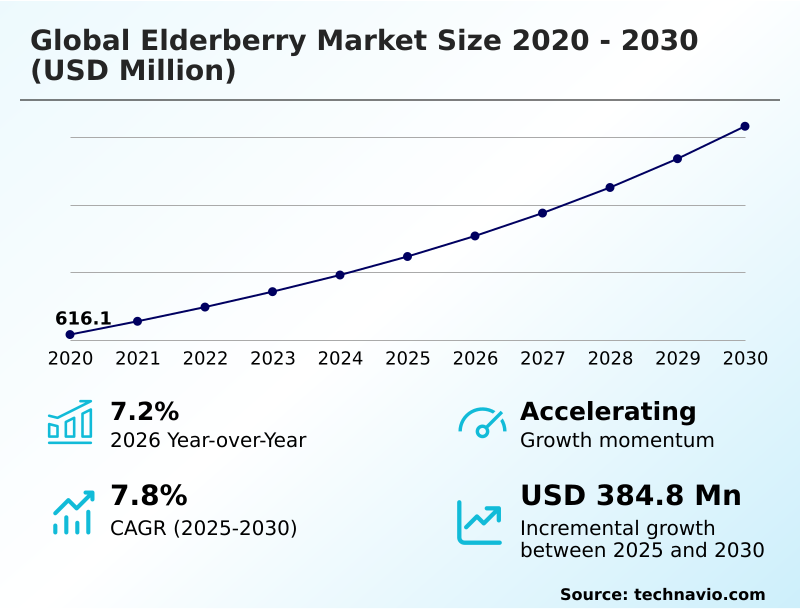
The elderberry market size is valued to increase by USD 384.8 million, at a CAGR of 7.8% from 2025 to 2030. Growing consumer preference for natural immune modulation will drive the elderberry market.

Major Market Trends & Insights

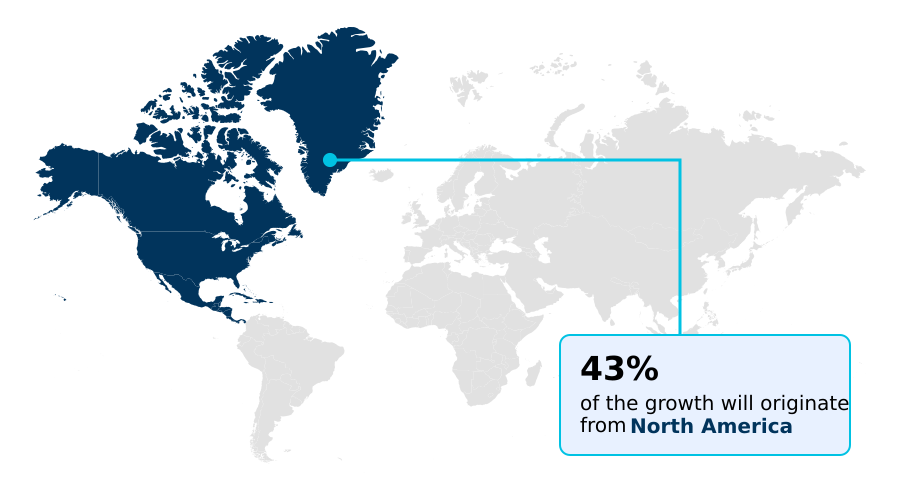
  • North America dominated the market and accounted for a 42.6% growth during the forecast period.
  • By Application - Health and wellness segment was valued at USD 525.6 million in 2024
  • By Distribution Channel - Offline segment accounted for the largest market revenue share in 2024

Market Size & Forecast

  • Market Opportunities: USD 615.4 million
  • Market Future Opportunities: USD 384.8 million
  • CAGR from 2025 to 2030 : 7.8%

Market Summary

  • The elderberry market is defined by a strong consumer shift toward preventive wellness and natural ingredients. Growth is fueled by the demand for clean label ingredients and products that offer immune support, moving elderberry from a seasonal remedy to a daily dietary supplement.
  • This trend is visible in its expanding applications beyond traditional capsules into functional foods, beverages, and even cosmetics. However, the industry navigates significant challenges in maintaining supply chain transparency and consistency.
  • For instance, a manufacturer aiming for GMP-certified production must balance the high cost of ethically sourced, standardized extracts against market price pressures, all while managing the risks of agricultural volatility in primary growing regions.
  • Success hinges on robust sourcing strategies and investment in advanced extraction technologies that guarantee product potency and purity, meeting the expectations of an increasingly educated consumer base. As the market matures, the ability to validate health benefits through scientific backing will be crucial for sustaining consumer trust and driving further growth.

What will be the Size of the Elderberry Market during the forecast period?

Get Key Insights on Market Forecast (PDF) Request Free Sample

How is the Elderberry Market Segmented?

The elderberry industry research report provides comprehensive data (region-wise segment analysis), with forecasts and estimates in "USD million" for the period 2026-2030, as well as historical data from 2020-2024 for the following segments.
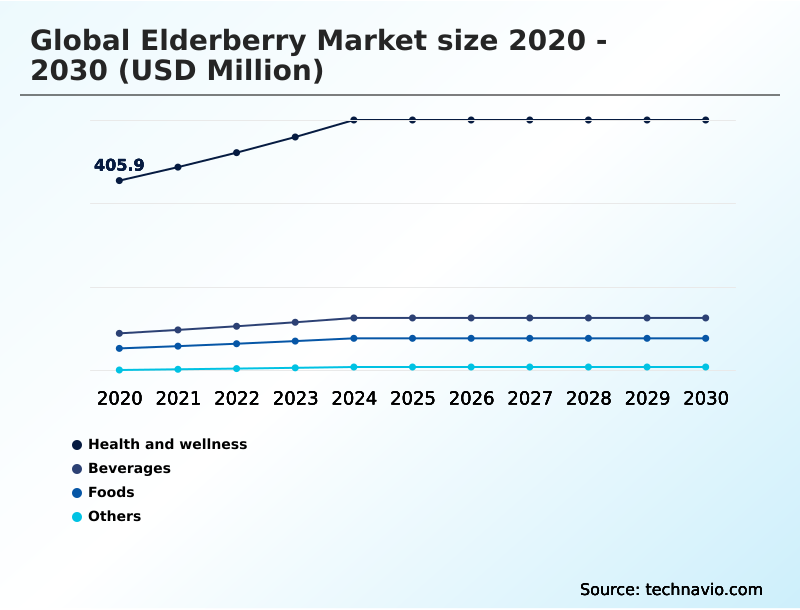
  • Application
    • Health and wellness
    • Beverages
    • Foods
    • Others
  • Distribution channel
    • Offline
    • Online
  • Form factor
    • Powder
    • Liquid
    • Capsules and tablets
    • Dried berries
  • Geography
    • Europe
      • Germany
      • UK
      • France
    • North America
      • US
      • Canada
      • Mexico
    • APAC
      • China
      • Japan
      • India
    • South America
      • Brazil
      • Argentina
    • Middle East and Africa
      • Saudi Arabia
      • UAE
      • South Africa
    • Rest of World (ROW)

By Application Insights

The health and wellness segment is estimated to witness significant growth during the forecast period.

The health and wellness segment is expanding as proactive health management becomes a priority. Demand is driven by products that support natural immune modulation and offer antioxidant protection.

This includes a variety of immune support supplements, from pediatric supplement formulations to options for adults.

The segment’s growth is significant, with North America alone poised to contribute 42.6% of the market's incremental growth, reflecting strong consumer interest in preventive healthcare botanicals.

Key offerings feature organic juice concentrates and whole food based supplements, which align with the clean label trend. The application of sambucus nigra extracts is central to creating effective phytotherapy based products that consumers trust for their daily wellness routines.

Request Free Sample

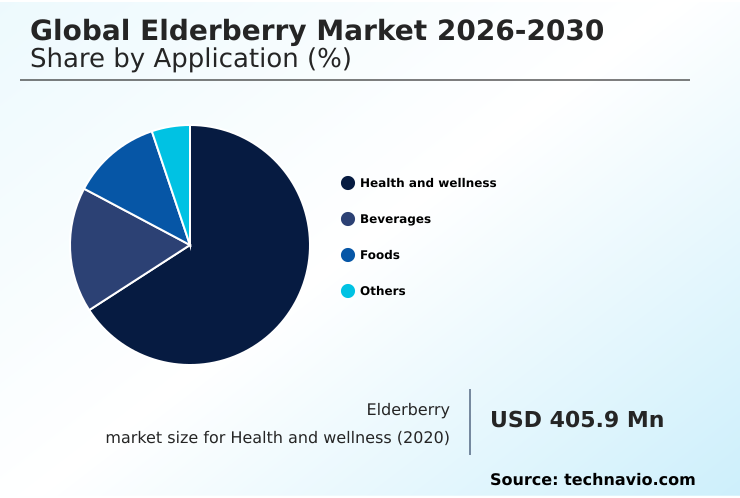
The Health and wellness segment was valued at USD 525.6 million in 2024 and showed a gradual increase during the forecast period.

Request Free Sample

Regional Analysis

North America is estimated to contribute 42.6% to the growth of the global market during the forecast period.Technavio’s analysts have elaborately explained the regional trends and drivers that shape the market during the forecast period.

See How Elderberry Market Demand is Rising in North America Request Free Sample

The global elderberry market exhibits distinct regional dynamics, with North America and Europe collectively representing over 83% of the incremental growth opportunity.

Europe remains a stronghold, driven by deep-rooted traditions in traditional herbal medicine and a mature market for phytotherapy-based products. This region excels in producing organic certified raw materials and is a hub for innovations in cosmetic ingredient integration.

North America, conversely, is characterized by rapid consumer adoption and high demand for convenient seasonal wellness products and pet immune support.

APAC is an emerging market where localization strategies, such as creating ayurvedic health formulations and herbal tea infusions, are critical for gaining traction.

In all regions, there is a growing emphasis on high-purity extraction and developing holistic wellness solutions that resonate with local health priorities.

Market Dynamics

Our researchers analyzed the data with 2025 as the base year, along with the key drivers, trends, and challenges. A holistic analysis of drivers will help companies refine their marketing strategies to gain a competitive advantage.

  • A comprehensive view of the global elderberry market 2026-2030 reveals a multi-faceted industry driven by specific applications and consumer demands. The role of the global elderberry market 2026-2030 for immune support remains its primary function, with a strong presence in the health and wellness segment.
  • Its use is rapidly expanding, with the global elderberry market 2026-2030 in functional beverages becoming a major growth area. In parallel, the application of the global elderberry market 2026-2030 for natural food coloring is gaining traction among food manufacturers seeking clean-label alternatives. A newer, high-potential frontier is the global elderberry market 2026-2030 in skincare and cosmetics.
  • Operationally, global elderberry market 2026-2030 supply chain challenges, particularly related to climate and logistics, are a key boardroom concern. Firms focusing on global elderberry market 2026-2030 extraction technology advancements have reported nearly double the efficiency in preserving active compounds. Navigating global elderberry market 2026-2030 regulatory compliance trends is another critical factor.
  • The interest in global elderberry market 2026-2030 and synergistic formulations is pushing product innovation. Analysis of the global elderberry market 2026-2030 vendor landscape analysis shows a competitive but fragmented space. Key global elderberry market 2026-2030 market trends and opportunities are emerging from this competition.
  • A deep dive into the global elderberry market 2026-2030 vs alternative immune boosters highlights the need for clear differentiation. Ultimately, understanding consumer preferences, market drivers, and challenges is essential for any stakeholder. The market is not monolithic, with distinct dynamics in North America and Europe, and in applications for health and wellness, food, and the beverage industry.

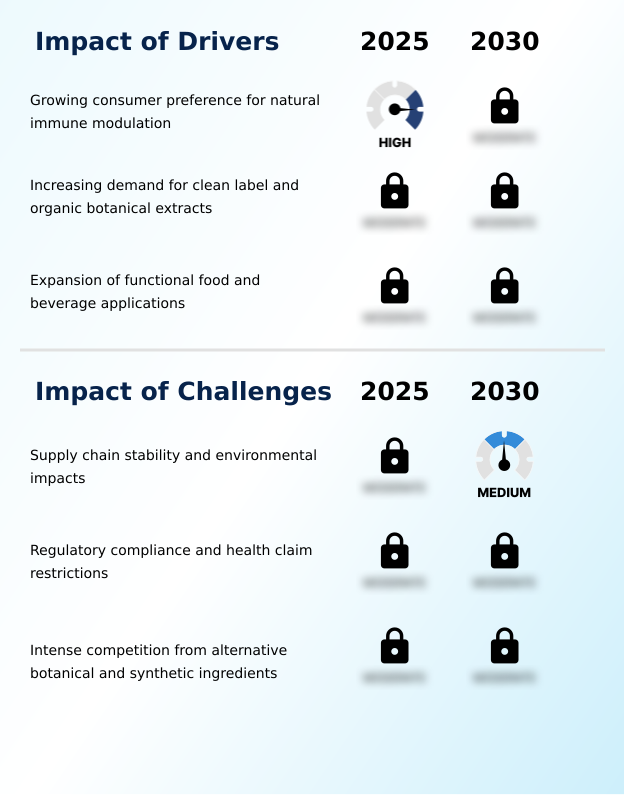
What are the key market drivers leading to the rise in the adoption of Elderberry Industry?

  • The market is propelled by a growing consumer preference for natural immune modulation, as individuals increasingly seek plant-based alternatives for proactive health management.

  • Market growth is primarily driven by consumer demand for natural and transparent products.
  • The preference for clean label ingredients is a significant factor, with products featuring non-GMO certified extracts and transparent ethical sourcing practices commanding up to a 15% price premium.
  • This trend is fueling the adoption of elderberry as a natural food colorant and natural flavor enhancer in confectionery and baking inclusions.
  • Simultaneously, the expansion of distribution channels has been pivotal, as online platforms have accelerated growth by 7.2% by improving access to artisanal syrup production and specialized herbal remedies for colds.
  • The ingredient’s versatility is further highlighted by its increasing use in dairy product additives and as a dietary fiber enrichment, meeting the needs of consumers focused on functional nutrition.

What are the market trends shaping the Elderberry Industry?

  • The market is shaped by the growing development of synergistic health formulations combining elderberry with other botanicals and minerals. This shift meets consumer demand for comprehensive, multi-functional wellness products.

  • Key market trends are centered on product sophistication and diversification. The development of synergistic vitamin blends and complex formulations targeting respiratory wellness support is accelerating, with such products demonstrating a 25% higher consumer retention rate compared to single-ingredient supplements. This shift is driving demand for versatile botanical antioxidant sourcing. Furthermore, the market is expanding beyond traditional supplements into new categories.
  • The successful use of elderberry for inner beauty applications and as an anti-aging skincare active has opened a new segment representing 10% of total ingredient sales for some specialized suppliers. This diversification is supported by advancements in producing food-grade antioxidants suitable for topical use.
  • These trends reflect a strategic move toward creating high-value, multi-functional products that cater to a holistic view of health.

What challenges does the Elderberry Industry face during its growth?

  • A key industry challenge is ensuring supply chain stability and mitigating environmental impacts, which can affect raw material availability, quality, and cost.

  • The market faces considerable challenges related to supply chain volatility and stringent regulatory oversight. Unpredictable agricultural yields can cause raw material price spikes of over 30%, impacting the cost of bulk powder ingredients and creating production bottlenecks for throat support lozenges and other popular items.
  • This instability complicates efforts to maintain a consistent supply for effervescent tablet formulation and gummy supplement manufacturing. On the regulatory front, navigating health claim restrictions is a significant hurdle. The cost of maintaining compliance and securing approvals for new formulations has increased by 15% in some regions, slowing down innovation in areas like personalized nutrition components.
  • These operational and regulatory pressures demand resilient sourcing strategies and significant investment in clinical validation to substantiate product benefits and maintain market access.

Exclusive Technavio Analysis on Customer Landscape

The elderberry market forecasting report includes the adoption lifecycle of the market, covering from the innovator’s stage to the laggard’s stage. It focuses on adoption rates in different regions based on penetration. Furthermore, the elderberry market report also includes key purchase criteria and drivers of price sensitivity to help companies evaluate and develop their market growth analysis strategies.

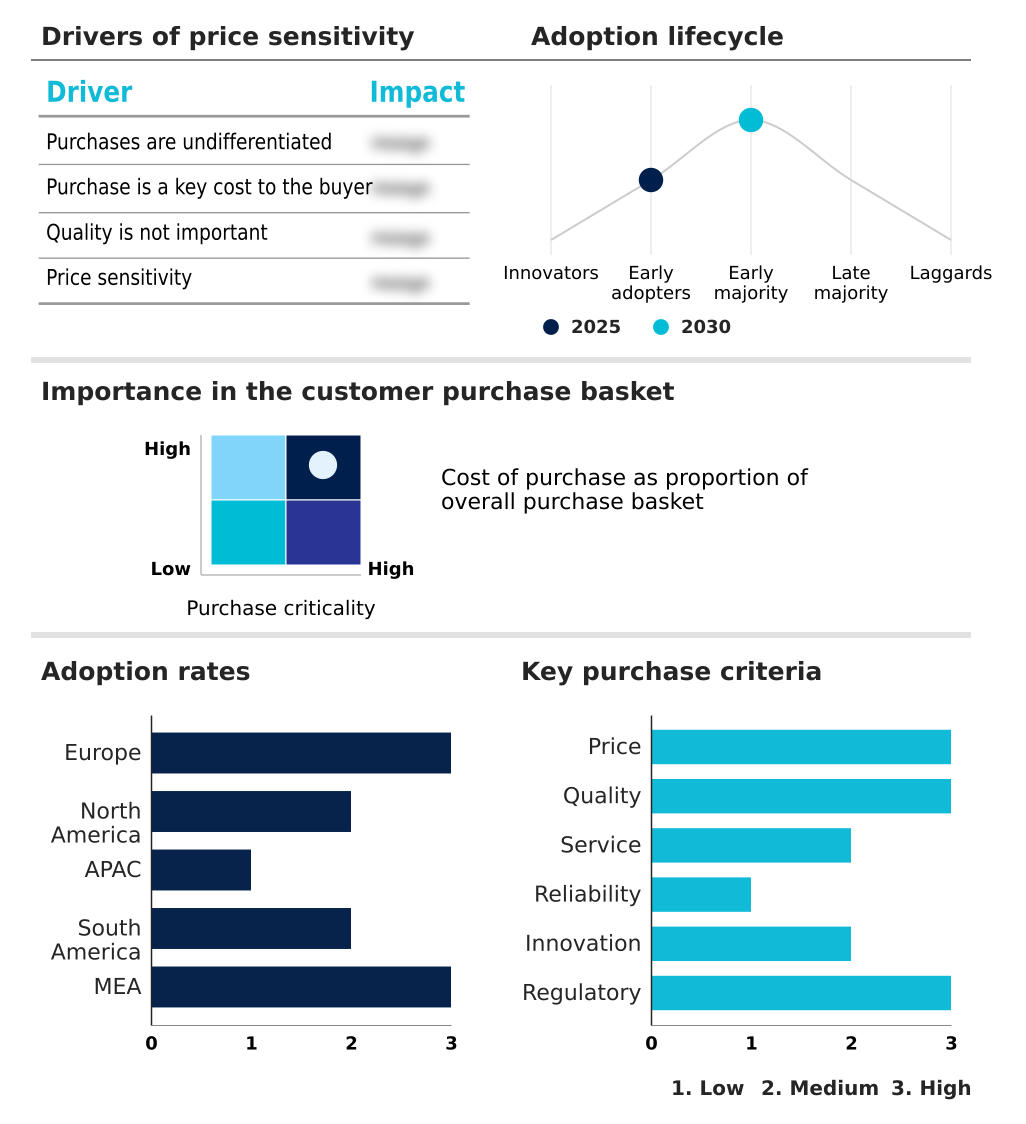
Customer Landscape of Elderberry Industry

Competitive Landscape

Companies are implementing various strategies, such as strategic alliances, elderberry market forecast, partnerships, mergers and acquisitions, geographical expansion, and product/service launches, to enhance their presence in the industry.

Artemis International Inc. - Offerings focus on standardized elderberry extracts and bulk powder ingredients, catering to nutraceutical and functional food manufacturing sectors for enhanced product formulation.

The industry research and growth report includes detailed analyses of the competitive landscape of the market and information about key companies, including:

  • Artemis International Inc.
  • Bluebonnet Nutrition Corp.
  • Gaia Herbs Inc.
  • Honest Elderberry Co.
  • Innovative Natural Solutions
  • Jarrow Formulas Inc.
  • Lifeway Foods Inc.
  • Monterey Bay Herb Co.
  • Mountain Rose Herbs
  • Norms Farms
  • NOW Health Group Inc.
  • Paradise Herbs And Essentials
  • Persimmon Hill Farm
  • Pharmacare US Inc.
  • Procter and Gamble Co.
  • Ransom Naturals Ltd.
  • River Hills Harvest
  • SMP Nutra
  • The Elderberry Co.
  • Unilever PLC

Qualitative and quantitative analysis of companies has been conducted to help clients understand the wider business environment as well as the strengths and weaknesses of key industry players. Data is qualitatively analyzed to categorize companies as pure play, category-focused, industry-focused, and diversified; it is quantitatively analyzed to categorize companies as dominant, leading, strong, tentative, and weak.

Recent Development and News in Elderberry market

  • In August 2024, Naturex introduced a sustainability initiative focused on the ethical sourcing of elderberries from small-scale farmers in Central Europe to enhance supply chain transparency.
  • In October 2024, Symrise AG launched a specialized range of berry extracts utilizing advanced cold press technology to preserve the fruit's nutritional profile without using chemical solvents.
  • In January 2025, Givaudan announced a new extraction method to improve the color stability of elderberry juice in high-heat applications like baking and confectionery.
  • In March 2025, Kerry Group Deutschland GmbH released a series of elderberry-infused beverage bases for the ready-to-drink market, targeting consumers who prefer functional health shots and sparkling waters.

Dive into Technavio’s robust research methodology, blending expert interviews, extensive data synthesis, and validated models for unparalleled Elderberry Market insights. See full methodology.

Market Scope
Page number 302
Base year 2025
Historic period 2020-2024
Forecast period 2026-2030
Growth momentum & CAGR Accelerate at a CAGR of 7.8%
Market growth 2026-2030 USD 384.8 million
Market structure Fragmented
YoY growth 2025-2026(%) 7.2%
Key countries Germany, UK, France, Italy, Spain, The Netherlands, US, Canada, Mexico, China, Japan, India, South Korea, Australia, Indonesia, Brazil, Argentina, Chile, Saudi Arabia, UAE, South Africa, Israel and Turkey
Competitive landscape Leading Companies, Market Positioning of Companies, Competitive Strategies, and Industry Risks

Request Free Sample

Research Analyst Overview

  • The elderberry market's evolution is anchored in sophisticated processing and formulation science. The journey from sourcing organic certified raw materials to delivering finished goods involves critical investments in high-purity extraction techniques like membrane filtration processing and solvent-free extraction.
  • A key boardroom decision revolves around adopting these advanced methods to ensure bioactive compound consistency and meet stringent regulatory demands for standardized active compounds. Advanced extraction methods have improved anthocyanin retention by over 20%, a significant factor for nutraceutical ingredient validation. This commitment to quality is verified through high-performance liquid chromatography.
  • The market is also diversifying beyond dietary supplement manufacturing into functional food formulation, where natural color stability is paramount. Innovations include plant-based bioactives for probiotic beverage infusion and functional snack ingredients. Furthermore, the push for synergistic health blends and holistic wellness solutions is driving the development of complex herbal remedy formulations and liposomal delivery systems.
  • Applications are expanding into inner beauty and cosmetic ingredient integration, utilizing food-grade antioxidants for their anti-inflammatory properties. This requires adherence to GMP-certified production and ethical sourcing practices to maintain supply chain transparency. From Sambucus nigra extracts used in traditional herbal medicine to advanced phytotherapy-based products, the focus on quality and efficacy remains constant.

What are the Key Data Covered in this Elderberry Market Research and Growth Report?

  • What is the expected growth of the Elderberry Market between 2026 and 2030?

    • USD 384.8 million, at a CAGR of 7.8%

  • What segmentation does the market report cover?

    • The report is segmented by Application (Health and wellness, Beverages, Foods, and Others), Distribution Channel (Offline, and Online), Form Factor (Powder, Liquid, Capsules and tablets, and Dried berries) and Geography (Europe, North America, APAC, South America, Middle East and Africa)

  • Which regions are analyzed in the report?

    • Europe, North America, APAC, South America and Middle East and Africa

  • What are the key growth drivers and market challenges?

    • Growing consumer preference for natural immune modulation, Supply chain stability and environmental impacts

  • Who are the major players in the Elderberry Market?

    • Artemis International Inc., Bluebonnet Nutrition Corp., Gaia Herbs Inc., Honest Elderberry Co., Innovative Natural Solutions, Jarrow Formulas Inc., Lifeway Foods Inc., Monterey Bay Herb Co., Mountain Rose Herbs, Norms Farms, NOW Health Group Inc., Paradise Herbs And Essentials, Persimmon Hill Farm, Pharmacare US Inc., Procter and Gamble Co., Ransom Naturals Ltd., River Hills Harvest, SMP Nutra, The Elderberry Co. and Unilever PLC

Market Research Insights

  • The market's momentum is sustained by evolving consumer preferences for functional ingredients. The adoption of clean-label standards correlates with a 15% increase in consumer loyalty, as transparency in sourcing and production becomes a key differentiator.
  • The integration of elderberry as a functional beverage additive and natural flavor enhancer has expanded its market reach by over 25%, particularly in the health-conscious millennial demographic. This diversification into new formats like plant-based wellness shots and fermented health drinks showcases the ingredient's versatility.
  • Furthermore, the use of elderberry in private label nutraceuticals is growing, with retailers achieving higher margins compared to branded alternatives. These dynamics underscore the shift from simple supplements to integrated wellness solutions.

We can help! Our analysts can customize this elderberry market research report to meet your requirements.

Get in touch

1. Executive Summary

1.1 Market overview

Executive Summary - Chart on Market Overview
Executive Summary - Data Table on Market Overview
Executive Summary - Chart on Global Market Characteristics
Executive Summary - Chart on Market by Geography
Executive Summary - Chart on Market Segmentation by Application
Executive Summary - Chart on Market Segmentation by Distribution Channel
Executive Summary - Chart on Market Segmentation by Form Factor
Executive Summary - Chart on Incremental Growth
Executive Summary - Data Table on Incremental Growth
Executive Summary - Chart on Company Market Positioning

2. Technavio Analysis

2.1 Analysis of price sensitivity, lifecycle, customer purchase basket, adoption rates, and purchase criteria

2.2 Criticality of inputs and Factors of differentiation

Chart on Overview on criticality of inputs and factors of differentiation

2.3 Factors of disruption

Chart on Overview on factors of disruption

2.4 Impact of drivers and challenges

Chart on Impact of drivers and challenges in 2025 and 2030

3. Market Landscape

3.1 Market ecosystem

Chart on Parent Market
Data Table on - Parent Market

3.2 Market characteristics

Chart on Market characteristics analysis

3.3 Value chain analysis

Chart on Value chain analysis

4. Market Sizing

4.1 Market definition

Data Table on Offerings of companies included in the market definition

4.2 Market segment analysis

Market segments

4.3 Market size 2025

4.4 Market outlook: Forecast for 2025-2030

Chart on Global - Market size and forecast 2025-2030 ($ million)
Data Table on Global - Market size and forecast 2025-2030 ($ million)
Chart on Global Market: Year-over-year growth 2025-2030 (%)
Data Table on Global Market: Year-over-year growth 2025-2030 (%)

5. Historic Market Size

5.1 Global Elderberry Market 2020 - 2024

Historic Market Size - Data Table on Global Elderberry Market 2020 - 2024 ($ million)

5.2 Application segment analysis 2020 - 2024

Historic Market Size - Application Segment 2020 - 2024 ($ million)

5.3 Distribution Channel segment analysis 2020 - 2024

Historic Market Size - Distribution Channel Segment 2020 - 2024 ($ million)

5.4 Form Factor segment analysis 2020 - 2024

Historic Market Size - Form Factor Segment 2020 - 2024 ($ million)

5.5 Geography segment analysis 2020 - 2024

Historic Market Size - Geography Segment 2020 - 2024 ($ million)

5.6 Country segment analysis 2020 - 2024

Historic Market Size - Country Segment 2020 - 2024 ($ million)

6. Qualitative Analysis

6.1 Impact of AI on Global Elderberry Market

7. Five Forces Analysis

7.1 Five forces summary

Five forces analysis - Comparison between 2025 and 2030

7.2 Bargaining power of buyers

Bargaining power of buyers - Impact of key factors 2025 and 2030

7.3 Bargaining power of suppliers

Bargaining power of suppliers - Impact of key factors in 2025 and 2030

7.4 Threat of new entrants

Threat of new entrants - Impact of key factors in 2025 and 2030

7.5 Threat of substitutes

Threat of substitutes - Impact of key factors in 2025 and 2030

7.6 Threat of rivalry

Threat of rivalry - Impact of key factors in 2025 and 2030

7.7 Market condition

Chart on Market condition - Five forces 2025 and 2030

8. Market Segmentation by Application

8.1 Market segments

Chart on Application - Market share 2025-2030 (%)
Data Table on Application - Market share 2025-2030 (%)

8.2 Comparison by Application

Chart on Comparison by Application
Data Table on Comparison by Application

8.3 Health and wellness - Market size and forecast 2025-2030

Chart on Health and wellness - Market size and forecast 2025-2030 ($ million)
Data Table on Health and wellness - Market size and forecast 2025-2030 ($ million)
Chart on Health and wellness - Year-over-year growth 2025-2030 (%)
Data Table on Health and wellness - Year-over-year growth 2025-2030 (%)

8.4 Beverages - Market size and forecast 2025-2030

Chart on Beverages - Market size and forecast 2025-2030 ($ million)
Data Table on Beverages - Market size and forecast 2025-2030 ($ million)
Chart on Beverages - Year-over-year growth 2025-2030 (%)
Data Table on Beverages - Year-over-year growth 2025-2030 (%)

8.5 Foods - Market size and forecast 2025-2030

Chart on Foods - Market size and forecast 2025-2030 ($ million)
Data Table on Foods - Market size and forecast 2025-2030 ($ million)
Chart on Foods - Year-over-year growth 2025-2030 (%)
Data Table on Foods - Year-over-year growth 2025-2030 (%)

8.6 Others - Market size and forecast 2025-2030

Chart on Others - Market size and forecast 2025-2030 ($ million)
Data Table on Others - Market size and forecast 2025-2030 ($ million)
Chart on Others - Year-over-year growth 2025-2030 (%)
Data Table on Others - Year-over-year growth 2025-2030 (%)

8.7 Market opportunity by Application

Market opportunity by Application ($ million)
Data Table on Market opportunity by Application ($ million)

9. Market Segmentation by Distribution Channel

9.1 Market segments

Chart on Distribution Channel - Market share 2025-2030 (%)
Data Table on Distribution Channel - Market share 2025-2030 (%)

9.2 Comparison by Distribution Channel

Chart on Comparison by Distribution Channel
Data Table on Comparison by Distribution Channel

9.3 Offline - Market size and forecast 2025-2030

Chart on Offline - Market size and forecast 2025-2030 ($ million)
Data Table on Offline - Market size and forecast 2025-2030 ($ million)
Chart on Offline - Year-over-year growth 2025-2030 (%)
Data Table on Offline - Year-over-year growth 2025-2030 (%)

9.4 Online - Market size and forecast 2025-2030

Chart on Online - Market size and forecast 2025-2030 ($ million)
Data Table on Online - Market size and forecast 2025-2030 ($ million)
Chart on Online - Year-over-year growth 2025-2030 (%)
Data Table on Online - Year-over-year growth 2025-2030 (%)

9.5 Market opportunity by Distribution Channel

Market opportunity by Distribution Channel ($ million)
Data Table on Market opportunity by Distribution Channel ($ million)

10. Market Segmentation by Form Factor

10.1 Market segments

Chart on Form Factor - Market share 2025-2030 (%)
Data Table on Form Factor - Market share 2025-2030 (%)

10.2 Comparison by Form Factor

Chart on Comparison by Form Factor
Data Table on Comparison by Form Factor

10.3 Powder - Market size and forecast 2025-2030

Chart on Powder - Market size and forecast 2025-2030 ($ million)
Data Table on Powder - Market size and forecast 2025-2030 ($ million)
Chart on Powder - Year-over-year growth 2025-2030 (%)
Data Table on Powder - Year-over-year growth 2025-2030 (%)

10.4 Liquid - Market size and forecast 2025-2030

Chart on Liquid - Market size and forecast 2025-2030 ($ million)
Data Table on Liquid - Market size and forecast 2025-2030 ($ million)
Chart on Liquid - Year-over-year growth 2025-2030 (%)
Data Table on Liquid - Year-over-year growth 2025-2030 (%)

10.5 Capsules and tablets - Market size and forecast 2025-2030

Chart on Capsules and tablets - Market size and forecast 2025-2030 ($ million)
Data Table on Capsules and tablets - Market size and forecast 2025-2030 ($ million)
Chart on Capsules and tablets - Year-over-year growth 2025-2030 (%)
Data Table on Capsules and tablets - Year-over-year growth 2025-2030 (%)

10.6 Dried berries - Market size and forecast 2025-2030

Chart on Dried berries - Market size and forecast 2025-2030 ($ million)
Data Table on Dried berries - Market size and forecast 2025-2030 ($ million)
Chart on Dried berries - Year-over-year growth 2025-2030 (%)
Data Table on Dried berries - Year-over-year growth 2025-2030 (%)

10.7 Market opportunity by Form Factor

Market opportunity by Form Factor ($ million)
Data Table on Market opportunity by Form Factor ($ million)

11. Customer Landscape

11.1 Customer landscape overview

Analysis of price sensitivity, lifecycle, customer purchase basket, adoption rates, and purchase criteria

12. Geographic Landscape

12.1 Geographic segmentation

Chart on Market share by geography 2025-2030 (%)
Data Table on Market share by geography 2025-2030 (%)

12.2 Geographic comparison

Chart on Geographic comparison
Data Table on Geographic comparison

12.3 Europe - Market size and forecast 2025-2030

Chart on Europe - Market size and forecast 2025-2030 ($ million)
Data Table on Europe - Market size and forecast 2025-2030 ($ million)
Chart on Europe - Year-over-year growth 2025-2030 (%)
Data Table on Europe - Year-over-year growth 2025-2030 (%)
Chart on Regional Comparison - Europe
Data Table on Regional Comparison - Europe

12.3.1 Germany - Market size and forecast 2025-2030

Chart on Germany - Market size and forecast 2025-2030 ($ million)
Data Table on Germany - Market size and forecast 2025-2030 ($ million)
Chart on Germany - Year-over-year growth 2025-2030 (%)
Data Table on Germany - Year-over-year growth 2025-2030 (%)

12.3.2 UK - Market size and forecast 2025-2030

Chart on UK - Market size and forecast 2025-2030 ($ million)
Data Table on UK - Market size and forecast 2025-2030 ($ million)
Chart on UK - Year-over-year growth 2025-2030 (%)
Data Table on UK - Year-over-year growth 2025-2030 (%)

12.3.3 France - Market size and forecast 2025-2030

Chart on France - Market size and forecast 2025-2030 ($ million)
Data Table on France - Market size and forecast 2025-2030 ($ million)
Chart on France - Year-over-year growth 2025-2030 (%)
Data Table on France - Year-over-year growth 2025-2030 (%)

12.3.4 Italy - Market size and forecast 2025-2030

Chart on Italy - Market size and forecast 2025-2030 ($ million)
Data Table on Italy - Market size and forecast 2025-2030 ($ million)
Chart on Italy - Year-over-year growth 2025-2030 (%)
Data Table on Italy - Year-over-year growth 2025-2030 (%)

12.3.5 Spain - Market size and forecast 2025-2030

Chart on Spain - Market size and forecast 2025-2030 ($ million)
Data Table on Spain - Market size and forecast 2025-2030 ($ million)
Chart on Spain - Year-over-year growth 2025-2030 (%)
Data Table on Spain - Year-over-year growth 2025-2030 (%)

12.3.6 The Netherlands - Market size and forecast 2025-2030

Chart on The Netherlands - Market size and forecast 2025-2030 ($ million)
Data Table on The Netherlands - Market size and forecast 2025-2030 ($ million)
Chart on The Netherlands - Year-over-year growth 2025-2030 (%)
Data Table on The Netherlands - Year-over-year growth 2025-2030 (%)

12.4 North America - Market size and forecast 2025-2030

Chart on North America - Market size and forecast 2025-2030 ($ million)
Data Table on North America - Market size and forecast 2025-2030 ($ million)
Chart on North America - Year-over-year growth 2025-2030 (%)
Data Table on North America - Year-over-year growth 2025-2030 (%)
Chart on Regional Comparison - North America
Data Table on Regional Comparison - North America

12.4.1 US - Market size and forecast 2025-2030

Chart on US - Market size and forecast 2025-2030 ($ million)
Data Table on US - Market size and forecast 2025-2030 ($ million)
Chart on US - Year-over-year growth 2025-2030 (%)
Data Table on US - Year-over-year growth 2025-2030 (%)

12.4.2 Canada - Market size and forecast 2025-2030

Chart on Canada - Market size and forecast 2025-2030 ($ million)
Data Table on Canada - Market size and forecast 2025-2030 ($ million)
Chart on Canada - Year-over-year growth 2025-2030 (%)
Data Table on Canada - Year-over-year growth 2025-2030 (%)

12.4.3 Mexico - Market size and forecast 2025-2030

Chart on Mexico - Market size and forecast 2025-2030 ($ million)
Data Table on Mexico - Market size and forecast 2025-2030 ($ million)
Chart on Mexico - Year-over-year growth 2025-2030 (%)
Data Table on Mexico - Year-over-year growth 2025-2030 (%)

12.5 APAC - Market size and forecast 2025-2030

Chart on APAC - Market size and forecast 2025-2030 ($ million)
Data Table on APAC - Market size and forecast 2025-2030 ($ million)
Chart on APAC - Year-over-year growth 2025-2030 (%)
Data Table on APAC - Year-over-year growth 2025-2030 (%)
Chart on Regional Comparison - APAC
Data Table on Regional Comparison - APAC

12.5.1 China - Market size and forecast 2025-2030

Chart on China - Market size and forecast 2025-2030 ($ million)
Data Table on China - Market size and forecast 2025-2030 ($ million)
Chart on China - Year-over-year growth 2025-2030 (%)
Data Table on China - Year-over-year growth 2025-2030 (%)

12.5.2 Japan - Market size and forecast 2025-2030

Chart on Japan - Market size and forecast 2025-2030 ($ million)
Data Table on Japan - Market size and forecast 2025-2030 ($ million)
Chart on Japan - Year-over-year growth 2025-2030 (%)
Data Table on Japan - Year-over-year growth 2025-2030 (%)

12.5.3 India - Market size and forecast 2025-2030

Chart on India - Market size and forecast 2025-2030 ($ million)
Data Table on India - Market size and forecast 2025-2030 ($ million)
Chart on India - Year-over-year growth 2025-2030 (%)
Data Table on India - Year-over-year growth 2025-2030 (%)

12.5.4 South Korea - Market size and forecast 2025-2030

Chart on South Korea - Market size and forecast 2025-2030 ($ million)
Data Table on South Korea - Market size and forecast 2025-2030 ($ million)
Chart on South Korea - Year-over-year growth 2025-2030 (%)
Data Table on South Korea - Year-over-year growth 2025-2030 (%)

12.5.5 Australia - Market size and forecast 2025-2030

Chart on Australia - Market size and forecast 2025-2030 ($ million)
Data Table on Australia - Market size and forecast 2025-2030 ($ million)
Chart on Australia - Year-over-year growth 2025-2030 (%)
Data Table on Australia - Year-over-year growth 2025-2030 (%)

12.5.6 Indonesia - Market size and forecast 2025-2030

Chart on Indonesia - Market size and forecast 2025-2030 ($ million)
Data Table on Indonesia - Market size and forecast 2025-2030 ($ million)
Chart on Indonesia - Year-over-year growth 2025-2030 (%)
Data Table on Indonesia - Year-over-year growth 2025-2030 (%)

12.6 South America - Market size and forecast 2025-2030

Chart on South America - Market size and forecast 2025-2030 ($ million)
Data Table on South America - Market size and forecast 2025-2030 ($ million)
Chart on South America - Year-over-year growth 2025-2030 (%)
Data Table on South America - Year-over-year growth 2025-2030 (%)
Chart on Regional Comparison - South America
Data Table on Regional Comparison - South America

12.6.1 Brazil - Market size and forecast 2025-2030

Chart on Brazil - Market size and forecast 2025-2030 ($ million)
Data Table on Brazil - Market size and forecast 2025-2030 ($ million)
Chart on Brazil - Year-over-year growth 2025-2030 (%)
Data Table on Brazil - Year-over-year growth 2025-2030 (%)

12.6.2 Argentina - Market size and forecast 2025-2030

Chart on Argentina - Market size and forecast 2025-2030 ($ million)
Data Table on Argentina - Market size and forecast 2025-2030 ($ million)
Chart on Argentina - Year-over-year growth 2025-2030 (%)
Data Table on Argentina - Year-over-year growth 2025-2030 (%)

12.6.3 Chile - Market size and forecast 2025-2030

Chart on Chile - Market size and forecast 2025-2030 ($ million)
Data Table on Chile - Market size and forecast 2025-2030 ($ million)
Chart on Chile - Year-over-year growth 2025-2030 (%)
Data Table on Chile - Year-over-year growth 2025-2030 (%)

12.7 Middle East and Africa - Market size and forecast 2025-2030

Chart on Middle East and Africa - Market size and forecast 2025-2030 ($ million)
Data Table on Middle East and Africa - Market size and forecast 2025-2030 ($ million)
Chart on Middle East and Africa - Year-over-year growth 2025-2030 (%)
Data Table on Middle East and Africa - Year-over-year growth 2025-2030 (%)
Chart on Regional Comparison - Middle East and Africa
Data Table on Regional Comparison - Middle East and Africa

12.7.1 Saudi Arabia - Market size and forecast 2025-2030

Chart on Saudi Arabia - Market size and forecast 2025-2030 ($ million)
Data Table on Saudi Arabia - Market size and forecast 2025-2030 ($ million)
Chart on Saudi Arabia - Year-over-year growth 2025-2030 (%)
Data Table on Saudi Arabia - Year-over-year growth 2025-2030 (%)

12.7.2 UAE - Market size and forecast 2025-2030

Chart on UAE - Market size and forecast 2025-2030 ($ million)
Data Table on UAE - Market size and forecast 2025-2030 ($ million)
Chart on UAE - Year-over-year growth 2025-2030 (%)
Data Table on UAE - Year-over-year growth 2025-2030 (%)

12.7.3 South Africa - Market size and forecast 2025-2030

Chart on South Africa - Market size and forecast 2025-2030 ($ million)
Data Table on South Africa - Market size and forecast 2025-2030 ($ million)
Chart on South Africa - Year-over-year growth 2025-2030 (%)
Data Table on South Africa - Year-over-year growth 2025-2030 (%)

12.7.4 Israel - Market size and forecast 2025-2030

Chart on Israel - Market size and forecast 2025-2030 ($ million)
Data Table on Israel - Market size and forecast 2025-2030 ($ million)
Chart on Israel - Year-over-year growth 2025-2030 (%)
Data Table on Israel - Year-over-year growth 2025-2030 (%)

12.7.5 Turkey - Market size and forecast 2025-2030

Chart on Turkey - Market size and forecast 2025-2030 ($ million)
Data Table on Turkey - Market size and forecast 2025-2030 ($ million)
Chart on Turkey - Year-over-year growth 2025-2030 (%)
Data Table on Turkey - Year-over-year growth 2025-2030 (%)

12.8 Market opportunity by geography

Market opportunity by geography ($ million)
Data Tables on Market opportunity by geography ($ million)

13. Drivers, Challenges, and Opportunity

13.1 Market drivers

Growing consumer preference for natural immune modulation
Increasing demand for clean label and organic botanical extracts
Expansion of functional food and beverage applications

13.2 Market challenges

Supply chain stability and environmental impacts
Regulatory compliance and health claim restrictions
Intense competition from alternative botanical and synthetic ingredients

13.3 Impact of drivers and challenges

Impact of drivers and challenges in 2025 and 2030

13.4 Market opportunities

Growing development of synergistic health formulations
Advancements in high quality extraction and standardization
Diversification elderberry products into lifestyle and beauty markets

14. Competitive Landscape

14.1 Overview

14.2

Overview on criticality of inputs and factors of differentiation

14.3 Landscape disruption

Overview on factors of disruption

14.4 Industry risks

Impact of key risks on business

15. Competitive Analysis

15.1 Companies profiled

Companies covered

15.2 Company ranking index

15.3 Market positioning of companies

Matrix on companies position and classification

15.4 Artemis International Inc.

Artemis International Inc. - Overview
Artemis International Inc. - Product / Service
Artemis International Inc. - Key offerings
SWOT

15.5 Bluebonnet Nutrition Corp.

Bluebonnet Nutrition Corp. - Overview
Bluebonnet Nutrition Corp. - Product / Service
Bluebonnet Nutrition Corp. - Key offerings
SWOT

15.6 Gaia Herbs Inc.

Gaia Herbs Inc. - Overview
Gaia Herbs Inc. - Product / Service
Gaia Herbs Inc. - Key news
Gaia Herbs Inc. - Key offerings
SWOT

15.7 Honest Elderberry Co.

Honest Elderberry Co. - Overview
Honest Elderberry Co. - Product / Service
Honest Elderberry Co. - Key offerings
SWOT

15.8 Innovative Natural Solutions

Innovative Natural Solutions - Overview
Innovative Natural Solutions - Product / Service
Innovative Natural Solutions - Key offerings
SWOT

15.9 Lifeway Foods Inc.

Lifeway Foods Inc. - Overview
Lifeway Foods Inc. - Product / Service
Lifeway Foods Inc. - Key offerings
SWOT

15.10 Norms Farms

Norms Farms - Overview
Norms Farms - Product / Service
Norms Farms - Key offerings
SWOT

15.11 NOW Health Group Inc.

NOW Health Group Inc. - Overview
NOW Health Group Inc. - Product / Service
NOW Health Group Inc. - Key offerings
SWOT

15.12 Paradise Herbs And Essentials

Paradise Herbs And Essentials - Overview
Paradise Herbs And Essentials - Product / Service
Paradise Herbs And Essentials - Key offerings
SWOT

15.13 Persimmon Hill Farm

Persimmon Hill Farm - Overview
Persimmon Hill Farm - Product / Service
Persimmon Hill Farm - Key offerings
SWOT

15.14 Pharmacare US Inc.

Pharmacare US Inc. - Overview
Pharmacare US Inc. - Product / Service
Pharmacare US Inc. - Key offerings
SWOT

15.15 Procter and Gamble Co.

Procter and Gamble Co. - Overview
Procter and Gamble Co. - Business segments
Procter and Gamble Co. - Key offerings
Procter and Gamble Co. - Segment focus
SWOT

15.16 Ransom Naturals Ltd.

Ransom Naturals Ltd. - Overview
Ransom Naturals Ltd. - Product / Service
Ransom Naturals Ltd. - Key offerings
SWOT

15.17 River Hills Harvest

River Hills Harvest - Overview
River Hills Harvest - Product / Service
River Hills Harvest - Key offerings
SWOT

15.18 Unilever PLC

Unilever PLC - Overview
Unilever PLC - Business segments
Unilever PLC - Key offerings
Unilever PLC - Segment focus
SWOT

16. Appendix

16.1 Scope of the report

Market definition
Objectives
Notes and caveats

16.2 Inclusions and exclusions checklist

Inclusions checklist
Exclusions checklist

16.3 Currency conversion rates for US$

16.4 Research methodology

16.5 Data procurement

Information sources

16.6 Data validation

16.7 Validation techniques employed for market sizing

16.8 Data synthesis

16.9 360 degree market analysis

16.10 List of abbreviations

Research Methodology

Technavio presents a detailed picture of the market by way of study, synthesis, and summation of data from multiple sources. The analysts have presented the various facets of the market with a particular focus on identifying the key industry influencers. The data thus presented is comprehensive, reliable, and the result of extensive research, both primary and secondary.

INFORMATION SOURCES

Primary sources

  • Manufacturers and suppliers
  • Channel partners
  • Industry experts
  • Strategic decision makers

Secondary sources

  • Industry journals and periodicals
  • Government data
  • Financial reports of key industry players
  • Historical data
  • Press releases

DATA ANALYSIS

Data Synthesis

  • Collation of data
  • Estimation of key figures
  • Analysis of derived insights

Data Validation

  • Triangulation with data models
  • Reference against proprietary databases
  • Corroboration with industry experts

REPORT WRITING

Qualitative

  • Market drivers
  • Market challenges
  • Market trends
  • Five forces analysis

Quantitative

  • Market size and forecast
  • Market segmentation
  • Geographical insights
  • Competitive landscape

Interested in this report?

Get your sample now to see our research methodology and insights!

Download Now

Frequently Asked Questions

Elderberry market growth will increase by USD 384.8 million during 2026-2030.

The Elderberry market is expected to grow at a CAGR of 7.8% during 2026-2030.

Elderberry market is segmented by Application (Health and wellness, Beverages, Foods, Others) Distribution channel (Offline, Online) Form factor (Powder, Liquid, Capsules and tablets, Dried berries)

Artemis International Inc., Bluebonnet Nutrition Corp., Gaia Herbs Inc., Honest Elderberry Co., Innovative Natural Solutions, Jarrow Formulas Inc., Lifeway Foods Inc., Monterey Bay Herb Co., Mountain Rose Herbs, Norms Farms, NOW Health Group Inc., Paradise Herbs And Essentials, Persimmon Hill Farm, Pharmacare US Inc., Procter and Gamble Co., Ransom Naturals Ltd., River Hills Harvest, SMP Nutra, The Elderberry Co., Unilever PLC are a few of the key vendors in the Elderberry market.

North America will register the highest growth rate of 42.6% among the other regions. Therefore, the Elderberry market in North America is expected to garner significant business opportunities for the vendors during the forecast period.

Germany, UK, France, Italy, Spain, The Netherlands, US, Canada, Mexico, China, Japan, India, South Korea, Australia, Indonesia, Brazil, Argentina, Chile, Saudi Arabia, UAE, South Africa, Israel, Turkey

  • Growing consumer preference for natural immune modulation is the driving factor this market.

The Elderberry market vendors should focus on grabbing business opportunities from the Application segment as it accounted for the largest market share in the base year.
RIA - Research AI Assistant
Ask RIA