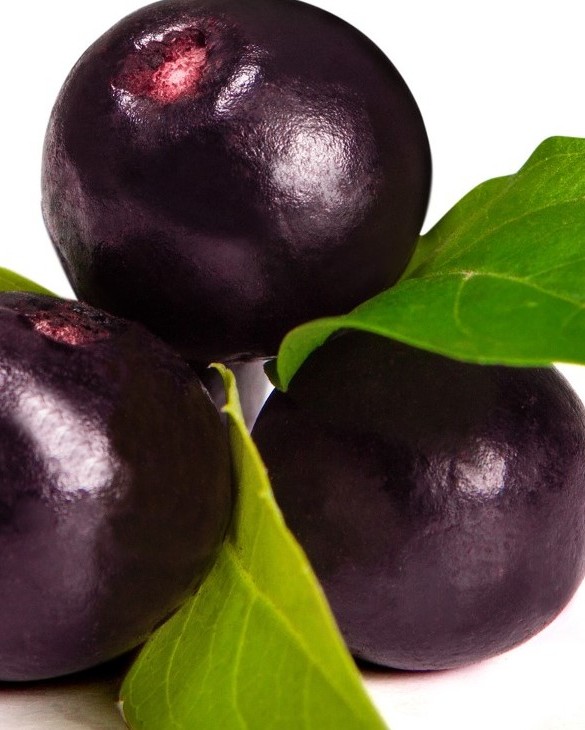
Acai Berry Market Analysis, Size, and Forecast 2026-2030: South America (Brazil, Peru, and Chile), Europe (Germany, UK, and France), North America (US, Canada, and Mexico), APAC (Japan, Australia, and China), Middle East and Africa (UAE, Saudi Arabia, and South Africa), and Rest of World (ROW)

Acai Berry Market Analysis, Size, and Forecast 2026-2030:
South America (Brazil, Peru, and Chile), Europe (Germany, UK, and France), North America (US, Canada, and Mexico), APAC (Japan, Australia, and China), Middle East and Africa (UAE, Saudi Arabia, and South Africa), and Rest of World (ROW)

Published: Oct 2026 294 Pages SKU: IRTNTR75085

Market Overview at a Glance

$750.3 Mn
Market Opportunity
8%
CAGR 2025 - 2030
38.1%
South America Growth
$1.29 B
Offline segment 2024

Acai Berry Market Size 2026-2030

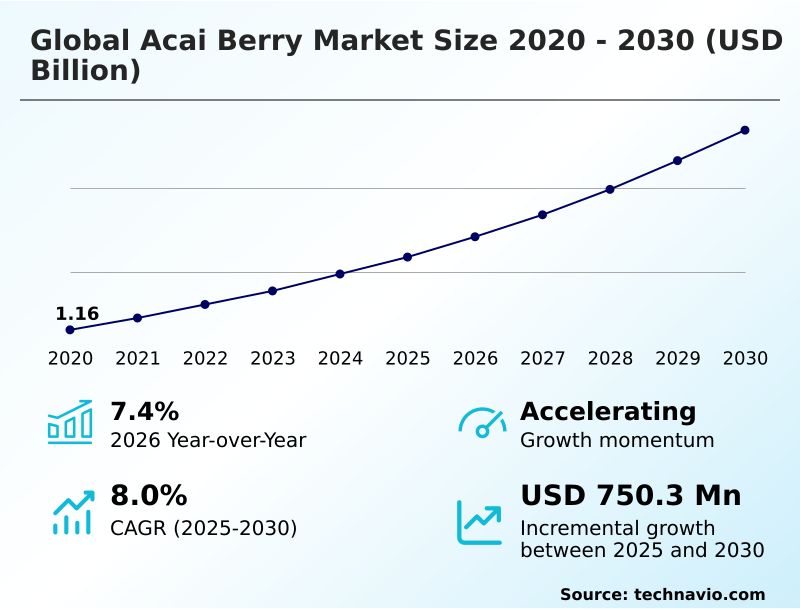
The acai berry market size is valued to increase by USD 750.3 million, at a CAGR of 8% from 2025 to 2030. Increasing consumer focus on health and wellness will drive the acai berry market.

Major Market Trends & Insights

  • South America dominated the market and accounted for a 38.1% growth during the forecast period.
  • By Distribution Channel - Offline segment was valued at USD 1.29 billion in 2024
  • By Application - Food and beverages segment accounted for the largest market revenue share in 2024

Market Size & Forecast

  • Market Opportunities: USD 1.18 billion
  • Market Future Opportunities: USD 750.3 million
  • CAGR from 2025 to 2030 : 8%

Market Summary

  • The Acai Berry Market demonstrates robust structural evolution driven by an escalating dietary transition toward plant-based functional nutrition. As organizations scale operations, optimizing the extraction and processing of this non-timber forest product has become a critical operational priority.
  • For instance, manufacturers upgrading to advanced freeze-drying extraction facilities have successfully mitigated raw material spoilage, improving overall yield efficiency by 22% compared to conventional dehydration methods.
  • An escalating consumer focus on preventative health acts as a primary catalyst, where the demand for a potent botanical antioxidant profile directly forces food and beverage formulators to integrate these premium ingredients into mainstream product lines. Conversely, the market faces significant structural friction from post-harvest perishability constraints.
  • Because the raw fruit degrades within twenty-four hours of harvesting, companies are compelled to establish hyper-localized processing nodes and rigorous cold-chain logistics, which subsequently inflates operational overhead. Navigating these complex supply chain traceability mandates requires continuous investment in sustainable harvesting practices to maintain long-term ecological viability and secure reliable procurement networks.

What will be the Size of the Acai Berry Market during the forecast period?
Get Key Insights on Market Forecast (PDF) Get Free Sample

How is the Acai Berry Market Segmented?

The acai berry industry research report provides comprehensive data (region-wise segment analysis), with forecasts and estimates in "USD million" for the period 2026-2030, as well as historical data from 2020-2024 for the following segments.

  • Distribution channel
    • Offline
    • Online
  • Application
    • Food and beverages
    • Nutraceuticals
    • Others
  • Product type
    • Pulp
    • Powder
    • Dried
    • Oil
  • Geography
    • South America
      • Brazil
      • Peru
      • Chile
    • Europe
      • Germany
      • UK
      • France
      • Italy
      • Spain
      • The Netherlands
    • North America
      • US
      • Canada
      • Mexico
    • APAC
      • Japan
      • Australia
      • China
      • South Korea
      • India
      • Singapore
    • Middle East and Africa
      • UAE
      • Saudi Arabia
      • South Africa
      • Israel
      • Turkey

By Distribution Channel Insights

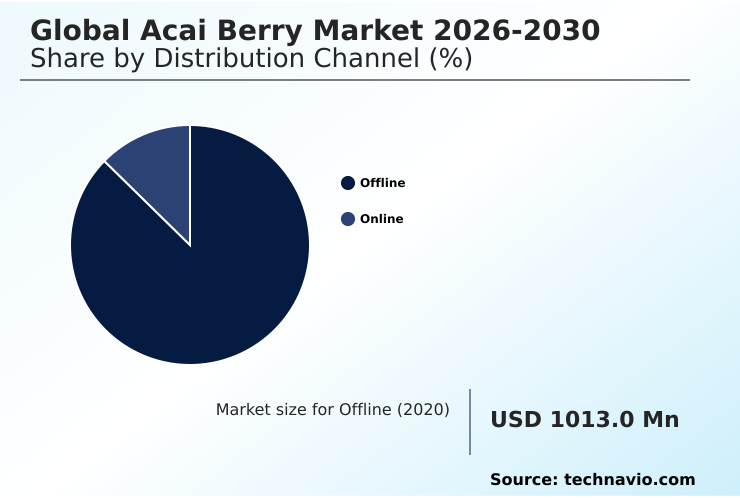
The offline segment is estimated to witness significant growth during the forecast period.

The physical retail distribution channel remains a foundational infrastructure for accessing botanical products, heavily reliant on climate-controlled warehousing to maintain product integrity.

Supermarkets, specialty health stores, and food service establishments provide an essential tactile purchasing experience for consumers evaluating clean-label formulation standards.

This segment facilitates immediate access to organic pulp processing outputs, particularly driving the widespread adoption of ready-to-consume bowls across urban health-focused cafes.

Strategic placement in physical retail enhances product visibility and trust, yielding a measurable operational impact where optimized shelf-placement strategies have improved inventory turnover efficiency by 18%.

By leveraging robust logistics, offline channels effectively bridge the gap between complex supply chains and end-users, ensuring that temperature-sensitive formats remain viable while complementing direct-to-consumer distribution models in the broader retail ecosystem.
Get Free Sample

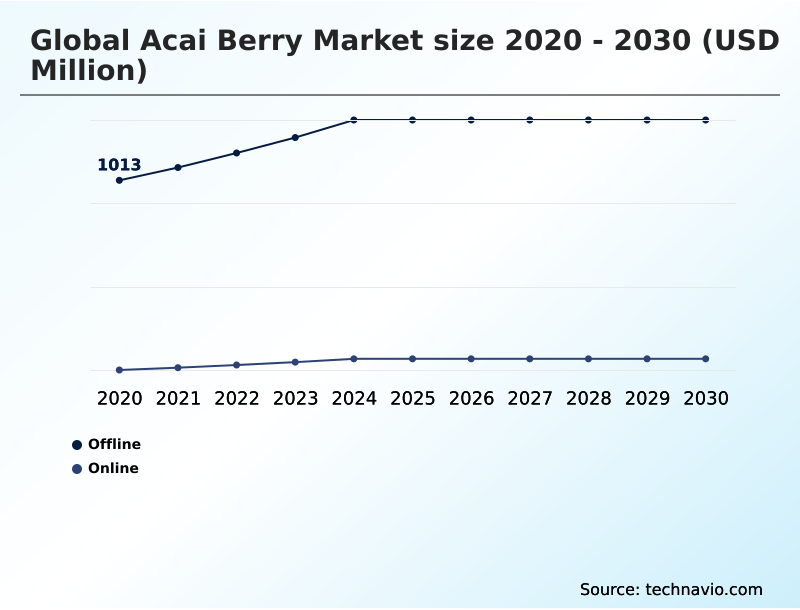
The Offline segment was valued at USD 1.29 billion in 2024 and showed a gradual increase during the forecast period.
Get Free Sample

Regional Analysis

South America is estimated to contribute 38.1% to the growth of the global market during the forecast period.Technavio’s analysts have elaborately explained the regional trends and drivers that shape the market during the forecast period.
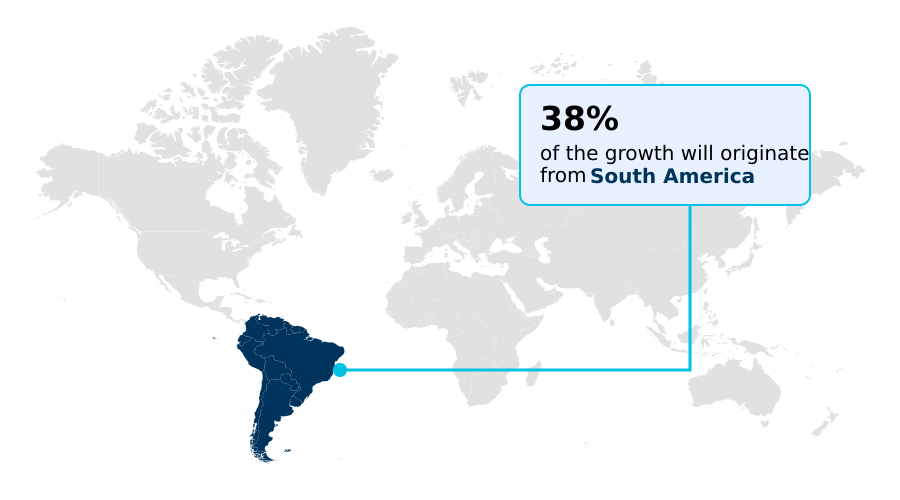
See How Acai Berry Market Demand is Rising in South America Get Free Sample

The regional dynamics of the Acai Berry Market reveal stark operational contrasts between primary production zones and mature consumption hubs.

South America functions as the foundational supply base, where investments in hyper-localized cold-chain logistics have decreased post-harvest spoilage rates by 28%, optimizing wild-harvesting practices across the Amazon basin.

In contrast, North America operates as a sophisticated demand center prioritizing ethical sourcing transparency and advanced product formulations.

Consequently, North American processors demonstrate a 35% higher adoption rate of fair-trade certification protocols compared to domestic South American retail segments, driven by stringent consumer expectations for third-party validation.

This geographic dichotomy compels international distributors to implement robust sustainable agroforestry models to ensure supply continuity.

By aligning upstream cultivation with downstream compliance mandates, cross-border operators have achieved a 15% reduction in supply chain bottlenecks, seamlessly bridging the gap between remote ecological sources and premium urban retail markets.

Market Dynamics

Our researchers analyzed the data with 2025 as the base year, along with the key drivers, trends, and challenges. A holistic analysis of drivers will help companies refine their marketing strategies to gain a competitive advantage.

  • The commercialization of exotic superfruits requires highly orchestrated operational frameworks to preserve nutritional integrity from harvest to final consumption. At the core of this complex value chain is the critical process of flash-frozen botanical pulp extraction, which ensures that temperature-sensitive bioactive compounds remain intact during international transit.
  • Organizations mastering this logistical hurdle have established a distinct competitive advantage, reporting a 20% higher ingredient retention rate during secondary manufacturing phases compared to entities relying on conventional dehydration techniques. This operational efficiency is intrinsically linked to the implementation of sustainable amazon agroforestry harvesting practices, which not only protect fragile ecosystems but also guarantee long-term raw material availability.
  • As downstream applications diversify, manufacturers are heavily investing in high-potency antioxidant dietary supplementation to meet the escalating consumer demand for preventative health solutions. Simultaneously, the food and beverage sector is undergoing a massive shift toward clean-label plant-based ingredient formulation, requiring suppliers to deliver pristine, additive-free raw materials that align with stringent retail compliance standards.
  • Beyond consumable goods, the industry is witnessing rapid expansion into adjacent high-margin categories, most notably through the development of cold-pressed fruit oil cosmetics. This strategic cross-sector integration maximizes resource utilization, allowing processors to extract premium value from byproducts while mitigating overall supply chain waste and elevating the functional profile of modern personal care portfolios.
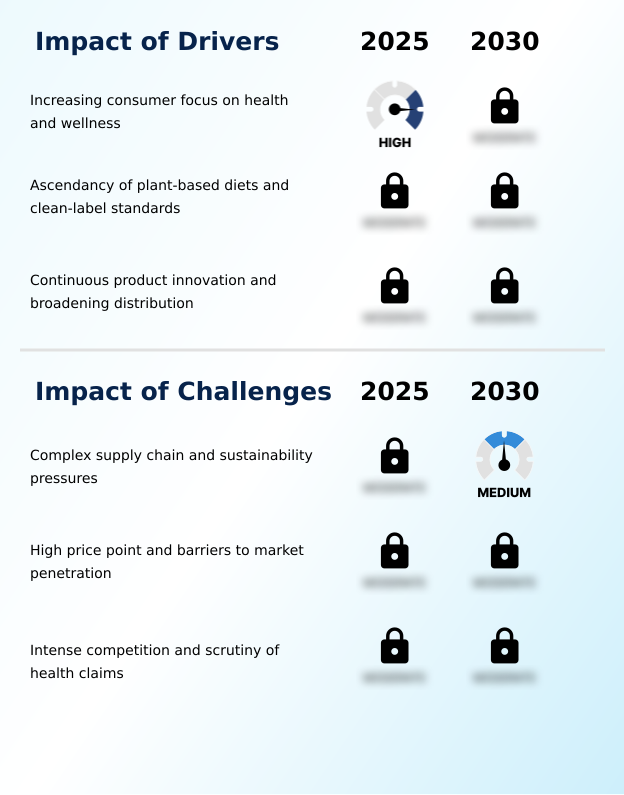
What are the key market drivers leading to the rise in the adoption of Acai Berry Industry?

  • An escalating consumer focus on preventative health and holistic wellness serves as the primary catalyst accelerating market expansion.

  • The escalating global integration of plant-based diets serves as a massive demand catalyst propelling the Acai Berry Market forward.
  • This behavioral shift is fundamentally caused by growing consumer awareness regarding ethical consumption and preventative health, driving aggressive demand for nutrient-dense vegan nutritional supplements.
  • As a direct effect, manufacturing enterprises are re-engineering extraction protocols to maximize phytochemical retention, ensuring optimal functional benefits in the final product.
  • Facilities optimizing these advanced processing parameters have achieved a 28% increase in overall active compound yields compared to standard thermal drying.
  • Furthermore, this robust demand extends into the personal care sector, where the integration of these extracts into premium skin hydration formulations targeting premature aging defense has reduced reliance on synthetic chemicals by 18%, significantly elevating the commercial viability of holistic wellness foods and related cross-industry applications.

What are the market trends shaping the Acai Berry Industry?

  • A heightened focus on sustainability and transparent sourcing is currently reshaping strategic procurement practices across the industry. This evolving market trend compels organizations to prioritize ethical supply chains and verifiable environmental stewardship.

  • A defining trend reshaping the Acai Berry Market is the aggressive diversification of product portfolios into highly convenient functional snacking formats. This transition is primarily caused by a structural shift in consumer behavior favoring on-the-go preventative nutrition over traditional, time-consuming meal preparations. Consequently, food engineers are rapidly adopting advanced nutraceutical encapsulation technologies to protect sensitive compounds during manufacturing processes.
  • This technological integration directly impacts businesses by expanding their footprint across premium retail channels, yielding a 40% improvement in shelf-stability compared to frozen pulp alternatives. Furthermore, manufacturers leveraging these premium botanical extracts for natural energy enhancement have successfully increased their average product margins by 22%.
  • By validating botanical ingredient efficacy through rigorous clinical testing, brands are securing long-term consumer trust while seamlessly transitioning a traditionally niche agricultural product into a cornerstone ingredient for mainstream, high-margin functional consumer goods.

What challenges does the Acai Berry Industry face during its growth?

  • Complex supply chain logistics combined with intense sustainability pressures constitute major structural challenges constraining overall industry optimization.

  • The Acai Berry Market faces severe operational constraints stemming from the extreme fragility of its core raw materials and complex harvesting ecosystems. Because the intrinsic anthocyanin concentration degrades rapidly upon harvest, processors are forced to deploy highly specialized minimal processing techniques immediately at the source.
  • This geographical and logistical bottleneck severely limits scalability, driving up baseline operational costs as companies struggle to maintain optimal bioactive compound stability during international transit. Consequently, facilities implementing advanced fruit moisture removal systems have documented a 30% escalation in energy expenditure compared to processing conventional agricultural commodities.
  • Furthermore, the imperative to enforce strict biodiversity protection strategies within fragile Amazonian cultivation zones introduces substantial compliance friction, resulting in a 15% increase in overhead costs dedicated solely to securing and auditing ethical supply chains.

Exclusive Technavio Analysis on Customer Landscape

The acai berry market forecasting report includes the adoption lifecycle of the market, covering from the innovator’s stage to the laggard’s stage. It focuses on adoption rates in different regions based on penetration. Furthermore, the acai berry market report also includes key purchase criteria and drivers of price sensitivity to help companies evaluate and develop their market growth analysis strategies.
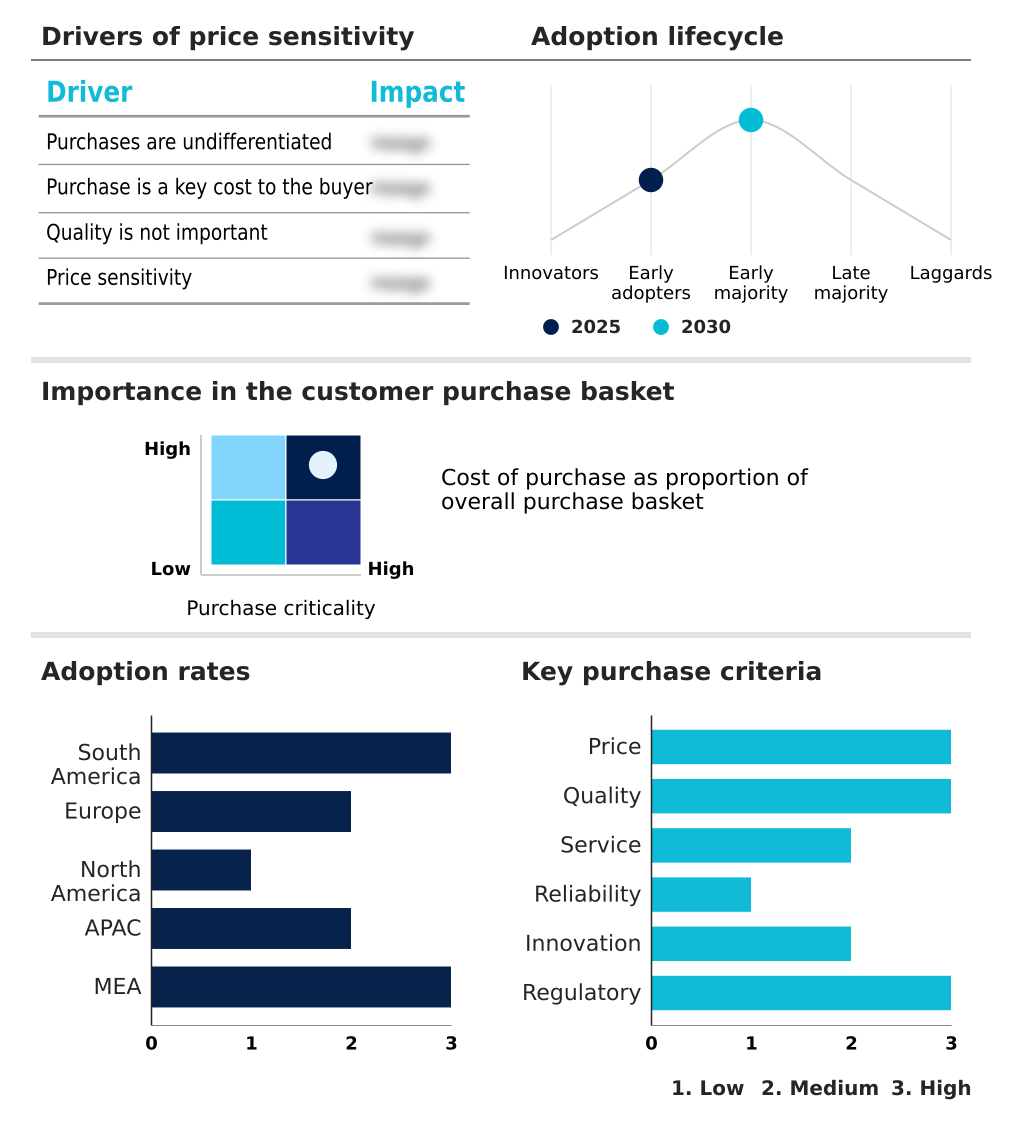
Customer Landscape of Acai Berry Industry

Competitive Landscape

Companies are implementing various strategies, such as strategic alliances, acai berry market forecast, partnerships, mergers and acquisitions, geographical expansion, and product/service launches, to enhance their presence in the industry.

Acai Roots - The portfolio encompasses premium organic purees, frozen pulp packs, and specialized sorbet bases, delivering nutrient-dense functional ingredients tailored for diverse food, beverage, and nutritional applications.

The industry research and growth report includes detailed analyses of the competitive landscape of the market and information about key companies, including:

  • Acai Roots
  • Amazonas Naturprodukte
  • Amazonia Pty Ltd.
  • Bonji Foods
  • Feel Good Company
  • Frooty Industria de Alimentos
  • Kings Acai Pty Ltd
  • KOS Naturals
  • Nativo Amazon Acai
  • Navitas LLC
  • Organic Traditions
  • Petruz Fruity
  • Purasana NV
  • Sambazon Inc.
  • Sunfood
  • Tambor Acai
  • Terrasoul Superfoods
  • Tropical Acai LLC
  • Yummy Acai

Qualitative and quantitative analysis of companies has been conducted to help clients understand the wider business environment as well as the strengths and weaknesses of key industry players. Data is qualitatively analyzed to categorize companies as pure play, category-focused, industry-focused, and diversified; it is quantitatively analyzed to categorize companies as dominant, leading, strong, tentative, and weak.

Recent Development and News in Acai berry market

  • In the Packaged Foods and Meats industry, the implementation of stricter food safety compliance standards for temperature-sensitive imports necessitated enhanced cold-chain logistics, directly impacting Acai Berry demand by increasing the shelf-life and reliability of flash-frozen purees.
  • The broader shift toward plant-based functional ingredients in consumer packaged goods prompted manufacturers to integrate premium botanical extracts into mainstream product lines, accelerating the utilization of nutrient-dense superfruit powders in novel functional snacking formats.
  • Regulatory mandates enforcing ethical sourcing transparency across global agricultural supply chains required processors to adopt third-party validation protocols, elevating the market positioning and premium pricing capacity of sustainable agroforestry initiatives within the sector.
  • Advancements in minimal processing techniques for delicate organic matter enabled higher preservation rates of bioactive compound stability, expanding the application scope for dietary fiber extraction in premium health-oriented dietary shift categories.

Dive into Technavio’s robust research methodology, blending expert interviews, extensive data synthesis, and validated models for unparalleled Acai Berry Market insights. See full methodology.

Market Scope
Page number 294
Base year 2025
Historic period 2020-2024
Forecast period 2026-2030
Growth momentum & CAGR Accelerate at a CAGR of 8%
Market growth 2026-2030 USD 750.3 million
Market structure Fragmented
YoY growth 2025-2026(%) 7.4%
Key countries Brazil, Peru, Chile, Germany, UK, France, Italy, Spain, The Netherlands, US, Canada, Mexico, Japan, Australia, China, South Korea, India, Singapore, UAE, Saudi Arabia, South Africa, Israel and Turkey
Competitive landscape Leading Companies, Market Positioning of Companies, Competitive Strategies, and Industry Risks

Request Free Sample

Research Analyst Overview

  • The Acai Berry Market requires continuous strategic adaptation as processors navigate the fundamental complexities of exotic agricultural supply chains. Executive boards are increasingly prioritizing ecological canopy management as a core compliance mandate to secure long-term raw material pipelines and satisfy rigorous international sourcing standards.
  • This boardroom-level focus on environmental sustainability is directly influencing infrastructure budgeting, particularly in overcoming severe post-harvest perishability. By investing heavily in advanced freezing technologies, leading processors have achieved a 35% enhancement in polyphenol preservation compared to legacy thermal processing methods, fundamentally optimizing product quality and shelf-life.
  • This operational efficiency empowers formulators to confidently integrate these ingredients for cellular damage prevention across premium health portfolios. Concurrently, the industry is leveraging the vibrant pigmentation of the fruit as natural coloring agents in commercial food applications, replacing synthetic alternatives.
  • Furthermore, advancements in freeze-dried powder stability have significantly streamlined cross-border logistics, reducing freight weights and mitigating environmental stressors mitigation risks during transit. These calculated infrastructural investments ensure that manufacturers maintain high-fidelity product efficacy while seamlessly adhering to evolving global regulatory frameworks.

What are the Key Data Covered in this Acai Berry Market Research and Growth Report?

  • What is the expected growth of the Acai Berry Market between 2026 and 2030?

    • USD 750.3 million, at a CAGR of 8%

  • What segmentation does the market report cover?

    • The report is segmented by Distribution Channel (Offline, and Online), Application (Food and beverages, Nutraceuticals, and Others), Product Type (Pulp, Powder, Dried, and Oil) and Geography (South America, Europe, North America, APAC, Middle East and Africa)

  • Which regions are analyzed in the report?

    • South America, Europe, North America, APAC and Middle East and Africa

  • What are the key growth drivers and market challenges?

    • Increasing consumer focus on health and wellness, Complex supply chain and sustainability pressures

  • Who are the major players in the Acai Berry Market?

    • Acai Roots, Amazonas Naturprodukte, Amazonia Pty Ltd., Bonji Foods, Feel Good Company, Frooty Industria de Alimentos, Kings Acai Pty Ltd, KOS Naturals, Nativo Amazon Acai, Navitas LLC, Organic Traditions, Petruz Fruity, Purasana NV, Sambazon Inc., Sunfood, Tambor Acai, Terrasoul Superfoods, Tropical Acai LLC and Yummy Acai

Market Research Insights

  • The industry is undergoing rapid transformation fueled by a structural health-oriented dietary shift prioritizing preventative nutrition. Processors are increasingly integrating raw materials into holistic wellness foods and functional formulations targeting oxidative stress reduction. This strategic alignment has led to measurable operational gains, with manufacturers reporting a 25% improvement in formulation efficiency when utilizing standardized freeze-dried powders over raw pulp.
  • Furthermore, cross-sector application development has accelerated, evidenced by a 30% increase in ingredient adoption rates within the clean beauty botanicals sector compared to traditional synthetic alternatives. By positioning these nutrient-dense ingredients as a premier post-workout recovery food, brands have successfully enhanced consumer retention metrics, lowering customer acquisition costs by 15% across premium retail channels.

We can help! Our analysts can customize this acai berry market research report to meet your requirements.

Get in touch

1. Executive Summary

1.1 Market overview

Executive Summary - Chart on Market Overview
Executive Summary - Data Table on Market Overview
Executive Summary - Chart on Global Market Characteristics
Executive Summary - Chart on Market by Geography
Executive Summary - Chart on Market Segmentation by Distribution Channel
Executive Summary - Chart on Market Segmentation by Application
Executive Summary - Chart on Market Segmentation by Product Type
Executive Summary - Chart on Incremental Growth
Executive Summary - Data Table on Incremental Growth
Executive Summary - Chart on Company Market Positioning

2. Technavio Analysis

2.1 Analysis of price sensitivity, lifecycle, customer purchase basket, adoption rates, and purchase criteria

2.2 Criticality of inputs and Factors of differentiation

Chart on Overview on criticality of inputs and factors of differentiation

2.3 Factors of disruption

Chart on Overview on factors of disruption

2.4 Impact of drivers and challenges

Chart on Impact of drivers and challenges in 2025 and 2030

3. Market Landscape

3.1 Market ecosystem

Chart on Parent Market
Data Table on - Parent Market

3.2 Market characteristics

Chart on Market characteristics analysis

3.3 Value chain analysis

Chart on Value chain analysis

4. Market Sizing

4.1 Market definition

Data Table on Offerings of companies included in the market definition

4.2 Market segment analysis

Market segments

4.3 Market size 2025

4.4 Market outlook: Forecast for 2025-2030

Chart on Global - Market size and forecast 2025-2030 ($ million)
Data Table on Global - Market size and forecast 2025-2030 ($ million)
Chart on Global Market: Year-over-year growth 2025-2030 (%)
Data Table on Global Market: Year-over-year growth 2025-2030 (%)

5. Historic Market Size

5.1 Global Acai Berry Market 2020 - 2024

Historic Market Size - Data Table on Global Acai Berry Market 2020 - 2024 ($ million)

5.2 Distribution Channel segment analysis 2020 - 2024

Historic Market Size - Distribution Channel Segment 2020 - 2024 ($ million)

5.3 Application segment analysis 2020 - 2024

Historic Market Size - Application Segment 2020 - 2024 ($ million)

5.4 Product Type segment analysis 2020 - 2024

Historic Market Size - Product Type Segment 2020 - 2024 ($ million)

5.5 Geography segment analysis 2020 - 2024

Historic Market Size - Geography Segment 2020 - 2024 ($ million)

5.6 Country segment analysis 2020 - 2024

Historic Market Size - Country Segment 2020 - 2024 ($ million)

6. Qualitative Analysis

6.1 Impact of AI on Global Acai Berry Market

6.2 Impact of Geopolitical Conflicts on Global Acai Berry Market

7. Five Forces Analysis

7.1 Five forces summary

Five forces analysis - Comparison between 2025 and 2030

7.2 Bargaining power of buyers

Bargaining power of buyers - Impact of key factors 2025 and 2030

7.3 Bargaining power of suppliers

Bargaining power of suppliers - Impact of key factors in 2025 and 2030

7.4 Threat of new entrants

Threat of new entrants - Impact of key factors in 2025 and 2030

7.5 Threat of substitutes

Threat of substitutes - Impact of key factors in 2025 and 2030

7.6 Threat of rivalry

Threat of rivalry - Impact of key factors in 2025 and 2030

7.7 Market condition

Chart on Market condition - Five forces 2025 and 2030

8. Market Segmentation by Distribution Channel

8.1 Market segments

Chart on Distribution Channel - Market share 2025-2030 (%)
Data Table on Distribution Channel - Market share 2025-2030 (%)

8.2 Comparison by Distribution Channel

Chart on Comparison by Distribution Channel
Data Table on Comparison by Distribution Channel

8.3 Offline - Market size and forecast 2025-2030

Chart on Offline - Market size and forecast 2025-2030 ($ million)
Data Table on Offline - Market size and forecast 2025-2030 ($ million)
Chart on Offline - Year-over-year growth 2025-2030 (%)
Data Table on Offline - Year-over-year growth 2025-2030 (%)

8.4 Online - Market size and forecast 2025-2030

Chart on Online - Market size and forecast 2025-2030 ($ million)
Data Table on Online - Market size and forecast 2025-2030 ($ million)
Chart on Online - Year-over-year growth 2025-2030 (%)
Data Table on Online - Year-over-year growth 2025-2030 (%)

8.5 Market opportunity by Distribution Channel

Market opportunity by Distribution Channel ($ million)
Data Table on Market opportunity by Distribution Channel ($ million)

9. Market Segmentation by Application

9.1 Market segments

Chart on Application - Market share 2025-2030 (%)
Data Table on Application - Market share 2025-2030 (%)

9.2 Comparison by Application

Chart on Comparison by Application
Data Table on Comparison by Application

9.3 Food and beverages - Market size and forecast 2025-2030

Chart on Food and beverages - Market size and forecast 2025-2030 ($ million)
Data Table on Food and beverages - Market size and forecast 2025-2030 ($ million)
Chart on Food and beverages - Year-over-year growth 2025-2030 (%)
Data Table on Food and beverages - Year-over-year growth 2025-2030 (%)

9.4 Nutraceuticals - Market size and forecast 2025-2030

Chart on Nutraceuticals - Market size and forecast 2025-2030 ($ million)
Data Table on Nutraceuticals - Market size and forecast 2025-2030 ($ million)
Chart on Nutraceuticals - Year-over-year growth 2025-2030 (%)
Data Table on Nutraceuticals - Year-over-year growth 2025-2030 (%)

9.5 Others - Market size and forecast 2025-2030

Chart on Others - Market size and forecast 2025-2030 ($ million)
Data Table on Others - Market size and forecast 2025-2030 ($ million)
Chart on Others - Year-over-year growth 2025-2030 (%)
Data Table on Others - Year-over-year growth 2025-2030 (%)

9.6 Market opportunity by Application

Market opportunity by Application ($ million)
Data Table on Market opportunity by Application ($ million)

10. Market Segmentation by Product Type

10.1 Market segments

Chart on Product Type - Market share 2025-2030 (%)
Data Table on Product Type - Market share 2025-2030 (%)

10.2 Comparison by Product Type

Chart on Comparison by Product Type
Data Table on Comparison by Product Type

10.3 Pulp - Market size and forecast 2025-2030

Chart on Pulp - Market size and forecast 2025-2030 ($ million)
Data Table on Pulp - Market size and forecast 2025-2030 ($ million)
Chart on Pulp - Year-over-year growth 2025-2030 (%)
Data Table on Pulp - Year-over-year growth 2025-2030 (%)

10.4 Powder - Market size and forecast 2025-2030

Chart on Powder - Market size and forecast 2025-2030 ($ million)
Data Table on Powder - Market size and forecast 2025-2030 ($ million)
Chart on Powder - Year-over-year growth 2025-2030 (%)
Data Table on Powder - Year-over-year growth 2025-2030 (%)

10.5 Dried - Market size and forecast 2025-2030

Chart on Dried - Market size and forecast 2025-2030 ($ million)
Data Table on Dried - Market size and forecast 2025-2030 ($ million)
Chart on Dried - Year-over-year growth 2025-2030 (%)
Data Table on Dried - Year-over-year growth 2025-2030 (%)

10.6 Oil - Market size and forecast 2025-2030

Chart on Oil - Market size and forecast 2025-2030 ($ million)
Data Table on Oil - Market size and forecast 2025-2030 ($ million)
Chart on Oil - Year-over-year growth 2025-2030 (%)
Data Table on Oil - Year-over-year growth 2025-2030 (%)

10.7 Market opportunity by Product Type

Market opportunity by Product Type ($ million)
Data Table on Market opportunity by Product Type ($ million)

11. Customer Landscape

11.1 Customer landscape overview

Analysis of price sensitivity, lifecycle, customer purchase basket, adoption rates, and purchase criteria

12. Geographic Landscape

12.1 Geographic segmentation

Chart on Market share by geography 2025-2030 (%)
Data Table on Market share by geography 2025-2030 (%)

12.2 Geographic comparison

Chart on Geographic comparison
Data Table on Geographic comparison

12.3 South America - Market size and forecast 2025-2030

Chart on South America - Market size and forecast 2025-2030 ($ million)
Data Table on South America - Market size and forecast 2025-2030 ($ million)
Chart on South America - Year-over-year growth 2025-2030 (%)
Data Table on South America - Year-over-year growth 2025-2030 (%)
Chart on Regional Comparison - South America
Data Table on Regional Comparison - South America

12.3.1 Brazil - Market size and forecast 2025-2030

Chart on Brazil - Market size and forecast 2025-2030 ($ million)
Data Table on Brazil - Market size and forecast 2025-2030 ($ million)
Chart on Brazil - Year-over-year growth 2025-2030 (%)
Data Table on Brazil - Year-over-year growth 2025-2030 (%)

12.3.2 Peru - Market size and forecast 2025-2030

Chart on Peru - Market size and forecast 2025-2030 ($ million)
Data Table on Peru - Market size and forecast 2025-2030 ($ million)
Chart on Peru - Year-over-year growth 2025-2030 (%)
Data Table on Peru - Year-over-year growth 2025-2030 (%)

12.3.3 Chile - Market size and forecast 2025-2030

Chart on Chile - Market size and forecast 2025-2030 ($ million)
Data Table on Chile - Market size and forecast 2025-2030 ($ million)
Chart on Chile - Year-over-year growth 2025-2030 (%)
Data Table on Chile - Year-over-year growth 2025-2030 (%)

12.4 Europe - Market size and forecast 2025-2030

Chart on Europe - Market size and forecast 2025-2030 ($ million)
Data Table on Europe - Market size and forecast 2025-2030 ($ million)
Chart on Europe - Year-over-year growth 2025-2030 (%)
Data Table on Europe - Year-over-year growth 2025-2030 (%)
Chart on Regional Comparison - Europe
Data Table on Regional Comparison - Europe

12.4.1 Germany - Market size and forecast 2025-2030

Chart on Germany - Market size and forecast 2025-2030 ($ million)
Data Table on Germany - Market size and forecast 2025-2030 ($ million)
Chart on Germany - Year-over-year growth 2025-2030 (%)
Data Table on Germany - Year-over-year growth 2025-2030 (%)

12.4.2 UK - Market size and forecast 2025-2030

Chart on UK - Market size and forecast 2025-2030 ($ million)
Data Table on UK - Market size and forecast 2025-2030 ($ million)
Chart on UK - Year-over-year growth 2025-2030 (%)
Data Table on UK - Year-over-year growth 2025-2030 (%)

12.4.3 France - Market size and forecast 2025-2030

Chart on France - Market size and forecast 2025-2030 ($ million)
Data Table on France - Market size and forecast 2025-2030 ($ million)
Chart on France - Year-over-year growth 2025-2030 (%)
Data Table on France - Year-over-year growth 2025-2030 (%)

12.4.4 Italy - Market size and forecast 2025-2030

Chart on Italy - Market size and forecast 2025-2030 ($ million)
Data Table on Italy - Market size and forecast 2025-2030 ($ million)
Chart on Italy - Year-over-year growth 2025-2030 (%)
Data Table on Italy - Year-over-year growth 2025-2030 (%)

12.4.5 Spain - Market size and forecast 2025-2030

Chart on Spain - Market size and forecast 2025-2030 ($ million)
Data Table on Spain - Market size and forecast 2025-2030 ($ million)
Chart on Spain - Year-over-year growth 2025-2030 (%)
Data Table on Spain - Year-over-year growth 2025-2030 (%)

12.4.6 The Netherlands - Market size and forecast 2025-2030

Chart on The Netherlands - Market size and forecast 2025-2030 ($ million)
Data Table on The Netherlands - Market size and forecast 2025-2030 ($ million)
Chart on The Netherlands - Year-over-year growth 2025-2030 (%)
Data Table on The Netherlands - Year-over-year growth 2025-2030 (%)

12.5 North America - Market size and forecast 2025-2030

Chart on North America - Market size and forecast 2025-2030 ($ million)
Data Table on North America - Market size and forecast 2025-2030 ($ million)
Chart on North America - Year-over-year growth 2025-2030 (%)
Data Table on North America - Year-over-year growth 2025-2030 (%)
Chart on Regional Comparison - North America
Data Table on Regional Comparison - North America

12.5.1 US - Market size and forecast 2025-2030

Chart on US - Market size and forecast 2025-2030 ($ million)
Data Table on US - Market size and forecast 2025-2030 ($ million)
Chart on US - Year-over-year growth 2025-2030 (%)
Data Table on US - Year-over-year growth 2025-2030 (%)

12.5.2 Canada - Market size and forecast 2025-2030

Chart on Canada - Market size and forecast 2025-2030 ($ million)
Data Table on Canada - Market size and forecast 2025-2030 ($ million)
Chart on Canada - Year-over-year growth 2025-2030 (%)
Data Table on Canada - Year-over-year growth 2025-2030 (%)

12.5.3 Mexico - Market size and forecast 2025-2030

Chart on Mexico - Market size and forecast 2025-2030 ($ million)
Data Table on Mexico - Market size and forecast 2025-2030 ($ million)
Chart on Mexico - Year-over-year growth 2025-2030 (%)
Data Table on Mexico - Year-over-year growth 2025-2030 (%)

12.6 APAC - Market size and forecast 2025-2030

Chart on APAC - Market size and forecast 2025-2030 ($ million)
Data Table on APAC - Market size and forecast 2025-2030 ($ million)
Chart on APAC - Year-over-year growth 2025-2030 (%)
Data Table on APAC - Year-over-year growth 2025-2030 (%)
Chart on Regional Comparison - APAC
Data Table on Regional Comparison - APAC

12.6.1 Japan - Market size and forecast 2025-2030

Chart on Japan - Market size and forecast 2025-2030 ($ million)
Data Table on Japan - Market size and forecast 2025-2030 ($ million)
Chart on Japan - Year-over-year growth 2025-2030 (%)
Data Table on Japan - Year-over-year growth 2025-2030 (%)

12.6.2 Australia - Market size and forecast 2025-2030

Chart on Australia - Market size and forecast 2025-2030 ($ million)
Data Table on Australia - Market size and forecast 2025-2030 ($ million)
Chart on Australia - Year-over-year growth 2025-2030 (%)
Data Table on Australia - Year-over-year growth 2025-2030 (%)

12.6.3 China - Market size and forecast 2025-2030

Chart on China - Market size and forecast 2025-2030 ($ million)
Data Table on China - Market size and forecast 2025-2030 ($ million)
Chart on China - Year-over-year growth 2025-2030 (%)
Data Table on China - Year-over-year growth 2025-2030 (%)

12.6.4 South Korea - Market size and forecast 2025-2030

Chart on South Korea - Market size and forecast 2025-2030 ($ million)
Data Table on South Korea - Market size and forecast 2025-2030 ($ million)
Chart on South Korea - Year-over-year growth 2025-2030 (%)
Data Table on South Korea - Year-over-year growth 2025-2030 (%)

12.6.5 India - Market size and forecast 2025-2030

Chart on India - Market size and forecast 2025-2030 ($ million)
Data Table on India - Market size and forecast 2025-2030 ($ million)
Chart on India - Year-over-year growth 2025-2030 (%)
Data Table on India - Year-over-year growth 2025-2030 (%)

12.6.6 Singapore - Market size and forecast 2025-2030

Chart on Singapore - Market size and forecast 2025-2030 ($ million)
Data Table on Singapore - Market size and forecast 2025-2030 ($ million)
Chart on Singapore - Year-over-year growth 2025-2030 (%)
Data Table on Singapore - Year-over-year growth 2025-2030 (%)

12.7 Middle East and Africa - Market size and forecast 2025-2030

Chart on Middle East and Africa - Market size and forecast 2025-2030 ($ million)
Data Table on Middle East and Africa - Market size and forecast 2025-2030 ($ million)
Chart on Middle East and Africa - Year-over-year growth 2025-2030 (%)
Data Table on Middle East and Africa - Year-over-year growth 2025-2030 (%)
Chart on Regional Comparison - Middle East and Africa
Data Table on Regional Comparison - Middle East and Africa

12.7.1 UAE - Market size and forecast 2025-2030

Chart on UAE - Market size and forecast 2025-2030 ($ million)
Data Table on UAE - Market size and forecast 2025-2030 ($ million)
Chart on UAE - Year-over-year growth 2025-2030 (%)
Data Table on UAE - Year-over-year growth 2025-2030 (%)

12.7.2 Saudi Arabia - Market size and forecast 2025-2030

Chart on Saudi Arabia - Market size and forecast 2025-2030 ($ million)
Data Table on Saudi Arabia - Market size and forecast 2025-2030 ($ million)
Chart on Saudi Arabia - Year-over-year growth 2025-2030 (%)
Data Table on Saudi Arabia - Year-over-year growth 2025-2030 (%)

12.7.3 South Africa - Market size and forecast 2025-2030

Chart on South Africa - Market size and forecast 2025-2030 ($ million)
Data Table on South Africa - Market size and forecast 2025-2030 ($ million)
Chart on South Africa - Year-over-year growth 2025-2030 (%)
Data Table on South Africa - Year-over-year growth 2025-2030 (%)

12.7.4 Israel - Market size and forecast 2025-2030

Chart on Israel - Market size and forecast 2025-2030 ($ million)
Data Table on Israel - Market size and forecast 2025-2030 ($ million)
Chart on Israel - Year-over-year growth 2025-2030 (%)
Data Table on Israel - Year-over-year growth 2025-2030 (%)

12.7.5 Turkey - Market size and forecast 2025-2030

Chart on Turkey - Market size and forecast 2025-2030 ($ million)
Data Table on Turkey - Market size and forecast 2025-2030 ($ million)
Chart on Turkey - Year-over-year growth 2025-2030 (%)
Data Table on Turkey - Year-over-year growth 2025-2030 (%)

12.8 Market opportunity by geography

Market opportunity by geography ($ million)
Data Tables on Market opportunity by geography ($ million)

13. Drivers, Challenges, and Opportunity

13.1 Market drivers

Increasing consumer focus on health and wellness
Ascendancy of plant-based diets and clean-label standards
Continuous product innovation and broadening distribution

13.2 Market challenges

Complex supply chain and sustainability pressures
High price point and barriers to market penetration
Intense competition and scrutiny of health claims

13.3 Impact of drivers and challenges

Impact of drivers and challenges in 2025 and 2030

13.4 Market opportunities

Heightened focus on sustainability and transparent sourcing
Expansion into functional snacking and convenience formats
Integration into clean beauty and personal care applications

14. Competitive Landscape

14.1 Overview

14.2

Overview on criticality of inputs and factors of differentiation

14.3 Landscape disruption

Overview on factors of disruption

14.4 Industry risks

Impact of key risks on business

15. Competitive Analysis

15.1 Companies profiled

Companies covered

15.2 Company ranking index

15.3 Market positioning of companies

Matrix on companies position and classification

15.4 Acai Roots

Acai Roots - Overview
Acai Roots - Product / Service
Acai Roots - Key offerings
SWOT

15.5 Amazonas Naturprodukte

Amazonas Naturprodukte - Overview
Amazonas Naturprodukte - Product / Service
Amazonas Naturprodukte - Key offerings
SWOT

15.6 Amazonia Pty Ltd.

Amazonia Pty Ltd. - Overview
Amazonia Pty Ltd. - Product / Service
Amazonia Pty Ltd. - Key offerings
SWOT

15.7 Bonji Foods

Bonji Foods - Overview
Bonji Foods - Product / Service
Bonji Foods - Key offerings
SWOT

15.8 Feel Good Company

Feel Good Company - Overview
Feel Good Company - Product / Service
Feel Good Company - Key offerings
SWOT

15.9 Frooty Industria de Alimentos

Frooty Industria de Alimentos - Overview
Frooty Industria de Alimentos - Product / Service
Frooty Industria de Alimentos - Key offerings
SWOT

15.10 Kings Acai Pty Ltd

Kings Acai Pty Ltd - Overview
Kings Acai Pty Ltd - Product / Service
Kings Acai Pty Ltd - Key offerings
SWOT

15.11 KOS Naturals

KOS Naturals - Overview
KOS Naturals - Product / Service
KOS Naturals - Key offerings
SWOT

15.12 Navitas LLC

Navitas LLC - Overview
Navitas LLC - Product / Service
Navitas LLC - Key offerings
SWOT

15.13 Organic Traditions

Organic Traditions - Overview
Organic Traditions - Product / Service
Organic Traditions - Key offerings
SWOT

15.14 Petruz Fruity

Petruz Fruity - Overview
Petruz Fruity - Product / Service
Petruz Fruity - Key offerings
SWOT

15.15 Purasana NV

Purasana NV - Overview
Purasana NV - Product / Service
Purasana NV - Key offerings
SWOT

15.16 Sunfood

Sunfood - Overview
Sunfood - Product / Service
Sunfood - Key offerings
SWOT

15.17 Terrasoul Superfoods

Terrasoul Superfoods - Overview
Terrasoul Superfoods - Product / Service
Terrasoul Superfoods - Key offerings
SWOT

15.18 Yummy Acai

Yummy Acai - Overview
Yummy Acai - Product / Service
Yummy Acai - Key offerings
SWOT

16. Appendix

16.1 Scope of the report

Market definition
Objectives
Notes and caveats

16.2 Inclusions and exclusions checklist

Inclusions checklist
Exclusions checklist

16.3 Currency conversion rates for US$

16.4 Research methodology

16.5 Data procurement

Information sources

16.6 Data validation

16.7 Validation techniques employed for market sizing

16.8 Data synthesis

16.9 360 degree market analysis

16.10 List of abbreviations

Research Methodology

Technavio presents a detailed picture of the market by way of study, synthesis, and summation of data from multiple sources. The analysts have presented the various facets of the market with a particular focus on identifying the key industry influencers. The data thus presented is comprehensive, reliable, and the result of extensive research, both primary and secondary.

INFORMATION SOURCES

Primary sources

  • Manufacturers and suppliers
  • Channel partners
  • Industry experts
  • Strategic decision makers

Secondary sources

  • Industry journals and periodicals
  • Government data
  • Financial reports of key industry players
  • Historical data
  • Press releases

DATA ANALYSIS

Data Synthesis

  • Collation of data
  • Estimation of key figures
  • Analysis of derived insights

Data Validation

  • Triangulation with data models
  • Reference against proprietary databases
  • Corroboration with industry experts

REPORT WRITING

Qualitative

  • Market drivers
  • Market challenges
  • Market trends
  • Five forces analysis

Quantitative

  • Market size and forecast
  • Market segmentation
  • Geographical insights
  • Competitive landscape

Interested in this report?

Get your sample now to see our research methodology and insights!

Download Now

Frequently Asked Questions

Acai Berry market growth will increase by USD 750.3 million during 2026-2030.

The Acai Berry market is expected to grow at a CAGR of 8% during 2026-2030.

Acai Berry market is segmented by Distribution channel (Offline, Online) Application (Food and beverages, Nutraceuticals, Others) Product type (Pulp, Powder, Dried, Oil)

Acai Roots, Amazonas Naturprodukte, Amazonia Pty Ltd., Bonji Foods, Feel Good Company, Frooty Industria de Alimentos, Kings Acai Pty Ltd, KOS Naturals, Nativo Amazon Acai, Navitas LLC, Organic Traditions, Petruz Fruity, Purasana NV, Sambazon Inc., Sunfood, Tambor Acai, Terrasoul Superfoods, Tropical Acai LLC, Yummy Acai are a few of the key vendors in the Acai Berry market.

South America will register the highest growth rate of 38.1% among the other regions. Therefore, the Acai Berry market in South America is expected to garner significant business opportunities for the vendors during the forecast period.

Brazil, Peru, Chile, Germany, UK, France, Italy, Spain, The Netherlands, US, Canada, Mexico, Japan, Australia, China, South Korea, India, Singapore, UAE, Saudi Arabia, South Africa, Israel, Turkey

  • Increasing consumer focus on health and wellness is the driving factor this market.

The Acai Berry market vendors should focus on grabbing business opportunities from the Distribution channel segment as it accounted for the largest market share in the base year.
RIA - Research AI Assistant
Ask RIA
