Electric Insulator Market Size 2025-2029
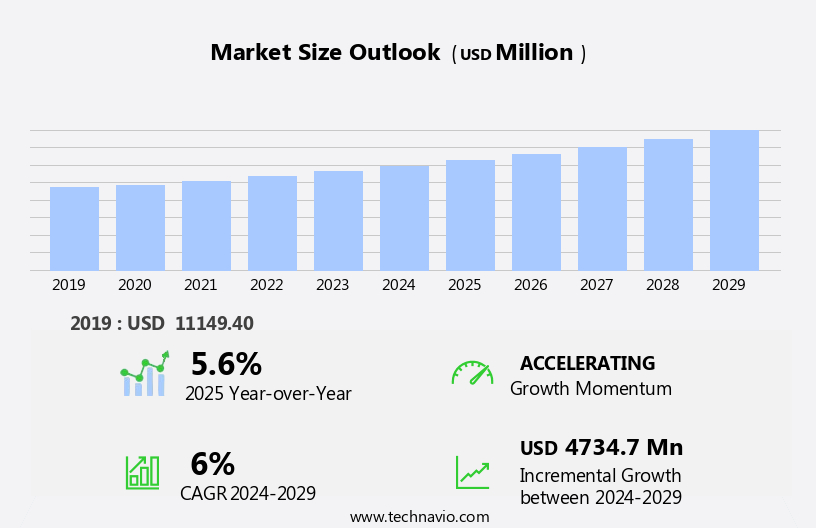
The electric insulator market size is forecast to increase by USD 4.73 billion at a CAGR of 6% between 2024 and 2029.
- The market is experiencing significant growth driven by the increasing global demand for power and the evolution of smart grids. The smart grid infrastructure, which integrates advanced technologies such as automation, sensing, and communication, necessitates the use of high-performance electric insulators to ensure efficient power transmission and distribution. However, the market faces challenges from the availability of refurbished and counterfeit products, which can compromise the safety and reliability of power systems. Companies seeking to capitalize on market opportunities and navigate these challenges effectively should focus on innovation, quality assurance, and regulatory compliance. Investing in research and development to create advanced insulator materials and technologies, such as ceramic, composite, and glass insulators, can help companies differentiate themselves and meet the evolving needs of the power industry.
- Additionally, implementing quality control measures and collaborating with regulatory bodies to ensure product authenticity and safety can help mitigate the risks associated with counterfeit insulators. Their construction includes a shed skirt made of organic synthetic materials, a fiber-reinforced plastic (FRP) core rod, and carbon steel or carbon structural steel end fittings. Overall, the market presents significant opportunities for growth, particularly in emerging economies undergoing electrification and infrastructure modernization. Companies that prioritize innovation, quality, and regulatory compliance will be best positioned to capitalize on these opportunities and succeed in this dynamic market.
What will be the Size of the Electric Insulator Market during the forecast period?
- The market encompasses the production and supply of insulators used in electrical transmission networks, catering to both high and medium voltage applications. The market's growth is driven by the increasing demand for electricity transmission, particularly in the renewable energy sector. Renewable energy targets worldwide are fueling the expansion of transmission networks, necessitating the use of advanced insulator technologies such as composite materials and pin insulators. Smart components, including those incorporating smart grid technology, are gaining traction due to their ability to enhance network efficiency and reliability.
- The high-voltage segment is expected to dominate the market due to the larger scale and longer distances associated with high-voltage transmission. Overall, the market is poised for significant growth, underpinned by infrastructure development and the ongoing transition towards renewable energy sources.
How is this Electric Insulator Industry segmented?
The electric insulator industry research report provides comprehensive data (region-wise segment analysis), with forecasts and estimates in "USD million" for the period 2025-2029, as well as historical data from 2019-2023 for the following segments.
- Type
- Composite/polymer
- Ceramic/porcelain
- Glass
- End-user
- Power transmission
- Utility
- Transportation
- Power Rating
- Medium voltage
- High voltage
- Low voltage
- Product
- Suspension insulator
- Pin insulator
- Shackle insulator
- Others
- Geography
- APAC
- Australia
- China
- India
- Japan
- South Korea
- Europe
- France
- Germany
- Italy
- UK
- North America
- US
- South America
- Middle East and Africa
- APAC
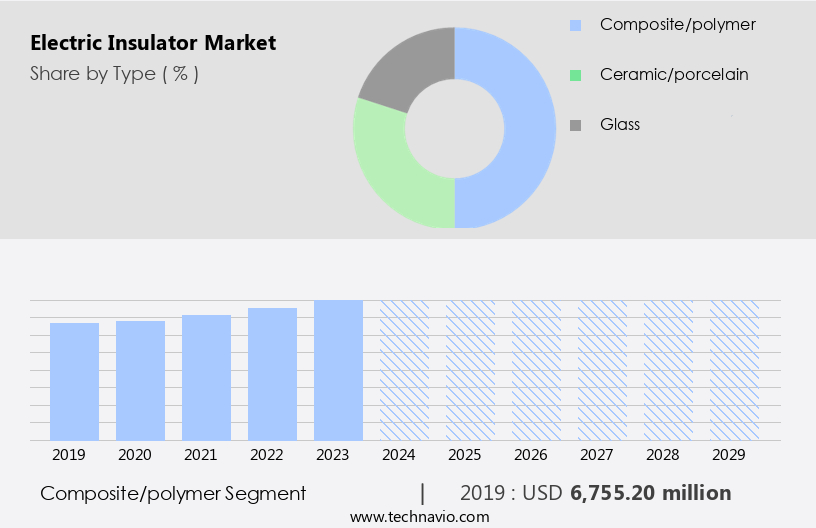
By Type Insights
The composite/polymer segment is estimated to witness significant growth during the forecast period.
Composite insulators, also known as synthetic or non-porcelain insulators, are essential components in overhead power transmission lines. The FRP is typically made of glass fiber as a reinforcing material and an oxidizing resin as a base material. Composite insulators have gained popularity due to their superior electrical insulation properties and resistance to environmental conditions. In the context of renewable energy and transmission networks, composite insulators play a crucial role in high voltage applications. Renewable energy targets and smart grid technology have led to grid upgrades and infrastructure development, increasing the demand for insulation control solutions. Composite insulators, such as composite pin insulators, are used in medium voltage applications and offer advantages like energy efficiency, insulation control, and grid resilience.
Get a glance at the market report of share of various segments Request Free Sample
The Composite/polymer segment was valued at USD 6.76 billion in 2019 and showed a gradual increase during the forecast period.
Regional Analysis
APAC is estimated to contribute 60% to the growth of the global market during the forecast period. Technavio's analysts have elaborately explained the regional trends and drivers that shape the market during the forecast period.

For more insights on the market size of various regions, Request Free Sample
The market is experiencing significant growth due to the increasing demand for electricity in major developing countries, such as China and India. Private players are increasingly entering the power generation sector, leading to increased competition and investment in transmission and distribution (T&D) networks. This trend is particularly notable in China, India, Pakistan, Australia, and Thailand. The need for a reliable electricity supply is crucial in these economies, given their improving living standards. The expansion of private companies in the power sector may result in substantial investments in T&D infrastructure, including high-voltage transmission lines and smart grid technology. Renewable energy sources, such as wind and solar power, are also driving the demand for advanced insulation solutions, including composite, polymer, ceramic, and glass insulators.
Regulatory authorities are implementing grid upgrades and incentives, such as national renewable targets and feed-in tariffs, to promote the adoption of sustainable power sources. The remote work culture and flexible office spaces are also driving the demand for energy efficiency and insulation control in smart buildings. IoT sensors and digital tenant services are further enhancing the role of insulation in optimizing energy usage and grid resilience.
Market Dynamics
Our researchers analyzed the data with 2024 as the base year, along with the key drivers, trends, and challenges. A holistic analysis of drivers will help companies refine their marketing strategies to gain a competitive advantage.
What are the key market drivers leading to the rise in the adoption of Electric Insulator Industry?
- Increasing global demand for power is the key driver of the market. Electric insulators play a crucial role in power transmission and distribution networks globally. The expanding energy demand from various sectors is driving the need for network expansion, thereby fueling the demand for electric insulators during the forecast period. Factors fueling this demand include the increasing global population and urbanization, leading to rapid industrialization.
- These trends have resulted in a significant rise in electricity consumption. Many regions, particularly in Asia and sub-Saharan Africa, still lack access to electricity, creating ample opportunities for market growth. The insatiable appetite for power from industries, residential, and commercial sectors is expected to continue, ensuring a steady demand for electric insulators.
What are the market trends shaping the Electric Insulator Industry?
- The evolution of smart grids is the upcoming market trend. Electric insulators play a crucial role in the operation of power distribution networks, particularly in the context of smart grids. These advanced systems facilitate the integration of renewable energy sources and enable the provision of reliable and uninterrupted power supply to end-users. The increasing adoption of smart grids in the utility sector is driven by the need to monitor and adapt to local changes in power consumption. Electric insulators are essential components of power distribution networks, ensuring the efficient and reliable transfer of electricity.
- As the energy landscape becomes more decentralized, decarbonized, and digitalized, the demand for electric insulators is expected to grow steadily. The deployment of smart grids offers numerous benefits, including improved power quality, enhanced grid stability, and increased energy efficiency. Consequently, the market is poised for significant growth in the coming years.
What challenges does the Electric Insulator Industry face during its growth?
- Availability of refurbished and counterfeit products is a key challenge affecting the industry's growth. The market dynamics encompass the presence of grey-market products, specifically refurbished and counterfeit electric insulators, which pose challenges to market growth and user safety. Refurbished electric insulators, including used insulators, fuses, and relays, are untested by original equipment manufacturers and sold as new in the market. In contrast, counterfeit electric insulator components are re-engineered copies of genuine products, designed to mimic branded items.
- These unauthorized products are not approved by the original manufacturers and can compromise system performance and potentially endanger users. The proliferation of counterfeit electric insulators negatively impacts market expansion.
Exclusive Customer Landscape
The electric insulator market forecasting report includes the adoption lifecycle of the market, covering from the innovator's stage to the laggard's stage. It focuses on adoption rates in different regions based on penetration. Furthermore, the electric insulator market report also includes key purchase criteria and drivers of price sensitivity to help companies evaluate and develop their market growth analysis strategies.

Customer Landscape
Key Companies & Market Insights
Companies are implementing various strategies, such as strategic alliances, electric insulator market forecast, partnerships, mergers and acquisitions, geographical expansion, and product/service launches, to enhance their presence in the industry.
ABB Ltd. - The company offers electric insulators, namely Furse IN040 electric insulators as an accessory for earthing and lightning application.
The industry research and growth report includes detailed analyses of the competitive landscape of the market and information about key companies, including:
- ABB Ltd.
- General Electric Co.
- Grasim Industries Ltd
- Groupe Sicame
- Grower Technoplast Pvt. Ltd.
- Hitachi Ltd.
- Hubbell Inc.
- KYOCERA Corp.
- MacLean Fogg Co.
- Modern Insulators Ltd.
- NGK Insulators Ltd
- PFISTERER Holding SE
- Rax Industry
- SEVES Group S.a r.l.
- Siemens AG
- Stork Rubber Products Pvt. Ltd.
- TE Connectivity Ltd.
- Victor Insulators Inc.
Qualitative and quantitative analysis of companies has been conducted to help clients understand the wider business environment as well as the strengths and weaknesses of key industry players. Data is qualitatively analyzed to categorize companies as pure play, category-focused, industry-focused, and diversified; it is quantitatively analyzed to categorize companies as dominant, leading, strong, tentative, and weak.
Research Analyst Overview
The market encompasses a diverse range of products utilized in electrical systems to prevent the flow of electrical current between conductors and surrounding environments. These insulators play a crucial role in electrical transmission networks, particularly in high-voltage applications, by ensuring efficient and reliable power transfer. Renewable energy sources, such as wind and solar, are driving significant growth in the market. The increasing adoption of renewable targets and the integration of sustainable power sources into transmission networks necessitate the development of advanced insulation solutions. Composite materials, including pin insulators, are gaining popularity due to their superior electrical performance and durability. Transmission networks require continuous upgrades to accommodate increasing power demands and ensure grid resilience.
Smart components, such as IoT sensors and digital tenant services, are being integrated into infrastructure development projects to optimize energy efficiency and improve insulation control. Regulatory authorities are also implementing grid upgrades to accommodate the integration of renewable energy sources and ensure grid stability. Medium-voltage applications also benefit from the adoption of advanced insulation solutions. Smart grid technology is increasingly being used to enhance the performance and reliability of power distribution systems. Composite insulators, including polymer and ceramic varieties, offer improved electrical performance and durability compared to traditional glass insulators. The renewable energy sector's growth is influencing market dynamics, with wind power and solar energy leading the charge.
The shift towards renewable energy sources is expected to continue, driven by national renewable targets and feed-in tariffs. Remote work culture and flexible office space are also contributing to the demand for smart building systems, which incorporate advanced insulation solutions to optimize energy efficiency and reduce operational costs. The market is experiencing significant growth due to the increasing adoption of renewable energy sources and the need for grid upgrades to accommodate these sources. Advanced insulation solutions, such as composite materials, are gaining popularity due to their superior electrical performance and durability. The integration of smart grid technology and IoT sensors is also driving market growth, as these technologies optimize energy efficiency and improve insulation control.
Regulatory authorities are implementing grid upgrades to accommodate the integration of renewable energy sources and ensure grid stability. Overall, the market is poised for continued growth as the global energy landscape evolves towards a more sustainable and efficient future.
|
Market Scope |
|
|
Report Coverage |
Details |
|
Page number |
246 |
|
Base year |
2024 |
|
Historic period |
2019-2023 |
|
Forecast period |
2025-2029 |
|
Growth momentum & CAGR |
Accelerate at a CAGR of 6% |
|
Market growth 2025-2029 |
USD 4.73 billion |
|
Market structure |
Fragmented |
|
YoY growth 2024-2025(%) |
5.6 |
|
Key countries |
China, US, Japan, India, South Korea, Germany, UK, France, Italy, and Australia |
|
Competitive landscape |
Leading Companies, Market Positioning of Companies, Competitive Strategies, and Industry Risks |
What are the Key Data Covered in this Electric Insulator Market Research and Growth Report?
- CAGR of the Electric Insulator industry during the forecast period
- Detailed information on factors that will drive the growth and forecasting between 2025 and 2029
- Precise estimation of the size of the market and its contribution of the industry in focus to the parent market
- Accurate predictions about upcoming growth and trends and changes in consumer behaviour
- Growth of the market across APAC, Europe, North America, South America, and Middle East and Africa
- Thorough analysis of the market's competitive landscape and detailed information about companies
- Comprehensive analysis of factors that will challenge the electric insulator market growth of industry companies
We can help! Our analysts can customize this electric insulator market research report to meet your requirements.
 RIA -
RIA - 
