Electric Toothbrush Market Analysis, Size, and Forecast 2026-2030: North America (US, Canada, and Mexico), Europe (Germany, UK, and France), APAC (China, Japan, and India), Middle East and Africa (Saudi Arabia, UAE, and South Africa), South America (Brazil, Argentina, and Colombia), and Rest of World (ROW)

Electric Toothbrush Market Analysis, Size, and Forecast 2026-2030:
North America (US, Canada, and Mexico), Europe (Germany, UK, and France), APAC (China, Japan, and India), Middle East and Africa (Saudi Arabia, UAE, and South Africa), South America (Brazil, Argentina, and Colombia), and Rest of World (ROW)

Published: Mar 2026 302 Pages SKU: IRTNTR40498

Market Overview at a Glance

$2.51 B
Market Opportunity
9.4%
CAGR 2025 - 2030
42.5%
North America Growth
$2.17 B
Offline segment 2024

Electric Toothbrush Market Size 2026-2030

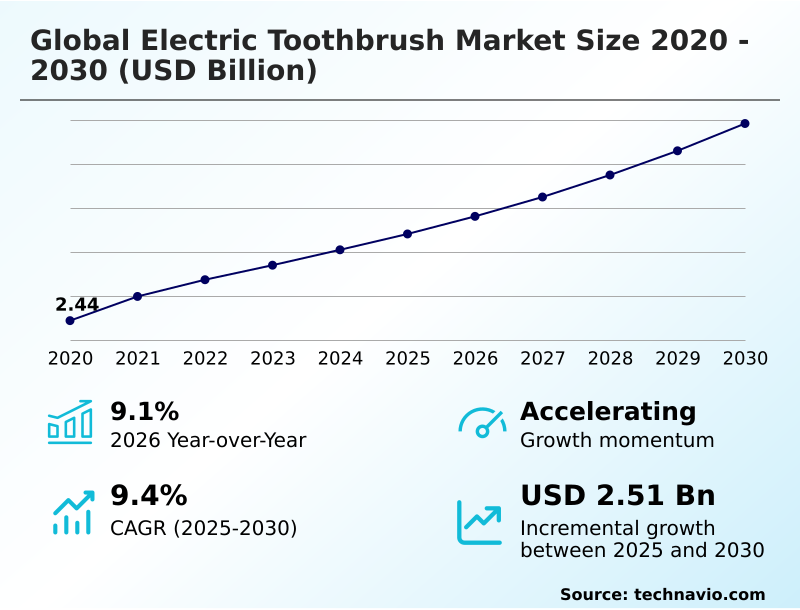
The electric toothbrush market size is valued to increase by USD 2.51 billion, at a CAGR of 9.4% from 2025 to 2030. Technological advancements and integration of smart connectivity will drive the electric toothbrush market.

Major Market Trends & Insights

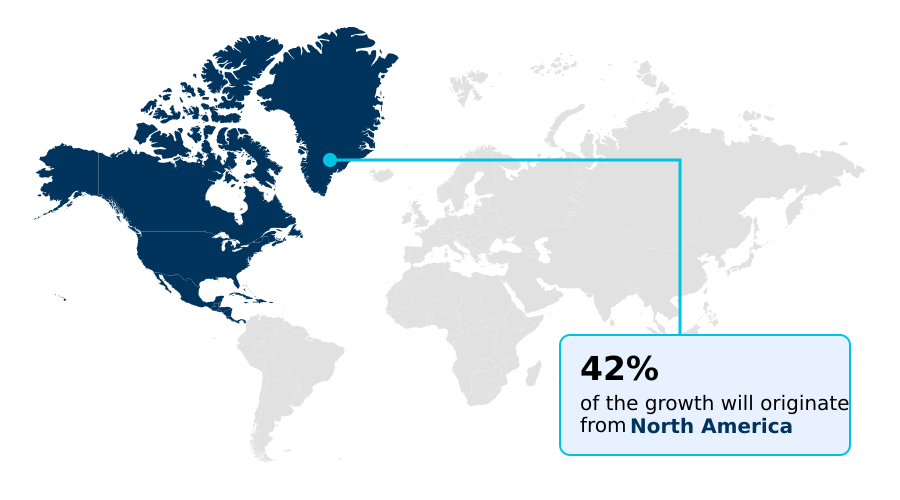
  • North America dominated the market and accounted for a 42.5% growth during the forecast period.
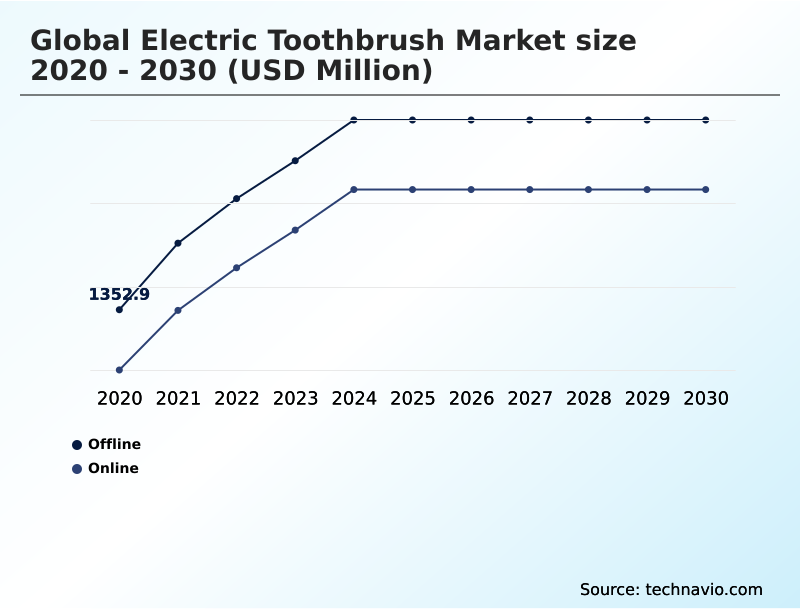
  • By Distribution Channel - Offline segment was valued at USD 2.17 billion in 2024
  • By Mobility Type - Sonic segment accounted for the largest market revenue share in 2024

Market Size & Forecast

  • Market Opportunities: USD 4.47 billion
  • Market Future Opportunities: USD 2.51 billion
  • CAGR from 2025 to 2030 : 9.4%

Market Summary

  • The electric toothbrush market is rapidly evolving from a category of simple cleaning instruments to a sophisticated ecosystem of data-driven health devices. This transformation is fueled by technological innovations like sonic vibration technology and oscillating-rotating mechanisms, which provide superior advanced plaque removal compared to manual methods.
  • A key driver is the growing consumer understanding of the link between oral health and systemic wellness, encouraging investment in devices with features like gum health monitoring and AI-driven personalization. Trends such as the integration of a biometric feedback system and AI-powered brushing coach are creating hyper-personalized user experiences.
  • For instance, in a business scenario focused on preventive healthcare, an insurance provider could partner with a device manufacturer to offer subsidized smart toothbrushes. By tracking metrics like brushing duration and coverage through app-based performance tracking, the insurer can reward consistent habits with lower premiums, reducing long-term claims costs.
  • However, the market faces challenges from the high initial cost of devices with features like a magnetic levitation motor, which can be a barrier in price-sensitive regions, and growing concerns around electronic waste, prompting a shift toward a circular economy business model.

What will be the Size of the Electric Toothbrush Market during the forecast period?

Get Key Insights on Market Forecast (PDF) Request Free Sample

How is the Electric Toothbrush Market Segmented?

The electric toothbrush industry research report provides comprehensive data (region-wise segment analysis), with forecasts and estimates in "USD million" for the period 2026-2030, as well as historical data from 2020-2024 for the following segments.

  • Distribution channel
    • Offline
    • Online
  • Mobility type
    • Sonic
    • Rotation
  • End-user
    • Adults
    • Children
  • Product type
    • Rechargeable
    • Battery
  • Geography
    • North America
      • US
      • Canada
      • Mexico
    • Europe
      • Germany
      • UK
      • France
    • APAC
      • China
      • Japan
      • India
    • Middle East and Africa
      • Saudi Arabia
      • UAE
      • South Africa
    • South America
      • Brazil
      • Argentina
      • Colombia
    • Rest of World (ROW)

By Distribution Channel Insights

The offline segment is estimated to witness significant growth during the forecast period.

The offline segment is a vital channel where consumers physically assess ergonomic handle design and the aesthetics of premium devices.

Hypermarkets and specialty stores are enhancing the retail experience by integrating digital tools, with some retailers reporting a 35% increase in shopper engagement after implementing interactive displays. These platforms offer professional dental recommendations and demonstrate features like custom brushing modes.

This strategy bridges the gap between retail and clinical-grade home care. This tactile shopping experience is indispensable for the premium segment, where factors like the noise from the internal magnetic levitation motor and device weight significantly influence purchasing decisions.

The approach supports a preventive oral healthcare mindset, encouraging investment in devices that offer long-term value and superior cleaning performance.

Request Free Sample

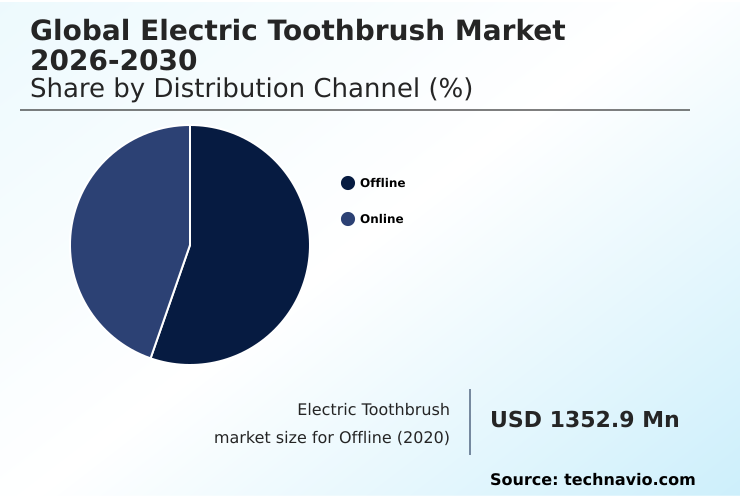
The Offline segment was valued at USD 2.17 billion in 2024 and showed a gradual increase during the forecast period.

Request Free Sample

Regional Analysis

North America is estimated to contribute 42.5% to the growth of the global market during the forecast period.Technavio’s analysts have elaborately explained the regional trends and drivers that shape the market during the forecast period.

See How Electric Toothbrush Market Demand is Rising in North America Request Free Sample

The geographic landscape of the global electric toothbrush market 2026-2030 is diverse. North America leads in adopting high-tech models with smart pressure sensors, driven by a proactive approach to preventive oral healthcare and high insurance coverage.

This region accounts for 42.5% of incremental growth. Europe emphasizes sustainability, with regulations promoting modular component replacement and a circular economy for oral care.

In the APAC region, which shows the highest CAGR at 10.3%, local manufacturers are gaining share by offering devices with competitive features like multi-axis motion sensors and wireless charging bases at lower price points.

The gamified oral hygiene routine trend is particularly strong here, driving the pediatric dental technology segment. South America and the Middle East and Africa are emerging markets with growing middle-class populations.

Market Dynamics

Our researchers analyzed the data with 2025 as the base year, along with the key drivers, trends, and challenges. A holistic analysis of drivers will help companies refine their marketing strategies to gain a competitive advantage.

  • The global electric toothbrush market 2026-2030 is increasingly segmented by specific consumer needs and technological capabilities. For instance, the debate over oscillating-rotating vs sonic technology continues, with each offering distinct benefits for advanced plaque removal. A growing niche is the electric toothbrush for sensitive gums, which requires specialized soft bristles and adjustable intensity settings.
  • Furthermore, devices designed as an electric toothbrush for orthodontic care are gaining traction, featuring unique brush heads that clean effectively around brackets and wires. A major trend is the smart toothbrush tele-dentistry integration, which allows users to share data with their dentists for remote monitoring.
  • This has led some insurance providers to explore partnerships, as consistent use of a smart toothbrush and insurance plans could lower long-term treatment costs. The push for sustainability is evident in the development of biodegradable electric toothbrush components and eco-friendly toothbrush packaging solutions. This focus on circular economy for oral care is becoming a key differentiator.
  • The choice between rechargeable vs battery-powered toothbrushes often depends on lifestyle, with rechargeable models offering better motor efficiency and advanced features like an electric toothbrush pressure sensor benefits, which prevents enamel wear. Meanwhile, the children's gamified electric toothbrush segment uses interactive apps to build healthy habits.
  • As these devices collect more data, addressing concerns around data privacy in smart toothbrushes is critical for maintaining consumer trust. Ultimately, professional electric toothbrush recommendations and subscription models for toothbrush heads remain powerful drivers of adoption.

What are the key market drivers leading to the rise in the adoption of Electric Toothbrush Industry?

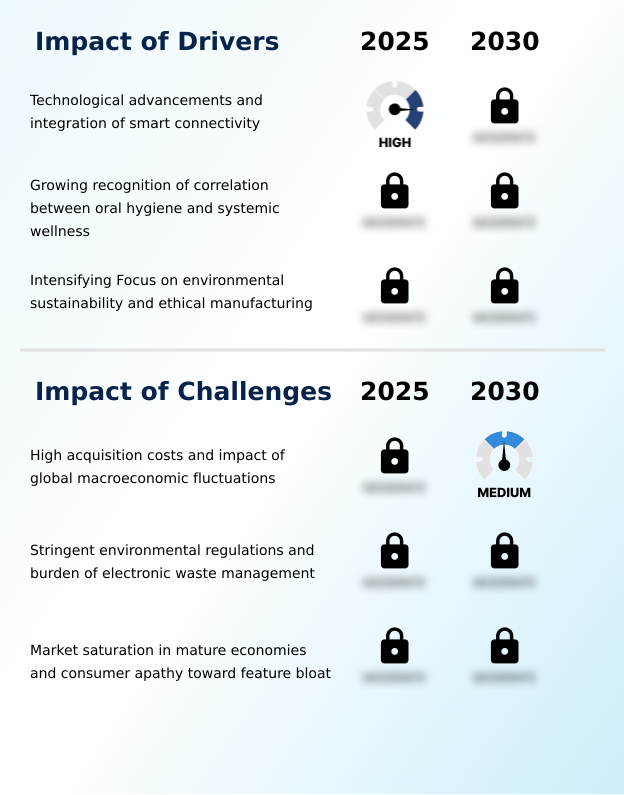
  • Technological advancements, including the integration of smart connectivity and data-driven feedback, are a primary driver of market expansion.

  • A key driver is the growing consumer awareness of the systemic health correlation with oral hygiene, supported by professional dental recommendation and research.
  • Technological advancements, such as high-frequency sound waves and advanced plaque removal capabilities, offer clinically proven benefits over manual methods.
  • The integration with digital health record synchronization systems allows for remote dental monitoring, which has shown to reduce unnecessary clinic visits by up to 25%.
  • Furthermore, the industry's focus on sustainable packaging solutions and ethical manufacturing practices resonates with a growing demographic.
  • The development of plant-based polymer housing and carbon-neutral manufacturing processes is making these devices more appealing, with some eco-friendly models seeing a 40% faster adoption rate.

What are the market trends shaping the Electric Toothbrush Industry?

  • An emerging trend is the integration of advanced biometric sensors for real-time analysis, complemented by artificial intelligence-driven coaching to deliver hyper-personalized oral hygiene.

  • The market is witnessing a shift toward hyper-personalization through the integration of advanced biometric feedback systems and AI-powered brushing coach technology. This evolution transforms the device from a simple cleaning tool into a health monitoring instrument capable of oral microbiome analysis.
  • For example, some devices now feature saliva composition analysis, providing data-driven hygiene insights that can be shared via tele-dentistry platform integration. The use of digital mouth mapping allows for a personalized dental care plan, with some platforms demonstrating an 18% improvement in user adherence to recommended routines.
  • This focus on verifiable eco-certification and user data privacy protocol is redefining consumer expectations for clinical-grade home care.

What challenges does the Electric Toothbrush Industry face during its growth?

  • High initial acquisition costs for advanced models, compounded by the impact of global macroeconomic fluctuations on consumer spending, present a key challenge to market growth.

  • A primary challenge is the high acquisition cost, which hinders adoption in markets with economic volatility. This is compounded by the ongoing expense of proprietary replacement heads for devices featuring oscillating-rotating mechanisms or water flossing integration. In mature markets, consumer apathy toward feature bloat presents another hurdle; a recent survey showed over 60% of users ignore advanced app-based performance tracking.
  • Additionally, the industry faces pressure from tightening environmental regulations concerning electronic waste reduction and the need for a viable circular economy business model. The complexity of recycling units with non-removable solid-state battery technology adds logistical costs and challenges supply chain transparency efforts.

Exclusive Technavio Analysis on Customer Landscape

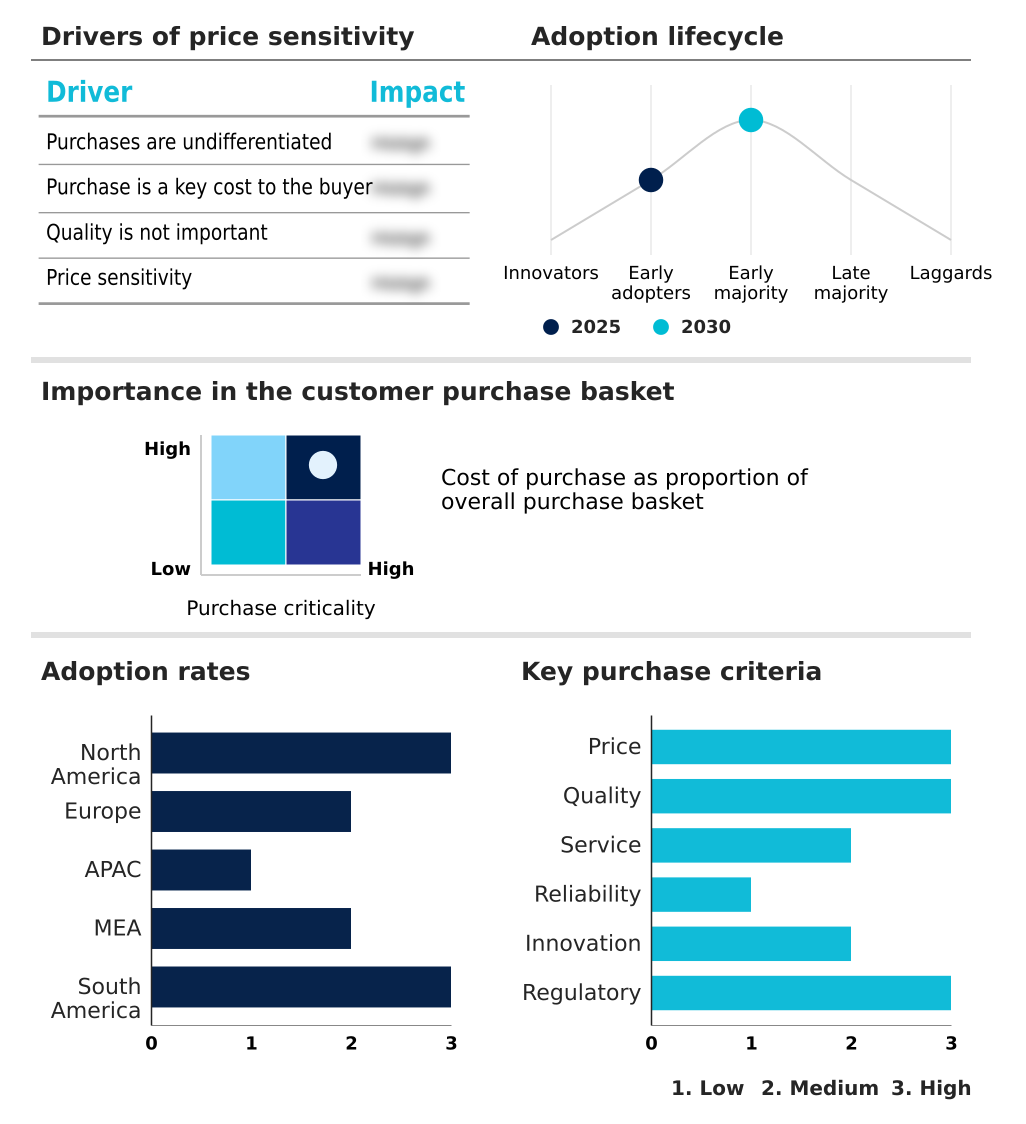
The electric toothbrush market forecasting report includes the adoption lifecycle of the market, covering from the innovator’s stage to the laggard’s stage. It focuses on adoption rates in different regions based on penetration. Furthermore, the electric toothbrush market report also includes key purchase criteria and drivers of price sensitivity to help companies evaluate and develop their market growth analysis strategies.

Customer Landscape of Electric Toothbrush Industry

Competitive Landscape

Companies are implementing various strategies, such as strategic alliances, electric toothbrush market forecast, partnerships, mergers and acquisitions, geographical expansion, and product/service launches, to enhance their presence in the industry.

Boka - Electric toothbrushes featuring charcoal-infused bristles, developed with dental professionals to provide effective, gentle cleaning, are a key market offering.

The industry research and growth report includes detailed analyses of the competitive landscape of the market and information about key companies, including:

  • Boka
  • BURST.USA Inc.
  • Colgate Palmolive Co.
  • Den Mat Holdings LLC
  • Fairywill
  • FOREO AB
  • Koninklijke Philips NV
  • Lion Corp.
  • Moon Oral Beauty
  • Oclean
  • Oral B
  • Panasonic Holdings Corp.
  • Perrigo Co. Plc
  • Quip NYC Inc.
  • Spotlight Oral Care
  • Sunstar Suisse SA
  • usmile
  • Water Pik Inc.
  • Xiaomi Corp.

Qualitative and quantitative analysis of companies has been conducted to help clients understand the wider business environment as well as the strengths and weaknesses of key industry players. Data is qualitatively analyzed to categorize companies as pure play, category-focused, industry-focused, and diversified; it is quantitatively analyzed to categorize companies as dominant, leading, strong, tentative, and weak.

Recent Development and News in Electric toothbrush market

  • In August 2025, a European national health service launched a public campaign recommending oscillating-rotating technology for patients at high risk of periodontal disease.
  • In May 2025, a major US-based oral care brand launched a mobile application that uses computer vision to create a digital mouth mapping for personalized haptic guidance.
  • In March 2025, a California-based software developer released an API enabling direct digital health record synchronization from smart toothbrushes.
  • In April 2025, a report on rural health infrastructure in Southeast Asia highlighted that inconsistent access to reliable electricity remains a major barrier to the adoption of rechargeable oral care products.

Dive into Technavio’s robust research methodology, blending expert interviews, extensive data synthesis, and validated models for unparalleled Electric Toothbrush Market insights. See full methodology.

Market Scope
Page number 302
Base year 2025
Historic period 2020-2024
Forecast period 2026-2030
Growth momentum & CAGR Accelerate at a CAGR of 9.4%
Market growth 2026-2030 USD 2510.9 million
Market structure Fragmented
YoY growth 2025-2026(%) 9.1%
Key countries US, Canada, Mexico, Germany, UK, France, Italy, Spain, The Netherlands, China, Japan, India, South Korea, Australia, Indonesia, Saudi Arabia, UAE, South Africa, Israel, Turkey, Brazil, Argentina and Colombia
Competitive landscape Leading Companies, Market Positioning of Companies, Competitive Strategies, and Industry Risks

Request Free Sample

Research Analyst Overview

  • The market is defined by rapid innovation in core components, including the piezoelectric ceramic transducers and magnetic levitation motor, which enhance both performance and user comfort. The shift toward devices with an interactive display interface and custom brushing modes reflects a demand for greater user control and a personalized experience.
  • A key boardroom consideration is the pivot to sustainable and ethical production, with companies investing in carbon-neutral manufacturing and plant-based polymer housing to meet regulatory demands and consumer expectations. This strategic shift has led to a 15% increase in brand loyalty among environmentally conscious consumers.
  • Features like wireless charging bases, water flossing integration, and UV-C brush head sterilization are becoming standard in premium models. The integration of advanced sensors for real-time coverage tracking and saliva composition analysis, coupled with an AI-powered brushing coach, transforms these devices into tools for proactive gum health monitoring and advanced plaque removal, blurring the lines between consumer electronics and medical devices.

What are the Key Data Covered in this Electric Toothbrush Market Research and Growth Report?

  • What is the expected growth of the Electric Toothbrush Market between 2026 and 2030?

    • USD 2.51 billion, at a CAGR of 9.4%

  • What segmentation does the market report cover?

    • The report is segmented by Distribution Channel (Offline, and Online), Mobility Type (Sonic, and Rotation), End-user (Adults, and Children), Product Type (Rechargeable, and Battery) and Geography (North America, Europe, APAC, Middle East and Africa, South America)

  • Which regions are analyzed in the report?

    • North America, Europe, APAC, Middle East and Africa and South America

  • What are the key growth drivers and market challenges?

    • Technological advancements and integration of smart connectivity, High acquisition costs and impact of global macroeconomic fluctuations

  • Who are the major players in the Electric Toothbrush Market?

    • Boka, BURST.USA Inc., Colgate Palmolive Co., Den Mat Holdings LLC, Fairywill, FOREO AB, Koninklijke Philips NV, Lion Corp., Moon Oral Beauty, Oclean, Oral B, Panasonic Holdings Corp., Perrigo Co. Plc, Quip NYC Inc., Spotlight Oral Care, Sunstar Suisse SA, usmile, Water Pik Inc. and Xiaomi Corp.

Market Research Insights

  • Market dynamics are shaped by the convergence of technology and wellness. The integration of devices into a broader smart home ecosystem connectivity framework has improved user engagement by over 20%. A significant shift is the adoption of a subscription-based replenishment service for brush heads, which improves customer retention by 30% compared to one-time purchases.
  • The trend toward a personalized dental care plan is supported by data from devices, which allows for customized recommendations. While high-end models offer sophisticated features, the market is also driven by the availability of affordable, effective options for orthodontic patient solutions and pediatric dental technology, expanding the user base.
  • This strategic diversification ensures relevance across different consumer segments and price points.

We can help! Our analysts can customize this electric toothbrush market research report to meet your requirements.

Get in touch

1. Executive Summary

1.1 Market overview

Executive Summary - Chart on Market Overview
Executive Summary - Data Table on Market Overview
Executive Summary - Chart on Global Market Characteristics
Executive Summary - Chart on Market by Geography
Executive Summary - Chart on Market Segmentation by Distribution Channel
Executive Summary - Chart on Market Segmentation by Mobility Type
Executive Summary - Chart on Market Segmentation by End-user
Executive Summary - Chart on Market Segmentation by Product Type
Executive Summary - Chart on Incremental Growth
Executive Summary - Data Table on Incremental Growth
Executive Summary - Chart on Company Market Positioning

2. Technavio Analysis

2.1 Analysis of price sensitivity, lifecycle, customer purchase basket, adoption rates, and purchase criteria

2.2 Criticality of inputs and Factors of differentiation

Chart on Overview on criticality of inputs and factors of differentiation

2.3 Factors of disruption

Chart on Overview on factors of disruption

2.4 Impact of drivers and challenges

Chart on Impact of drivers and challenges in 2025 and 2030

3. Market Landscape

3.1 Market ecosystem

Chart on Parent Market
Data Table on - Parent Market

3.2 Market characteristics

Chart on Market characteristics analysis

3.3 Value chain analysis

Chart on Value chain analysis

4. Market Sizing

4.1 Market definition

Data Table on Offerings of companies included in the market definition

4.2 Market segment analysis

Market segments

4.3 Market size 2025

4.4 Market outlook: Forecast for 2025-2030

Chart on Global - Market size and forecast 2025-2030 ($ million)
Data Table on Global - Market size and forecast 2025-2030 ($ million)
Chart on Global Market: Year-over-year growth 2025-2030 (%)
Data Table on Global Market: Year-over-year growth 2025-2030 (%)

5. Historic Market Size

5.1 Global Electric Toothbrush Market 2020 - 2024

Historic Market Size - Data Table on Global Electric Toothbrush Market 2020 - 2024 ($ million)

5.2 Distribution Channel segment analysis 2020 - 2024

Historic Market Size - Distribution Channel Segment 2020 - 2024 ($ million)

5.3 Mobility Type segment analysis 2020 - 2024

Historic Market Size - Mobility Type Segment 2020 - 2024 ($ million)

5.4 End-user segment analysis 2020 - 2024

Historic Market Size - End-user Segment 2020 - 2024 ($ million)

5.5 Product Type segment analysis 2020 - 2024

Historic Market Size - Product Type Segment 2020 - 2024 ($ million)

5.6 Geography segment analysis 2020 - 2024

Historic Market Size - Geography Segment 2020 - 2024 ($ million)

5.7 Country segment analysis 2020 - 2024

Historic Market Size - Country Segment 2020 - 2024 ($ million)

6. Qualitative Analysis

6.1 Impact of AI in the Global Electric Toothbrush Market

7. Five Forces Analysis

7.1 Five forces summary

Five forces analysis - Comparison between 2025 and 2030

7.2 Bargaining power of buyers

Bargaining power of buyers - Impact of key factors 2025 and 2030

7.3 Bargaining power of suppliers

Bargaining power of suppliers - Impact of key factors in 2025 and 2030

7.4 Threat of new entrants

Threat of new entrants - Impact of key factors in 2025 and 2030

7.5 Threat of substitutes

Threat of substitutes - Impact of key factors in 2025 and 2030

7.6 Threat of rivalry

Threat of rivalry - Impact of key factors in 2025 and 2030

7.7 Market condition

Chart on Market condition - Five forces 2025 and 2030

8. Market Segmentation by Distribution Channel

8.1 Market segments

Chart on Distribution Channel - Market share 2025-2030 (%)
Data Table on Distribution Channel - Market share 2025-2030 (%)

8.2 Comparison by Distribution Channel

Chart on Comparison by Distribution Channel
Data Table on Comparison by Distribution Channel

8.3 Offline - Market size and forecast 2025-2030

Chart on Offline - Market size and forecast 2025-2030 ($ million)
Data Table on Offline - Market size and forecast 2025-2030 ($ million)
Chart on Offline - Year-over-year growth 2025-2030 (%)
Data Table on Offline - Year-over-year growth 2025-2030 (%)

8.4 Online - Market size and forecast 2025-2030

Chart on Online - Market size and forecast 2025-2030 ($ million)
Data Table on Online - Market size and forecast 2025-2030 ($ million)
Chart on Online - Year-over-year growth 2025-2030 (%)
Data Table on Online - Year-over-year growth 2025-2030 (%)

8.5 Market opportunity by Distribution Channel

Market opportunity by Distribution Channel ($ million)
Data Table on Market opportunity by Distribution Channel ($ million)

9. Market Segmentation by Mobility Type

9.1 Market segments

Chart on Mobility Type - Market share 2025-2030 (%)
Data Table on Mobility Type - Market share 2025-2030 (%)

9.2 Comparison by Mobility Type

Chart on Comparison by Mobility Type
Data Table on Comparison by Mobility Type

9.3 Sonic - Market size and forecast 2025-2030

Chart on Sonic - Market size and forecast 2025-2030 ($ million)
Data Table on Sonic - Market size and forecast 2025-2030 ($ million)
Chart on Sonic - Year-over-year growth 2025-2030 (%)
Data Table on Sonic - Year-over-year growth 2025-2030 (%)

9.4 Rotation - Market size and forecast 2025-2030

Chart on Rotation - Market size and forecast 2025-2030 ($ million)
Data Table on Rotation - Market size and forecast 2025-2030 ($ million)
Chart on Rotation - Year-over-year growth 2025-2030 (%)
Data Table on Rotation - Year-over-year growth 2025-2030 (%)

9.5 Market opportunity by Mobility Type

Market opportunity by Mobility Type ($ million)
Data Table on Market opportunity by Mobility Type ($ million)

10. Market Segmentation by End-user

10.1 Market segments

Chart on End-user - Market share 2025-2030 (%)
Data Table on End-user - Market share 2025-2030 (%)

10.2 Comparison by End-user

Chart on Comparison by End-user
Data Table on Comparison by End-user

10.3 Adults - Market size and forecast 2025-2030

Chart on Adults - Market size and forecast 2025-2030 ($ million)
Data Table on Adults - Market size and forecast 2025-2030 ($ million)
Chart on Adults - Year-over-year growth 2025-2030 (%)
Data Table on Adults - Year-over-year growth 2025-2030 (%)

10.4 Children - Market size and forecast 2025-2030

Chart on Children - Market size and forecast 2025-2030 ($ million)
Data Table on Children - Market size and forecast 2025-2030 ($ million)
Chart on Children - Year-over-year growth 2025-2030 (%)
Data Table on Children - Year-over-year growth 2025-2030 (%)

10.5 Market opportunity by End-user

Market opportunity by End-user ($ million)
Data Table on Market opportunity by End-user ($ million)

11. Market Segmentation by Product Type

11.1 Market segments

Chart on Product Type - Market share 2025-2030 (%)
Data Table on Product Type - Market share 2025-2030 (%)

11.2 Comparison by Product Type

Chart on Comparison by Product Type
Data Table on Comparison by Product Type

11.3 Rechargeable - Market size and forecast 2025-2030

Chart on Rechargeable - Market size and forecast 2025-2030 ($ million)
Data Table on Rechargeable - Market size and forecast 2025-2030 ($ million)
Chart on Rechargeable - Year-over-year growth 2025-2030 (%)
Data Table on Rechargeable - Year-over-year growth 2025-2030 (%)

11.4 Battery - Market size and forecast 2025-2030

Chart on Battery - Market size and forecast 2025-2030 ($ million)
Data Table on Battery - Market size and forecast 2025-2030 ($ million)
Chart on Battery - Year-over-year growth 2025-2030 (%)
Data Table on Battery - Year-over-year growth 2025-2030 (%)

11.5 Market opportunity by Product Type

Market opportunity by Product Type ($ million)
Data Table on Market opportunity by Product Type ($ million)

12. Customer Landscape

12.1 Customer landscape overview

Analysis of price sensitivity, lifecycle, customer purchase basket, adoption rates, and purchase criteria

13. Geographic Landscape

13.1 Geographic segmentation

Chart on Market share by geography 2025-2030 (%)
Data Table on Market share by geography 2025-2030 (%)

13.2 Geographic comparison

Chart on Geographic comparison
Data Table on Geographic comparison

13.3 North America - Market size and forecast 2025-2030

Chart on North America - Market size and forecast 2025-2030 ($ million)
Data Table on North America - Market size and forecast 2025-2030 ($ million)
Chart on North America - Year-over-year growth 2025-2030 (%)
Data Table on North America - Year-over-year growth 2025-2030 (%)
Chart on Regional Comparison - North America
Data Table on Regional Comparison - North America

13.3.1 US - Market size and forecast 2025-2030

Chart on US - Market size and forecast 2025-2030 ($ million)
Data Table on US - Market size and forecast 2025-2030 ($ million)
Chart on US - Year-over-year growth 2025-2030 (%)
Data Table on US - Year-over-year growth 2025-2030 (%)

13.3.2 Canada - Market size and forecast 2025-2030

Chart on Canada - Market size and forecast 2025-2030 ($ million)
Data Table on Canada - Market size and forecast 2025-2030 ($ million)
Chart on Canada - Year-over-year growth 2025-2030 (%)
Data Table on Canada - Year-over-year growth 2025-2030 (%)

13.3.3 Mexico - Market size and forecast 2025-2030

Chart on Mexico - Market size and forecast 2025-2030 ($ million)
Data Table on Mexico - Market size and forecast 2025-2030 ($ million)
Chart on Mexico - Year-over-year growth 2025-2030 (%)
Data Table on Mexico - Year-over-year growth 2025-2030 (%)

13.4 Europe - Market size and forecast 2025-2030

Chart on Europe - Market size and forecast 2025-2030 ($ million)
Data Table on Europe - Market size and forecast 2025-2030 ($ million)
Chart on Europe - Year-over-year growth 2025-2030 (%)
Data Table on Europe - Year-over-year growth 2025-2030 (%)
Chart on Regional Comparison - Europe
Data Table on Regional Comparison - Europe

13.4.1 Germany - Market size and forecast 2025-2030

Chart on Germany - Market size and forecast 2025-2030 ($ million)
Data Table on Germany - Market size and forecast 2025-2030 ($ million)
Chart on Germany - Year-over-year growth 2025-2030 (%)
Data Table on Germany - Year-over-year growth 2025-2030 (%)

13.4.2 UK - Market size and forecast 2025-2030

Chart on UK - Market size and forecast 2025-2030 ($ million)
Data Table on UK - Market size and forecast 2025-2030 ($ million)
Chart on UK - Year-over-year growth 2025-2030 (%)
Data Table on UK - Year-over-year growth 2025-2030 (%)

13.4.3 France - Market size and forecast 2025-2030

Chart on France - Market size and forecast 2025-2030 ($ million)
Data Table on France - Market size and forecast 2025-2030 ($ million)
Chart on France - Year-over-year growth 2025-2030 (%)
Data Table on France - Year-over-year growth 2025-2030 (%)

13.4.4 Italy - Market size and forecast 2025-2030

Chart on Italy - Market size and forecast 2025-2030 ($ million)
Data Table on Italy - Market size and forecast 2025-2030 ($ million)
Chart on Italy - Year-over-year growth 2025-2030 (%)
Data Table on Italy - Year-over-year growth 2025-2030 (%)

13.4.5 Spain - Market size and forecast 2025-2030

Chart on Spain - Market size and forecast 2025-2030 ($ million)
Data Table on Spain - Market size and forecast 2025-2030 ($ million)
Chart on Spain - Year-over-year growth 2025-2030 (%)
Data Table on Spain - Year-over-year growth 2025-2030 (%)

13.4.6 The Netherlands - Market size and forecast 2025-2030

Chart on The Netherlands - Market size and forecast 2025-2030 ($ million)
Data Table on The Netherlands - Market size and forecast 2025-2030 ($ million)
Chart on The Netherlands - Year-over-year growth 2025-2030 (%)
Data Table on The Netherlands - Year-over-year growth 2025-2030 (%)

13.5 APAC - Market size and forecast 2025-2030

Chart on APAC - Market size and forecast 2025-2030 ($ million)
Data Table on APAC - Market size and forecast 2025-2030 ($ million)
Chart on APAC - Year-over-year growth 2025-2030 (%)
Data Table on APAC - Year-over-year growth 2025-2030 (%)
Chart on Regional Comparison - APAC
Data Table on Regional Comparison - APAC

13.5.1 China - Market size and forecast 2025-2030

Chart on China - Market size and forecast 2025-2030 ($ million)
Data Table on China - Market size and forecast 2025-2030 ($ million)
Chart on China - Year-over-year growth 2025-2030 (%)
Data Table on China - Year-over-year growth 2025-2030 (%)

13.5.2 Japan - Market size and forecast 2025-2030

Chart on Japan - Market size and forecast 2025-2030 ($ million)
Data Table on Japan - Market size and forecast 2025-2030 ($ million)
Chart on Japan - Year-over-year growth 2025-2030 (%)
Data Table on Japan - Year-over-year growth 2025-2030 (%)

13.5.3 India - Market size and forecast 2025-2030

Chart on India - Market size and forecast 2025-2030 ($ million)
Data Table on India - Market size and forecast 2025-2030 ($ million)
Chart on India - Year-over-year growth 2025-2030 (%)
Data Table on India - Year-over-year growth 2025-2030 (%)

13.5.4 South Korea - Market size and forecast 2025-2030

Chart on South Korea - Market size and forecast 2025-2030 ($ million)
Data Table on South Korea - Market size and forecast 2025-2030 ($ million)
Chart on South Korea - Year-over-year growth 2025-2030 (%)
Data Table on South Korea - Year-over-year growth 2025-2030 (%)

13.5.5 Australia - Market size and forecast 2025-2030

Chart on Australia - Market size and forecast 2025-2030 ($ million)
Data Table on Australia - Market size and forecast 2025-2030 ($ million)
Chart on Australia - Year-over-year growth 2025-2030 (%)
Data Table on Australia - Year-over-year growth 2025-2030 (%)

13.5.6 Indonesia - Market size and forecast 2025-2030

Chart on Indonesia - Market size and forecast 2025-2030 ($ million)
Data Table on Indonesia - Market size and forecast 2025-2030 ($ million)
Chart on Indonesia - Year-over-year growth 2025-2030 (%)
Data Table on Indonesia - Year-over-year growth 2025-2030 (%)

13.6 Middle East and Africa - Market size and forecast 2025-2030

Chart on Middle East and Africa - Market size and forecast 2025-2030 ($ million)
Data Table on Middle East and Africa - Market size and forecast 2025-2030 ($ million)
Chart on Middle East and Africa - Year-over-year growth 2025-2030 (%)
Data Table on Middle East and Africa - Year-over-year growth 2025-2030 (%)
Chart on Regional Comparison - Middle East and Africa
Data Table on Regional Comparison - Middle East and Africa

13.6.1 Saudi Arabia - Market size and forecast 2025-2030

Chart on Saudi Arabia - Market size and forecast 2025-2030 ($ million)
Data Table on Saudi Arabia - Market size and forecast 2025-2030 ($ million)
Chart on Saudi Arabia - Year-over-year growth 2025-2030 (%)
Data Table on Saudi Arabia - Year-over-year growth 2025-2030 (%)

13.6.2 UAE - Market size and forecast 2025-2030

Chart on UAE - Market size and forecast 2025-2030 ($ million)
Data Table on UAE - Market size and forecast 2025-2030 ($ million)
Chart on UAE - Year-over-year growth 2025-2030 (%)
Data Table on UAE - Year-over-year growth 2025-2030 (%)

13.6.3 South Africa - Market size and forecast 2025-2030

Chart on South Africa - Market size and forecast 2025-2030 ($ million)
Data Table on South Africa - Market size and forecast 2025-2030 ($ million)
Chart on South Africa - Year-over-year growth 2025-2030 (%)
Data Table on South Africa - Year-over-year growth 2025-2030 (%)

13.6.4 Israel - Market size and forecast 2025-2030

Chart on Israel - Market size and forecast 2025-2030 ($ million)
Data Table on Israel - Market size and forecast 2025-2030 ($ million)
Chart on Israel - Year-over-year growth 2025-2030 (%)
Data Table on Israel - Year-over-year growth 2025-2030 (%)

13.6.5 Turkey - Market size and forecast 2025-2030

Chart on Turkey - Market size and forecast 2025-2030 ($ million)
Data Table on Turkey - Market size and forecast 2025-2030 ($ million)
Chart on Turkey - Year-over-year growth 2025-2030 (%)
Data Table on Turkey - Year-over-year growth 2025-2030 (%)

13.7 South America - Market size and forecast 2025-2030

Chart on South America - Market size and forecast 2025-2030 ($ million)
Data Table on South America - Market size and forecast 2025-2030 ($ million)
Chart on South America - Year-over-year growth 2025-2030 (%)
Data Table on South America - Year-over-year growth 2025-2030 (%)
Chart on Regional Comparison - South America
Data Table on Regional Comparison - South America

13.7.1 Brazil - Market size and forecast 2025-2030

Chart on Brazil - Market size and forecast 2025-2030 ($ million)
Data Table on Brazil - Market size and forecast 2025-2030 ($ million)
Chart on Brazil - Year-over-year growth 2025-2030 (%)
Data Table on Brazil - Year-over-year growth 2025-2030 (%)

13.7.2 Argentina - Market size and forecast 2025-2030

Chart on Argentina - Market size and forecast 2025-2030 ($ million)
Data Table on Argentina - Market size and forecast 2025-2030 ($ million)
Chart on Argentina - Year-over-year growth 2025-2030 (%)
Data Table on Argentina - Year-over-year growth 2025-2030 (%)

13.7.3 Colombia - Market size and forecast 2025-2030

Chart on Colombia - Market size and forecast 2025-2030 ($ million)
Data Table on Colombia - Market size and forecast 2025-2030 ($ million)
Chart on Colombia - Year-over-year growth 2025-2030 (%)
Data Table on Colombia - Year-over-year growth 2025-2030 (%)

13.8 Market opportunity by geography

Market opportunity by geography ($ million)
Data Tables on Market opportunity by geography ($ million)

14. Drivers, Challenges, and Opportunity

14.1 Market drivers

Technological advancements and integration of smart connectivity
Growing recognition of correlation between oral hygiene and systemic wellness
Intensifying Focus on environmental sustainability and ethical manufacturing

14.2 Market challenges

High acquisition costs and impact of global macroeconomic fluctuations
Stringent environmental regulations and burden of electronic waste management
Market saturation in mature economies and consumer apathy toward feature bloat

14.3 Impact of drivers and challenges

Impact of drivers and challenges in 2025 and 2030

14.4 Market opportunities

Integration of advanced biometric sensors and AI coaching
Transition toward fully biodegradable components and circular economy models
Convergence of oral care and broader tele-dentistry ecosystem

15. Competitive Landscape

15.1 Overview

15.2

Overview on criticality of inputs and factors of differentiation

15.3 Landscape disruption

Overview on factors of disruption

15.4 Industry risks

Impact of key risks on business

16. Competitive Analysis

16.1 Companies profiled

Companies covered

16.2 Company ranking index

16.3 Market positioning of companies

Matrix on companies position and classification

16.4 BURST.USA Inc.

BURST.USA Inc. - Overview
BURST.USA Inc. - Product / Service
BURST.USA Inc. - Key offerings
SWOT

16.5 Colgate Palmolive Co.

Colgate Palmolive Co. - Overview
Colgate Palmolive Co. - Business segments
Colgate Palmolive Co. - Key news
Colgate Palmolive Co. - Key offerings
Colgate Palmolive Co. - Segment focus
SWOT

16.6 Den Mat Holdings LLC

Den Mat Holdings LLC - Overview
Den Mat Holdings LLC - Product / Service
Den Mat Holdings LLC - Key offerings
SWOT

16.7 Fairywill

Fairywill - Overview
Fairywill - Product / Service
Fairywill - Key offerings
SWOT

16.8 FOREO AB

FOREO AB - Overview
FOREO AB - Product / Service
FOREO AB - Key offerings
SWOT

16.9 Koninklijke Philips NV

Koninklijke Philips NV - Overview
Koninklijke Philips NV - Business segments
Koninklijke Philips NV - Key news
Koninklijke Philips NV - Key offerings
Koninklijke Philips NV - Segment focus
SWOT

16.10 Lion Corp.

Lion Corp. - Overview
Lion Corp. - Business segments
Lion Corp. - Key news
Lion Corp. - Key offerings
Lion Corp. - Segment focus
SWOT

16.11 Oclean

Oclean - Overview
Oclean - Product / Service
Oclean - Key offerings
SWOT

16.12 Oral B

Oral B - Overview
Oral B - Product / Service
Oral B - Key offerings
SWOT

16.13 Panasonic Holdings Corp.

Panasonic Holdings Corp. - Overview
Panasonic Holdings Corp. - Business segments
Panasonic Holdings Corp. - Key news
Panasonic Holdings Corp. - Key offerings
Panasonic Holdings Corp. - Segment focus
SWOT

16.14 Quip NYC Inc.

Quip NYC Inc. - Overview
Quip NYC Inc. - Product / Service
Quip NYC Inc. - Key offerings
SWOT

16.15 Sunstar Suisse SA

Sunstar Suisse SA - Overview
Sunstar Suisse SA - Product / Service
Sunstar Suisse SA - Key offerings
SWOT

16.16 usmile

usmile - Overview
usmile - Product / Service
usmile - Key offerings
SWOT

16.17 Water Pik Inc.

Water Pik Inc. - Overview
Water Pik Inc. - Product / Service
Water Pik Inc. - Key offerings
SWOT

16.18 Xiaomi Corp.

Xiaomi Corp. - Overview
Xiaomi Corp. - Business segments
Xiaomi Corp. - Key news
Xiaomi Corp. - Key offerings
Xiaomi Corp. - Segment focus
SWOT

17. Appendix

17.1 Scope of the report

Market definition
Objectives
Notes and caveats

17.2 Inclusions and exclusions checklist

Inclusions checklist
Exclusions checklist

17.3 Currency conversion rates for US$

17.4 Research methodology

17.5 Data procurement

Information sources

17.6 Data validation

17.7 Validation techniques employed for market sizing

17.8 Data synthesis

17.9 360 degree market analysis

17.10 List of abbreviations

Research Methodology

Technavio presents a detailed picture of the market by way of study, synthesis, and summation of data from multiple sources. The analysts have presented the various facets of the market with a particular focus on identifying the key industry influencers. The data thus presented is comprehensive, reliable, and the result of extensive research, both primary and secondary.

INFORMATION SOURCES

Primary sources

  • Manufacturers and suppliers
  • Channel partners
  • Industry experts
  • Strategic decision makers

Secondary sources

  • Industry journals and periodicals
  • Government data
  • Financial reports of key industry players
  • Historical data
  • Press releases

DATA ANALYSIS

Data Synthesis

  • Collation of data
  • Estimation of key figures
  • Analysis of derived insights

Data Validation

  • Triangulation with data models
  • Reference against proprietary databases
  • Corroboration with industry experts

REPORT WRITING

Qualitative

  • Market drivers
  • Market challenges
  • Market trends
  • Five forces analysis

Quantitative

  • Market size and forecast
  • Market segmentation
  • Geographical insights
  • Competitive landscape

Interested in this report?

Get your sample now to see our research methodology and insights!

Download Now

Frequently Asked Questions

Electric Toothbrush market growth will increase by USD 2510.9 million during 2026-2030.

The Electric Toothbrush market is expected to grow at a CAGR of 9.4% during 2026-2030.

Electric Toothbrush market is segmented by Distribution channel (Offline, Online) Mobility type (Sonic, Rotation) End-user (Adults, Children) Product type (Rechargeable, Battery)

Boka, BURST.USA Inc., Colgate Palmolive Co., Den Mat Holdings LLC, Fairywill, FOREO AB, Koninklijke Philips NV, Lion Corp., Moon Oral Beauty, Oclean, Oral B, Panasonic Holdings Corp., Perrigo Co. Plc, Quip NYC Inc., Spotlight Oral Care, Sunstar Suisse SA, usmile, Water Pik Inc., Xiaomi Corp. are a few of the key vendors in the Electric Toothbrush market.

North America will register the highest growth rate of 42.5% among the other regions. Therefore, the Electric Toothbrush market in North America is expected to garner significant business opportunities for the vendors during the forecast period.

US, Canada, Mexico, Germany, UK, France, Italy, Spain, The Netherlands, China, Japan, India, South Korea, Australia, Indonesia, Saudi Arabia, UAE, South Africa, Israel, Turkey, Brazil, Argentina, Colombia

  • Technological advancements and integration of smart connectivity is the driving factor this market.

The Electric Toothbrush market vendors should focus on grabbing business opportunities from the Distribution channel segment as it accounted for the largest market share in the base year.
RIA - Research AI Assistant
Ask RIA