Electric Tuk Tuks Market Size 2025-2029
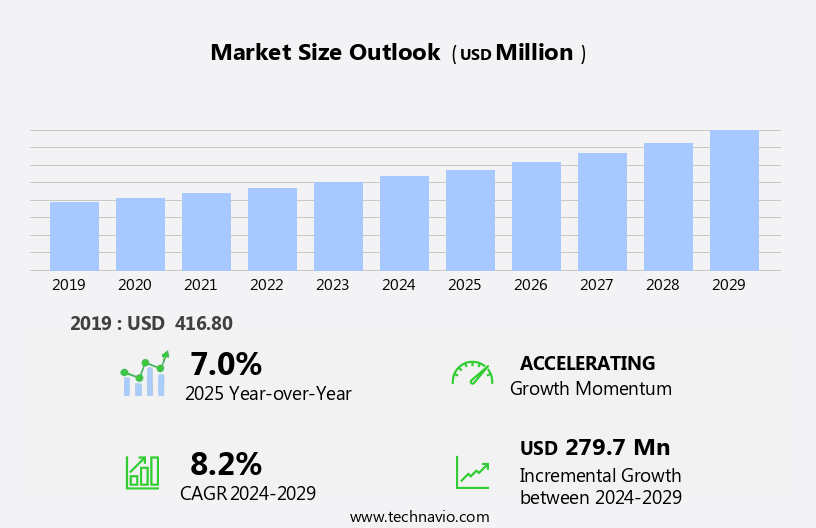
The electric tuk tuks market size is forecast to increase by USD 279.7 million at a CAGR of 8.2% between 2024 and 2029.
- The Electric Tuk Tuk market is experiencing significant growth, driven by the increasing adoption of sustainable transportation solutions and the expanding rental and subscription-based models. These models offer affordability and flexibility, making it an attractive option for both consumers and businesses. Furthermore, the integration of nto ride-sharing and e-hailing platforms is revolutionizing the transportation industry, providing new opportunities for market expansion. However, challenges persist, particularly in regions with limited range and charging infrastructure availability. Addressing these challenges through strategic investments in infrastructure and technology will be crucial for market players seeking to capitalize on the growing demand and navigate the competitive landscape effectively. The expansion of rental and subscription-based models is a major trend, making these electric vehicles more accessible and affordable for consumers. Additionally, the integration into ride-sharing and e-hailing platforms is increasing their popularity and usage.
- Companies can also explore collaborations and partnerships to expand their reach and offer comprehensive solutions to meet the evolving needs of consumers and regulatory bodies. Overall, the market presents a compelling investment opportunity for those seeking to contribute to sustainable transportation solutions and capitalize on the growing demand for electric vehicles in the transportation sector.
What will be the Size of the Electric Tuk Tuks Market during the forecast period?
- The market is experiencing significant growth as part of the global shift towards electric mobility in the transportation landscape. Three-wheeled electric vehicles, also known as electric tuk tuks, are gaining popularity as sustainable and cost-effective transportation solutions in various regions. Driven by the need to reduce carbon emissions and mitigate air pollution, fleet operators are increasingly turning it as an alternative to traditional fuel-powered vehicles. The market's expansion is influenced by factors such as fuel shortages, economic strain, and increasing concerns over greenhouse gas emissions. Electric motors, powered by advanced battery technologies, offer a viable solution to these challenges.
How is this Electric Tuk Tuks Industry segmented?
The report provides comprehensive data (region-wise segment analysis), with forecasts and estimates in "USD million" for the period 2025-2029, as well as historical data from 2019-2023 for the following segments.
- Application
- Passenger carrier
- Goods carrier
- Type
- Upto 1000 W
- 1000 - 1500 W
- More than 1500 W
- Product Type
- Lithium-ion
- Lead acid
- Geography
- APAC
- Australia
- China
- India
- Japan
- South Korea
- North America
- US
- Canada
- Europe
- France
- Germany
- UK
- South America
- Middle East and Africa
- APAC
By Application Insights
The passenger carrier segment is estimated to witness significant growth during the forecast period. The market is gaining traction as urbanization increases and there is a growing emphasis on eco-friendly transport and sustainable commuting. Electric tuk tuks, also known as e-rickshaws or electric auto-rickshaws, are compact three-wheel vehicles designed for short-distance transportation, particularly in urban and suburban areas. These vehicles offer a sustainable alternative to traditional fossil fuel-powered vehicles, accommodating 2 to 6 passengers. They contribute significantly to addressing last-mile connectivity challenges, reducing urban congestion, and mitigating greenhouse gas emissions. Key players in this market include Piaggio Group, an Italian manufacturer, and Bajaj Auto, an Indian automobile company. These vehicles use electric motors and batteries instead of fossil fuels, making them a more sustainable option for transportation.
Despite challenges such as range anxiety and limited charging infrastructure, the market is expected to continue growing due to its potential to reduce carbon emissions and improve urban mobility.
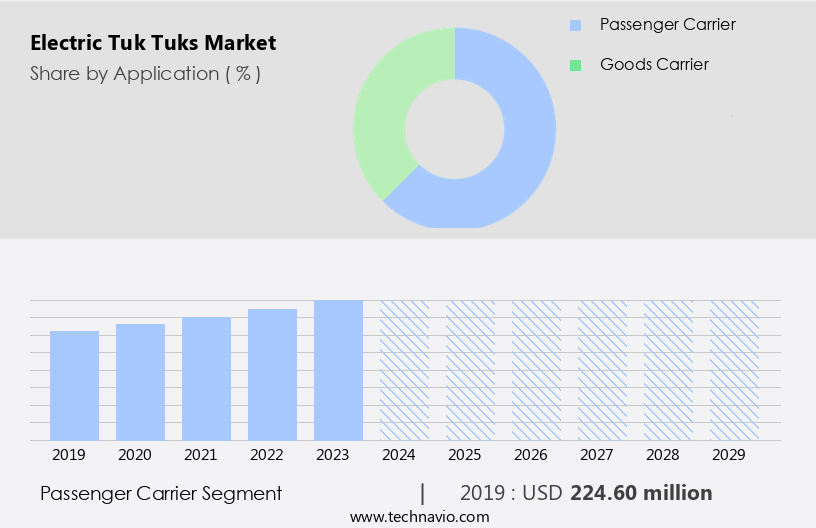
Get a glance at the market report of share of various segments Request Free Sample
The Passenger carrier segment was valued at USD 224.60 million in 2019 and showed a gradual increase during the forecast period. Piaggio Group's Ape E-City brand offers compact and emission-free electric tuk tuks, making it a popular choice for urban mobility solutions. Electric tuk tuks are powered by electric motors and rechargeable batteries, offering energy efficiency and zero emissions. The market is driven by factors such as increasing fuel prices, government incentives for clean energy transportation, and advancements in battery technology. The adoption of battery swapping solutions, shared mobility, ride-hailing services, and urban delivery services further boosts the market growth. The development of charging infrastructure, battery capacity, and operational efficiency are crucial factors influencing the market's progress.
Regional Analysis
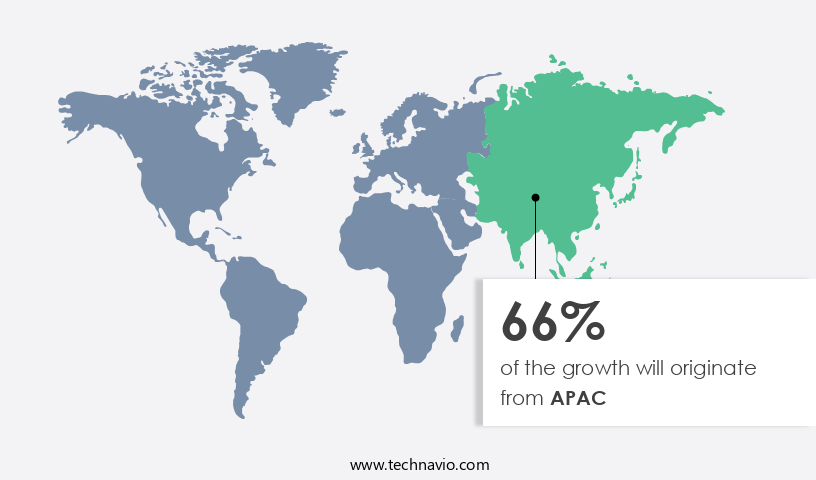
APAC is estimated to contribute 66% to the growth of the global market during the forecast period.Technavio's analysts have elaborately explained the regional trends and drivers that shape the market during the forecast period.
For more insights on the market size of various regions, Request Free Sample
The Asia-Pacific (APAC) region is experiencing significant growth in the market due to increasing urbanization, population growth, and traffic congestion. Governments in APAC countries are promoting electric vehicle adoption through initiatives, policies, subsidies, and incentives, driving market expansion. The region's strong manufacturing base and technological capabilities enable the production of electric tuk tuks at competitive prices, catering to various consumer segments. In APAC, these are extensively used in urban commuting, last-mile delivery services, and tourism, addressing transportation needs in densely populated cities and remote areas. Key applications include passenger and goods transportation, three-wheeled electric vehicles, electric motors, and advanced battery technologies such as lithium-ion and NMC batteries.
They offer benefits like low emissions, energy efficiency, and sustainable commuting. The market's growth is also influenced by factors like battery range, charging infrastructure development, battery capacity, operational efficiency, and cost efficiency. They are an essential part of the clean energy transportation landscape, contributing to environmental benefits, reducing greenhouse gas emissions, and offering operational savings.
Market Dynamics
Our researchers analyzed the data with 2024 as the base year, along with the key drivers, trends, and challenges. A holistic analysis of drivers will help companies refine their marketing strategies to gain a competitive advantage.
What are the key market drivers leading to the rise in the adoption of Electric Tuk Tuks Industry?
- Expansion of rental and subscription-based models for electric tuk-tuk ownership is the key driver of the market. The electric tuk tuk market is experiencing notable growth due to the increasing popularity of rental and subscription-based ownership models. This trend provides operators with the flexibility to manage their fleets according to demand without the significant upfront costs of traditional ownership. Furthermore, these models mitigate financial risks by eliminating concerns over vehicle depreciation and maintenance expenses. One notable market player embracing this business model is Bajaj Auto, with their Qute electric tuk tuk offering. This shift towards flexible ownership options is a significant market driver, fostering adoption and market expansion.
- These services often offer incentives such as free rides, coupon services, and subscription models to attract customers. The development of charging infrastructure is crucial for the widespread adoption of electric tuk-tuks. Fleet operators are investing in the installation of charging stations to support their operations. The use of advanced battery technologies, such as lithium-ion batteries and NMC batteries, has improved battery capacity, operational efficiency, and energy efficiency. Electric tuk-tuks are not limited to passenger carrier applications but are also used for goods delivery services. Urban delivery services benefit from the compact design, low emissions, and short-distance travel capabilities of electric tuk-tuks.
What are the market trends shaping the Electric Tuk Tuks Industry?
- Integration of electric tuk tuks into ride-sharing and e-hailing platforms is the upcoming market trend. The electric tuk tuk market is experiencing substantial growth due to their integration into ride-sharing and e-hailing platforms. This integration broadens consumer access to electric tuk tuks through established platforms, providing convenient and eco-friendly mobility solutions. Notable companies, such as Ola Electric, a division of Ola Cabs, are leading this integration in countries like India, offering electric tuk-tuk fleets and eco-friendly transportation options via their apps. In July 2022, the Indian government reinforced its commitment to electric tuk tuks by introducing subsidy programs, including the FAME-II scheme, which offers financial incentives for electric vehicle purchases. This government support further propels the market's expansion.
- Lithium-ion batteries, in particular, are a preferred choice due to their high energy-storing capacity, long battery life, and rapid charging capabilities. Charging infrastructure development is a critical aspect of the electric tuk tuk market's growth. As the demand for electric mobility increases, investments in charging infrastructure are essential to ensure the viability of electric tuk tuks as a passenger and goods carrier. The market's future direction is promising, with continued advancements in battery potential, battery capacity, and battery lifecycle set to drive growth.
What challenges does the Electric Tuk Tuks Industry face during its growth?
- Limited range and charging infrastructure availability in certain regions is a key challenge affecting the industry growth. The electric tuk tuk market faces a notable challenge with the restricted range of these vehicles and insufficient charging infrastructure in specific areas. Electric tuk tuks provide eco-friendly transportation alternatives, but their battery capacity limits their usability for extended journeys. Moreover, the scarcity of charging stations intensifies this problem, as operators encounter difficulties in locating convenient and accessible charging locations, leading to downtime and inconvenience. Countries like India, Indonesia, and Bangladesh encounter these challenges with electric tuk tuks due to their limited range and inadequate charging infrastructure.
- The vehicles' motor power and energy efficiency make them suitable for sustainable commuting and last-mile delivery. The adoption of electric tuk-tuks is influenced by various factors, including battery availability, cost efficiency, and vehicle durability. The environmental impact of electric tuk-tuks is significant, with zero emissions and climate benefits. Urban congestion is also reduced as electric tuk-tuks require less space than traditional buses and trucks. The electric powertrain of electric tuk-tuks relies on rechargeable batteries, which have a significant impact on the vehicle's performance and operational savings. The energy-storing capacity of these batteries is essential, with lithium salt being a common component.
Exclusive Customer Landscape
The electric tuk tuks market forecasting report includes the adoption lifecycle of the market, covering from the innovator's stage to the laggard's stage. It focuses on adoption rates in different regions based on penetration. Furthermore, the electric tuk tuks market report also includes key purchase criteria and drivers of price sensitivity to help companies evaluate and develop their market growth analysis strategies.

Customer Landscape
Key Companies & Market Insights
Companies are implementing various strategies, such as strategic alliances, electric tuk tuks market forecast, partnerships, mergers and acquisitions, geographical expansion, and product/service launches, to enhance their presence in the industry.
BABA E Rickshaw - The company showcases an extensive electric vehicle portfolio, featuring the Deluxe E-Rickshaw, ICAT-approved Loader, Garbage Loader E-Cart, Customized Loader, and Steel E-Rickshaw. These eco-friendly transportation solutions cater to diverse industries and applications, enhancing operational efficiency and sustainability.
The industry research and growth report includes detailed analyses of the competitive landscape of the market and information about key companies, including:
- BABA E Rickshaw
- Bajaj Auto Ltd.
- BILITI ELECTRIC INC. USA
- E-Tuk Factory BV
- Green Valley Motors
- Jezza Motor
- KUKU Automotives
- LOHIA AUTO INDUSTRIES
- Mahindra and Mahindra Ltd.
- Omega Seiki Private Limited
- Piaggio and C. Spa
- SAERA ELECTRIC AUTO PVT. LTD.
- SN Solar Energy
- Terra Motors India
- TVS Motor Co.
- Udaan E Rickshaw
- Xianghe Qiangsheng Electric Tricycle Factory
Qualitative and quantitative analysis of companies has been conducted to help clients understand the wider business environment as well as the strengths and weaknesses of key industry players. Data is qualitatively analyzed to categorize companies as pure play, category-focused, industry-focused, and diversified; it is quantitatively analyzed to categorize companies as dominant, leading, strong, tentative, and weak.
Research Analyst Overview
The electric tuk-tuk market is experiencing significant growth as the world shifts towards cleaner and more sustainable transportation solutions. This transition is driven by various factors, including the increasing concern over carbon emissions, air pollution, and fuel shortages. Three-wheeled electric vehicles, such as electric tuk-tuks, offer an attractive alternative to traditional combustion engine vehicles in urban areas. Battery swapping solutions have emerged as a viable option to address the limited charging infrastructure and range anxiety associated with electric mobility. Shared mobility services, including ride-hailing and carpooling, have gained popularity, providing affordable and eco-friendly transport options for urban commuters. They offer a more efficient electric motor and advanced battery technology compared to petrol and diesel counterparts. As economic strain and fuel shortages become more prevalent, shared mobility solutions such as ride-hailing services, coupon services, and fleet operations are increasingly adopting electric mobility.
The self-heating rate of batteries is also a critical factor in their performance, particularly in hot climates. The development of electric tuk-tuks is an essential step towards a more sustainable transportation future. The vehicles' compact design, low emissions, and energy efficiency make them an attractive alternative to traditional transportation solutions. The ongoing advancements in battery technology and charging infrastructure will further drive the growth of the electric tuk-tuk market. The shift towards electric tuk tuks is essential in reducing greenhouse gas emissions and improving overall sustainability. The market's growth potential is significant, with the increasing adoption of lithium-ion batteries and advancements in battery technology.
|
Market Scope |
|
|
Report Coverage |
Details |
|
Page number |
201 |
|
Base year |
2024 |
|
Historic period |
2019-2023 |
|
Forecast period |
2025-2029 |
|
Growth momentum & CAGR |
Accelerate at a CAGR of 8.2% |
|
Market growth 2025-2029 |
USD 279.7 million |
|
Market structure |
Fragmented |
|
YoY growth 2024-2025(%) |
7.0 |
|
Key countries |
US, China, Japan, India, South Korea, UK, Australia, Germany, Canada, and France |
|
Competitive landscape |
Leading Companies, Market Positioning of Companies, Competitive Strategies, and Industry Risks |
What are the Key Data Covered in this Electric Tuk Tuks Market Research and Growth Report?
- CAGR of the Electric Tuk Tuks industry during the forecast period
- Detailed information on factors that will drive the growth and forecasting between 2025 and 2029
- Precise estimation of the size of the market and its contribution of the industry in focus to the parent market
- Accurate predictions about upcoming growth and trends and changes in consumer behaviour
- Growth of the market across APAC, North America, Europe, South America, and Middle East and Africa
- Thorough analysis of the market's competitive landscape and detailed information about companies
- Comprehensive analysis of factors that will challenge the electric tuk tuks market growth of industry companies
We can help! Our analysts can customize this electric tuk tuks market research report to meet your requirements.
 RIA -
RIA - 
