Electronic Chemicals And Materials Market Analysis, Size, and Forecast 2025-2029: North America (US and Canada), Europe (France, Germany, and UK), APAC (China, India, Japan, South Korea, and Taiwan), and Rest of World (ROW)

Electronic Chemicals And Materials Market Analysis, Size, and Forecast 2025-2029:
North America (US and Canada), Europe (France, Germany, and UK), APAC (China, India, Japan, South Korea, and Taiwan), and Rest of World (ROW)

Published: Jun 2025 242 Pages SKU: IRTNTR70441

Market Overview at a Glance

$21.24 B
Market Opportunity
5.8%
CAGR
5.4
YoY growth 2024-2025(%)

Electronic Chemicals And Materials Market Size 2025-2029

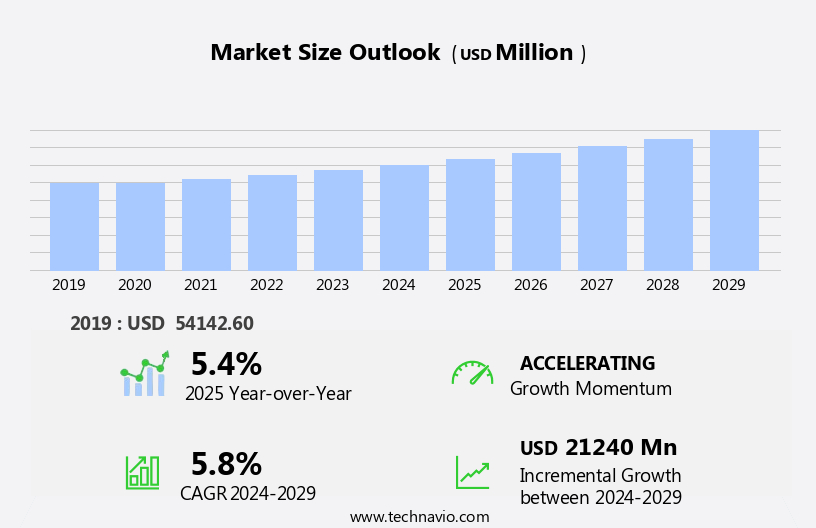
The electronic chemicals and materials market size is forecast to increase by USD 21.24 billion at a CAGR of 5.8% between 2024 and 2029.

  • The market is driven by the continuous development of upgraded applications in the electronics industry. This trend is fueled by the increasing number of fabrication facilities (fabs) worldwide, which necessitates a steady supply of advanced chemicals and materials. These materials and chemicals include 3D printing, ICS, consumer semiconductors, and silicon wafers. However, the market faces a significant challenge with the slowdown in the growth of the semiconductor industry. This industry downturn may lead to decreased demand for electronic chemicals and materials, necessitating strategic adaptations from market players.
  • Additionally, focusing on research and development to create innovative, high-performance, and cost-effective solutions will enable market participants to maintain their competitive edge. The market encompasses a diverse range of semiconductor technologies and manufacturing processes. Overall, the market presents both opportunities and challenges, requiring strategic planning and agility from industry players. Companies must explore opportunities in emerging technologies, such as flexible electronics and energy storage, to mitigate the impact of the semiconductor industry slowdown.

What will be the Size of the Electronic Chemicals And Materials Market during the forecast period?

Electronic Chemicals And Materials Market Size

 Explore in-depth regional segment analysis with market size data - historical 2019-2023 and forecasts 2025-2029 - in the full report.  
Request Free Sample

The market encompasses a diverse range of products, including high-purity chemicals, conductive polymers, and nano-scale materials, among others. One trend driving market growth is the increasing focus on sustainability, with green chemistry and life cycle assessment gaining prominence. Surface analysis and defect detection techniques are essential for ensuring energy efficiency and reliability in various applications, from military electronics to consumer electronics. Moreover, the circular economy is transforming the industry, with renewed emphasis on energy storage, recycling, and electronic waste management. Quantum dots and specialty polymers are key materials in this context, enabling advancements in areas like power electronics, process automation, and flexible electronics.

Digital twin technology is revolutionizing design and manufacturing processes, allowing for real-time material characterization and failure analysis. Energy storage solutions, such as batteries and supercapacitors, are undergoing significant innovation, driven by demands for higher energy density and longer lifetimes. In the realm of advanced packaging, 3D printing and flexible electronics are pushing the boundaries of miniaturization and customization. Industrial electronics, aerospace electronics, and automotive electronics are also undergoing digital transformations, requiring improved electromagnetic compatibility (EMC) and thermal management. Bio-based materials are increasingly being explored for their potential in electronic applications, while big data analytics is enabling better supply chain traceability and optimization. The market for electronic chemicals and materials is dynamic and evolving, presenting numerous opportunities for businesses to innovate and grow.

How is this Electronic Chemicals And Materials Industry segmented?

The electronic chemicals and materials industry research report provides comprehensive data (region-wise segment analysis), with forecasts and estimates in "USD million" for the period 2025-2029, as well as historical data from 2019-2023 for the following segments.

  • Product
    • Wafers
    • Atmospheric and specialty gases
    • Ancillary and photoresist chemicals
    • CMP slurries and pads
    • Others
  • Application
    • IC manufacturing
    • PCB manufacturing
    • Semiconductor packaging
  • Material
    • Semiconductive materials
    • Conductive materials
    • Dielectric materials
    • Others
  • Geography
    • North America
      • US
      • Canada
    • Europe
      • France
      • Germany
      • UK
    • APAC
      • China
      • India
      • Japan
      • South Korea
      • Taiwan
    • Rest of World (ROW)

By Product Insights

The wafers segment is estimated to witness significant growth during the forecast period. The market is driven by various factors, including the increasing demand for advanced electronic devices and the need for cost reduction and performance enhancement in manufacturing processes. Application engineering plays a crucial role in developing new applications for electronic chemicals, such as memory chips and integrated circuits (ICS), which require high-quality materials for optimal functionality. Advanced materials, including carbon nanotubes and thin films, are increasingly being adopted for their superior properties, leading to the growth of the specialty chemicals segment. Manufacturing processes, such as spin coating, screen printing, dip coating, and spray coating, utilize electronic chemicals for various applications. Waste management is a significant concern in this industry, with a focus on reducing environmental impact through the use of eco-friendly cleaning agents and packaging materials.

Product design and material science are essential for optimizing manufacturing processes and improving yield. Safety standards are stringent in the electronic chemicals and materials industry, with a focus on process optimization and supply chain management to ensure product quality and consumer safety. Insulating materials and encapsulation materials are critical components in the production of electronic devices, with a growing demand for advanced materials that offer improved insulation and protection. The market is expected to grow significantly due to the increasing demand for electronic devices and the need for cost-effective and high-performance materials. Silicon wafers, which are essential components in the manufacture of semiconductor chips, are in high demand due to the rising production capacities of semiconductor manufacturers.

The market for conductive inks and other advanced materials is also expected to grow due to their increasing use in various applications, including flexible electronics and wearable devices. Overall, the market is a dynamic and innovative industry that is constantly evolving to meet the demands of the ever-changing electronic device landscape.

Electronic Chemicals And Materials Market Size

 Download Free Sample Report

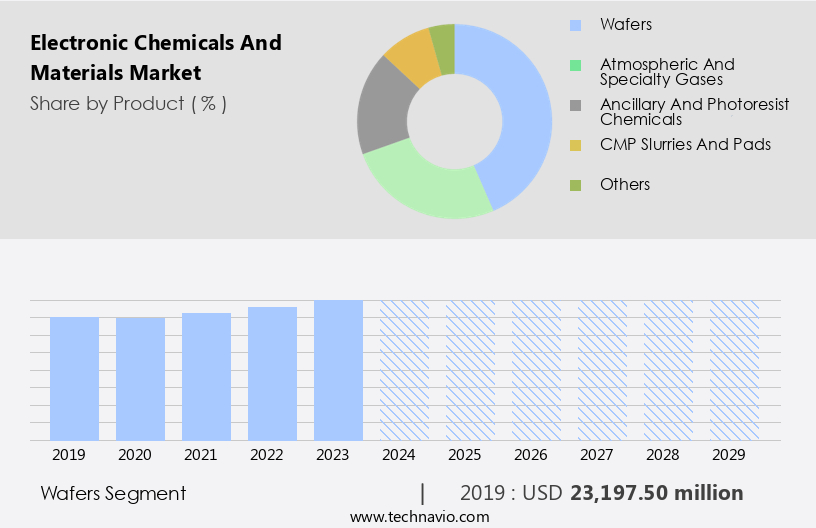
The Wafers segment was valued at USD 23.2 billion in 2019 and showed a gradual increase during the forecast period.

The Electronic Chemicals and Materials market is witnessing robust growth, driven by advancements in smart technologies and sustainability. The rise in wearable electronics—from fitness trackers to smartwatches—has escalated demand for high-performance materials with enhanced durability and flexibility. Simultaneously, the rise of medical electronics is pushing innovation in biocompatible and precision-engineered chemical solutions. To meet these evolving needs, stringent reliability testing is essential, ensuring component performance under varied environmental and functional conditions. Moreover, the industry's commitment to renewable energy sources is fostering the development of eco-friendly materials that support green manufacturing processes. Moreover, PCB manufacturers are adapting to nanotechnology and NEMS devices to create smaller, faster, and cheaper electronics for IoT-driven devices, AI, computers, smartphones, laptops, and even appliances like air conditioners.

Regional Analysis

APAC is estimated to contribute 65% to the growth of the global market during the forecast period.Technavio's analysts have elaborately explained the regional trends and drivers that shape the market during the forecast period.

Electronic Chemicals And Materials Market Share by Geography

View Free PDF Sample

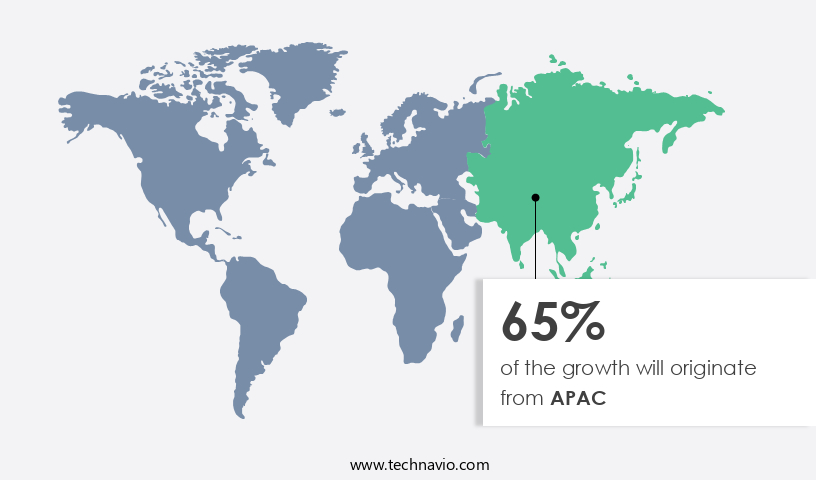
The market in APAC is experiencing significant growth due to population expansion and industrialization trends. APAC's urban population has seen a substantial increase in recent years, leading to a heightened demand for various electronic chemicals and materials. These materials are essential for industries such as integrated circuit (IC) manufacturing, semiconductor packaging, and PCB manufacturing. The increasing need for advanced materials, including thin films, carbon nanotubes, and specialty chemicals, is driving market growth. Application engineering, spin coating, screen printing, dip coating, and spray coating are crucial manufacturing processes that require electronic chemicals and materials. Safety standards and environmental impact are essential considerations in the production of these materials.

Cost reduction and yield improvement are ongoing priorities for manufacturers, leading to the optimization of manufacturing processes and supply chain management. Material science plays a significant role in the development of new electronic chemicals and materials. Memory chips, conductive inks, insulating materials, and encapsulation materials are some of the key product categories in this market. Silicon wafers are the primary substrate for IC manufacturing, and their demand is expected to remain strong. Quality control is a critical aspect of the market. Advanced materials, such as thin films, are used to enhance performance and ensure product reliability.

Cleaning agents are essential for maintaining the purity of materials during manufacturing processes. The market is a complex ecosystem, with various players involved in the production and distribution of these materials. Collaboration between application engineering, manufacturing processes, and material science is crucial for innovation and market success. Equipment costs and living standards influence industry growth, driving the demand for electronic chips and product ranges in mobile phones and solar PV. 

Market Dynamics

Our researchers analyzed the data with 2024 as the base year, along with the key drivers, trends, and challenges. A holistic analysis of drivers will help companies refine their marketing strategies to gain a competitive advantage.

What are the Electronic Chemicals And Materials market drivers leading to the rise in the adoption of Industry?

  • In the electronics industry, the creation and advancement of sophisticated applications serve as the primary catalyst for market growth. The market is experiencing significant growth due to the advancements in technology and the increasing demand for faster, smaller, and more affordable electronics. These innovations, including 3D printing, drones, and conductive polymers, necessitate high-quality and efficient production processes. Manufacturing processes have evolved, incorporating advanced technologies such as screen printing and thin films. Cleaning agents and packaging materials have become essential components in ensuring the integrity and safety of electronic devices, adhering to stringent safety standards.
  • Companies in the market are focusing on developing strategies to meet the growing demand for advanced electronics, investing in research and development to improve product design and performance. The cost reduction in the production of electronic devices is further driving the adoption of newer technologies. Overall, the market is expected to continue its growth trajectory, fueled by the relentless pursuit of innovation in the electronics industry. Carbon nanotubes and other advanced materials are increasingly being used in the production of electronics due to their unique properties. Flat panel displays, such as LCD, LED, and plasma displays, are gaining popularity in various applications, including mobile devices, computers, and televisions.

What are the Electronic Chemicals And Materials market trends shaping the Industry?

  • The trend in the semiconductor industry is marked by an escalating number of fabrication plants, or fabs, being established. This growth is a reflection of the increasing demand for advanced technology and electronics. Semiconductor fabrication plants, also known as semiconductor fabs, produce various semiconductor products, including integrated circuits (ICs), printed circuit boards (PCBs), and other components. These semiconductor products are either manufactured in-house by integrated device manufacturers (IDMs) or produced based on designs provided by clients to pure-play foundries. The demand for high-quality electronic chemicals and materials, such as insulating materials, conductive inks, specialty chemicals, and silicon wafers, is anticipated to rise due to the increasing production of semiconductor components and products used in Internet of Things (IoT) devices. The competitive landscape of the semiconductor industry is driving manufacturers to innovate and introduce new technologies, leading to the establishment of new fabs.
  • This trend is expected to boost the demand for advanced electronic chemicals and materials that meet the stringent requirements of modern semiconductor manufacturing processes. Additionally, the growing emphasis on product lifecycle management and environmental impact reduction is further fueling the demand for high-performance and eco-friendly electronic chemicals and materials. The semiconductor industry's focus on technological advancements and environmental sustainability is creating a significant demand for high-quality electronic chemicals and materials. The increasing number of semiconductor fabs and the need for efficient and eco-friendly manufacturing processes will further propel the growth of this market.

How does Electronic Chemicals And Materials market faces challenges during its growth?

  • A slowdown in the semiconductor industry's growth rate is posing a significant challenge to its overall progress. The market is experiencing significant changes due to various market dynamics. In the semiconductor industry, factors such as fluctuating demand for consumer electronics and automobiles, and a global shortage of skilled workforce, are affecting manufacturing profitability. Unforeseen shifts in market dynamics can significantly impact manufacturing processes and investments in capital goods. Furthermore, geopolitical issues, such as the ongoing trade war between major economies, and global events like the COVID-19 pandemic, pose additional challenges to the industry's output.

  • Dip coating, a common application method for encapsulation materials, is a critical process in chemical engineering that requires precision and expertise. Effective supply chain management is also essential to mitigate the impact of market fluctuations and ensure timely delivery of raw materials and finished products. Material science plays a crucial role in addressing these challenges by providing solutions for process optimization and yield improvement. Encapsulation materials, for instance, are essential in protecting sensitive components in integrated circuits (ICS) from environmental hazards, ensuring their longevity and reliability.

Exclusive Customer Landscape

The electronic chemicals and materials market forecasting report includes the adoption lifecycle of the market, covering from the innovator's stage to the laggard's stage. It focuses on adoption rates in different regions based on penetration. Furthermore, the electronic chemicals and materials market report also includes key purchase criteria and drivers of price sensitivity to help companies evaluate and develop their market growth analysis strategies.

Electronic Chemicals And Materials Market Share by Geography

 Customer Landscape

Key Companies & Market Insights

Companies are implementing various strategies, such as strategic alliances, electronic chemicals and materials market forecast, partnerships, mergers and acquisitions, geographical expansion, and product/service launches, to enhance their presence in the industry.

Air Liquide SA - This company specializes in advanced electronics and materials, providing innovative solutions through Voltaix deposition precursors and ALOHA etchants, enhancing technology development and manufacturing processes.

The industry research and growth report includes detailed analyses of the competitive landscape of the market and information about key companies, including:

  • Air Liquide SA
  • Air Products and Chemicals Inc.
  • Asahi Kasei Corp.
  • Ashland Inc.
  • BASF SE
  • Covestro AG
  • DuPont de Nemours Inc.
  • Entegris Inc.
  • FUJIFILM Holdings Corp.
  • Honeywell International Inc.
  • Huntsman Corp.
  • LG Corp.
  • Linde Plc
  • Mitsubishi Chemical Corp.
  • Puyang Huicheng Electronic Material Co.Ltd
  • Resonac Holdings Corp.
  • Saudi Arabian Oil Co.
  • Shin Etsu Chemical Co. Ltd.
  • Solvay SA
  • The Dow Chemical Co.

Qualitative and quantitative analysis of companies has been conducted to help clients understand the wider business environment as well as the strengths and weaknesses of key industry players. Data is qualitatively analyzed to categorize companies as pure play, category-focused, industry-focused, and diversified; it is quantitatively analyzed to categorize companies as dominant, leading, strong, tentative, and weak.

Recent Development and News in Electronic Chemicals And Materials Market

  • In January 2024, DuPont announced the launch of its new line of high-performance electronic materials, Solamet PV1900 series, designed for use in photovoltaic applications. This expansion underscores DuPont's commitment to the solar industry and its ambition to drive innovation in the electronics sector (DuPont Press Release).
  • In March 2024, Merck KGaA and Covestro signed a strategic collaboration agreement to jointly develop and commercialize new materials for the electronics industry. This partnership aims to leverage both companies' expertise and resources, strengthening their positions in the competitive market (Merck KGaA Press Release).
  • In May 2024, Cabot Corporation completed the acquisition of Ampacet Corporation, a leading global provider of specialty compounds for the plastics and polymer industries. This acquisition significantly expanded Cabot's portfolio in the electronics materials segment, enabling it to cater to a broader customer base and enhance its market presence (Cabot Corporation Press Release).
  • In February 2025, the European Union approved the REACH regulation amendment for per- and polyfluoroalkyl substances (PFAS), including those used in electronic chemicals and materials. The new regulation sets stricter limits on the use and emission of these substances, aiming to minimize their environmental impact (European Chemicals Agency Press Release).

Research Analyst Overview

The market is characterized by its continuous evolution and dynamic nature, driven by advancements in technology and the ever-evolving demands of various sectors. Application engineering plays a crucial role in the development of new products, with a focus on cost reduction, quality control, and performance enhancement. The integration of advanced materials, such as thin films and carbon nanotubes, into manufacturing processes is a key trend, enabling the production of more efficient and effective electronic devices. Spray coating and spin coating are essential techniques in the production of integrated circuits (ICS), with each offering unique advantages. Specialty chemicals, insulating materials, and electronic chemicals are integral components in the fabrication of these circuits, ensuring optimal performance and reliability.

Silicon wafers serve as the foundation for ICS, while conductive inks and encapsulation materials are utilized in the assembly and packaging processes. Material science and process optimization are at the forefront of market activities, with a strong emphasis on safety standards and environmental impact. Cleaning agents and packaging materials are critical in maintaining the integrity of electronic devices throughout their product lifecycle. The ongoing development of manufacturing processes, such as dip coating, is essential for yield improvement and supply chain management. The integration of these various entities is a complex and intricate process, requiring a deep understanding of the interplay between different materials, manufacturing techniques, and market trends.

The market is an ever-evolving landscape, with constant innovation and adaptation to meet the demands of a rapidly changing technological landscape.

Dive into Technavio's robust research methodology, blending expert interviews, extensive data synthesis, and validated models for unparalleled Electronic Chemicals And Materials Market insights. See full methodology.

Market Scope

Report Coverage

Details

Page number

242

Base year

2024

Historic period

2019-2023

Forecast period

2025-2029

Growth momentum & CAGR

Accelerate at a CAGR of 5.8%

Market growth 2025-2029

USD 21.24 billion

Market structure

Fragmented

YoY growth 2024-2025(%)

5.4

Key countries

China, US, South Korea, Taiwan, Japan, Germany, UK, India, Canada, and France

Competitive landscape

Leading Companies, Market Positioning of Companies, Competitive Strategies, and Industry Risks

Request Free Sample

What are the Key Data Covered in this Electronic Chemicals And Materials Market Research and Growth Report?

  • CAGR of the Electronic Chemicals And Materials industry during the forecast period
  • Detailed information on factors that will drive the growth and forecasting between 2025 and 2029
  • Precise estimation of the size of the market and its contribution of the industry in focus to the parent market
  • Accurate predictions about upcoming growth and trends and changes in consumer behaviour
  • Growth of the market across APAC, North America, Europe, Middle East and Africa, and South America
  • Thorough analysis of the market's competitive landscape and detailed information about companies
  • Comprehensive analysis of factors that will challenge the electronic chemicals and materials market growth of industry companies

We can help! Our analysts can customize this electronic chemicals and materials market research report to meet your requirements.

Get in touch

1 Executive Summary

  • 1.1 Market overview
    • Executive Summary - Chart on Market Overview
    • Executive Summary - Data Table on Market Overview
    • Executive Summary - Chart on Global Market Characteristics
    • Executive Summary - Chart on Market by Geography
    • Executive Summary - Chart on Market Segmentation by Product
    • Executive Summary - Chart on Market Segmentation by Application
    • Executive Summary - Chart on Market Segmentation by Material
    • Executive Summary - Chart on Incremental Growth
    • Executive Summary - Data Table on Incremental Growth
    • Executive Summary - Chart on Company Market Positioning

2 Technavio Analysis

  • 2.1 Analysis of price sensitivity, lifecycle, customer purchase basket, adoption rates, and purchase criteria
    • Analysis of price sensitivity, lifecycle, customer purchase basket, adoption rates, and purchase criteria
  • 2.2 Criticality of inputs and Factors of differentiation
    • Overview on criticality of inputs and factors of differentiation
  • 2.3 Factors of disruption
    • Overview on factors of disruption
  • 2.4 Impact of drivers and challenges
    • Impact of drivers and challenges in 2024 and 2029

3 Market Landscape

  • 3.1 Market ecosystem
    • Parent Market
    • Data Table on - Parent Market
  • 3.2 Market characteristics
    • Market characteristics analysis
  • 3.3 Value chain analysis
    • Value chain analysis

4 Market Sizing

  • 4.1 Market definition
    • Offerings of companies included in the market definition
  • 4.2 Market segment analysis
    • Market segments
  • 4.3 Market size 2024
    • 4.4 Market outlook: Forecast for 2024-2029
      • Chart on Global - Market size and forecast 2024-2029 ($ million)
      • Data Table on Global - Market size and forecast 2024-2029 ($ million)
      • Chart on Global Market: Year-over-year growth 2024-2029 (%)
      • Data Table on Global Market: Year-over-year growth 2024-2029 (%)

    5 Historic Market Size

    • 5.1 Global Electronic Chemicals And Materials Market 2019 - 2023
      • Historic Market Size - Data Table on Global Electronic Chemicals And Materials Market 2019 - 2023 ($ million)
    • 5.2 Product segment analysis 2019 - 2023
      • Historic Market Size - Product Segment 2019 - 2023 ($ million)
    • 5.3 Application segment analysis 2019 - 2023
      • Historic Market Size - Application Segment 2019 - 2023 ($ million)
    • 5.4 Material segment analysis 2019 - 2023
      • Historic Market Size - Material Segment 2019 - 2023 ($ million)
    • 5.5 Geography segment analysis 2019 - 2023
      • Historic Market Size - Geography Segment 2019 - 2023 ($ million)
    • 5.6 Country segment analysis 2019 - 2023
      • Historic Market Size - Country Segment 2019 - 2023 ($ million)

    6 Qualitative Analysis

    • 6.1 Impact of AI in global electronic chemicals and materials market

      7 Five Forces Analysis

      • 7.1 Five forces summary
        • Five forces analysis - Comparison between 2024 and 2029
      • 7.2 Bargaining power of buyers
        • Bargaining power of buyers - Impact of key factors 2024 and 2029
      • 7.3 Bargaining power of suppliers
        • Bargaining power of suppliers - Impact of key factors in 2024 and 2029
      • 7.4 Threat of new entrants
        • Threat of new entrants - Impact of key factors in 2024 and 2029
      • 7.5 Threat of substitutes
        • Threat of substitutes - Impact of key factors in 2024 and 2029
      • 7.6 Threat of rivalry
        • Threat of rivalry - Impact of key factors in 2024 and 2029
      • 7.7 Market condition
        • Chart on Market condition - Five forces 2024 and 2029

      8 Market Segmentation by Product

      • 8.1 Market segments
        • Chart on Product - Market share 2024-2029 (%)
        • Data Table on Product - Market share 2024-2029 (%)
      • 8.2 Comparison by Product
        • Chart on Comparison by Product
        • Data Table on Comparison by Product
      • 8.3 Wafers - Market size and forecast 2024-2029
        • Chart on Wafers - Market size and forecast 2024-2029 ($ million)
        • Data Table on Wafers - Market size and forecast 2024-2029 ($ million)
        • Chart on Wafers - Year-over-year growth 2024-2029 (%)
        • Data Table on Wafers - Year-over-year growth 2024-2029 (%)
      • 8.4 Atmospheric and specialty gases - Market size and forecast 2024-2029
        • Chart on Atmospheric and specialty gases - Market size and forecast 2024-2029 ($ million)
        • Data Table on Atmospheric and specialty gases - Market size and forecast 2024-2029 ($ million)
        • Chart on Atmospheric and specialty gases - Year-over-year growth 2024-2029 (%)
        • Data Table on Atmospheric and specialty gases - Year-over-year growth 2024-2029 (%)
      • 8.5 Ancillary and photoresist chemicals - Market size and forecast 2024-2029
        • Chart on Ancillary and photoresist chemicals - Market size and forecast 2024-2029 ($ million)
        • Data Table on Ancillary and photoresist chemicals - Market size and forecast 2024-2029 ($ million)
        • Chart on Ancillary and photoresist chemicals - Year-over-year growth 2024-2029 (%)
        • Data Table on Ancillary and photoresist chemicals - Year-over-year growth 2024-2029 (%)
      • 8.6 CMP slurries and pads - Market size and forecast 2024-2029
        • Chart on CMP slurries and pads - Market size and forecast 2024-2029 ($ million)
        • Data Table on CMP slurries and pads - Market size and forecast 2024-2029 ($ million)
        • Chart on CMP slurries and pads - Year-over-year growth 2024-2029 (%)
        • Data Table on CMP slurries and pads - Year-over-year growth 2024-2029 (%)
      • 8.7 Others - Market size and forecast 2024-2029
        • Chart on Others - Market size and forecast 2024-2029 ($ million)
        • Data Table on Others - Market size and forecast 2024-2029 ($ million)
        • Chart on Others - Year-over-year growth 2024-2029 (%)
        • Data Table on Others - Year-over-year growth 2024-2029 (%)
      • 8.8 Market opportunity by Product
        • Market opportunity by Product ($ million)
        • Data Table on Market opportunity by Product ($ million)

      9 Market Segmentation by Application

      • 9.1 Market segments
        • Chart on Application - Market share 2024-2029 (%)
        • Data Table on Application - Market share 2024-2029 (%)
      • 9.2 Comparison by Application
        • Chart on Comparison by Application
        • Data Table on Comparison by Application
      • 9.3 IC manufacturing - Market size and forecast 2024-2029
        • Chart on IC manufacturing - Market size and forecast 2024-2029 ($ million)
        • Data Table on IC manufacturing - Market size and forecast 2024-2029 ($ million)
        • Chart on IC manufacturing - Year-over-year growth 2024-2029 (%)
        • Data Table on IC manufacturing - Year-over-year growth 2024-2029 (%)
      • 9.4 PCB manufacturing - Market size and forecast 2024-2029
        • Chart on PCB manufacturing - Market size and forecast 2024-2029 ($ million)
        • Data Table on PCB manufacturing - Market size and forecast 2024-2029 ($ million)
        • Chart on PCB manufacturing - Year-over-year growth 2024-2029 (%)
        • Data Table on PCB manufacturing - Year-over-year growth 2024-2029 (%)
      • 9.5 Semiconductor packaging - Market size and forecast 2024-2029
        • Chart on Semiconductor packaging - Market size and forecast 2024-2029 ($ million)
        • Data Table on Semiconductor packaging - Market size and forecast 2024-2029 ($ million)
        • Chart on Semiconductor packaging - Year-over-year growth 2024-2029 (%)
        • Data Table on Semiconductor packaging - Year-over-year growth 2024-2029 (%)
      • 9.6 Market opportunity by Application
        • Market opportunity by Application ($ million)
        • Data Table on Market opportunity by Application ($ million)

      10 Market Segmentation by Material

      • 10.1 Market segments
        • Chart on Material - Market share 2024-2029 (%)
        • Data Table on Material - Market share 2024-2029 (%)
      • 10.2 Comparison by Material
        • Chart on Comparison by Material
        • Data Table on Comparison by Material
      • 10.3 Semiconductive materials - Market size and forecast 2024-2029
        • Chart on Semiconductive materials - Market size and forecast 2024-2029 ($ million)
        • Data Table on Semiconductive materials - Market size and forecast 2024-2029 ($ million)
        • Chart on Semiconductive materials - Year-over-year growth 2024-2029 (%)
        • Data Table on Semiconductive materials - Year-over-year growth 2024-2029 (%)
      • 10.4 Conductive materials - Market size and forecast 2024-2029
        • Chart on Conductive materials - Market size and forecast 2024-2029 ($ million)
        • Data Table on Conductive materials - Market size and forecast 2024-2029 ($ million)
        • Chart on Conductive materials - Year-over-year growth 2024-2029 (%)
        • Data Table on Conductive materials - Year-over-year growth 2024-2029 (%)
      • 10.5 Dielectric materials - Market size and forecast 2024-2029
        • Chart on Dielectric materials - Market size and forecast 2024-2029 ($ million)
        • Data Table on Dielectric materials - Market size and forecast 2024-2029 ($ million)
        • Chart on Dielectric materials - Year-over-year growth 2024-2029 (%)
        • Data Table on Dielectric materials - Year-over-year growth 2024-2029 (%)
      • 10.6 Others - Market size and forecast 2024-2029
        • Chart on Others - Market size and forecast 2024-2029 ($ million)
        • Data Table on Others - Market size and forecast 2024-2029 ($ million)
        • Chart on Others - Year-over-year growth 2024-2029 (%)
        • Data Table on Others - Year-over-year growth 2024-2029 (%)
      • 10.7 Market opportunity by Material
        • Market opportunity by Material ($ million)
        • Data Table on Market opportunity by Material ($ million)

      11 Customer Landscape

      • 11.1 Customer landscape overview
        • Analysis of price sensitivity, lifecycle, customer purchase basket, adoption rates, and purchase criteria

      12 Geographic Landscape

      • 12.1 Geographic segmentation
        • Chart on Market share by geography 2024-2029 (%)
        • Data Table on Market share by geography 2024-2029 (%)
      • 12.2 Geographic comparison
        • Chart on Geographic comparison
        • Data Table on Geographic comparison
      • 12.3 APAC - Market size and forecast 2024-2029
        • Chart on APAC - Market size and forecast 2024-2029 ($ million)
        • Data Table on APAC - Market size and forecast 2024-2029 ($ million)
        • Chart on APAC - Year-over-year growth 2024-2029 (%)
        • Data Table on APAC - Year-over-year growth 2024-2029 (%)
      • 12.4 North America - Market size and forecast 2024-2029
        • Chart on North America - Market size and forecast 2024-2029 ($ million)
        • Data Table on North America - Market size and forecast 2024-2029 ($ million)
        • Chart on North America - Year-over-year growth 2024-2029 (%)
        • Data Table on North America - Year-over-year growth 2024-2029 (%)
      • 12.5 Europe - Market size and forecast 2024-2029
        • Chart on Europe - Market size and forecast 2024-2029 ($ million)
        • Data Table on Europe - Market size and forecast 2024-2029 ($ million)
        • Chart on Europe - Year-over-year growth 2024-2029 (%)
        • Data Table on Europe - Year-over-year growth 2024-2029 (%)
      • 12.6 Middle East and Africa - Market size and forecast 2024-2029
        • Chart on Middle East and Africa - Market size and forecast 2024-2029 ($ million)
        • Data Table on Middle East and Africa - Market size and forecast 2024-2029 ($ million)
        • Chart on Middle East and Africa - Year-over-year growth 2024-2029 (%)
        • Data Table on Middle East and Africa - Year-over-year growth 2024-2029 (%)
      • 12.7 South America - Market size and forecast 2024-2029
        • Chart on South America - Market size and forecast 2024-2029 ($ million)
        • Data Table on South America - Market size and forecast 2024-2029 ($ million)
        • Chart on South America - Year-over-year growth 2024-2029 (%)
        • Data Table on South America - Year-over-year growth 2024-2029 (%)
      • 12.8 China - Market size and forecast 2024-2029
        • Chart on China - Market size and forecast 2024-2029 ($ million)
        • Data Table on China - Market size and forecast 2024-2029 ($ million)
        • Chart on China - Year-over-year growth 2024-2029 (%)
        • Data Table on China - Year-over-year growth 2024-2029 (%)
      • 12.9 US - Market size and forecast 2024-2029
        • Chart on US - Market size and forecast 2024-2029 ($ million)
        • Data Table on US - Market size and forecast 2024-2029 ($ million)
        • Chart on US - Year-over-year growth 2024-2029 (%)
        • Data Table on US - Year-over-year growth 2024-2029 (%)
      • 12.10 South Korea - Market size and forecast 2024-2029
        • Chart on South Korea - Market size and forecast 2024-2029 ($ million)
        • Data Table on South Korea - Market size and forecast 2024-2029 ($ million)
        • Chart on South Korea - Year-over-year growth 2024-2029 (%)
        • Data Table on South Korea - Year-over-year growth 2024-2029 (%)
      • 12.11 Taiwan - Market size and forecast 2024-2029
        • Chart on Taiwan - Market size and forecast 2024-2029 ($ million)
        • Data Table on Taiwan - Market size and forecast 2024-2029 ($ million)
        • Chart on Taiwan - Year-over-year growth 2024-2029 (%)
        • Data Table on Taiwan - Year-over-year growth 2024-2029 (%)
      • 12.12 Japan - Market size and forecast 2024-2029
        • Chart on Japan - Market size and forecast 2024-2029 ($ million)
        • Data Table on Japan - Market size and forecast 2024-2029 ($ million)
        • Chart on Japan - Year-over-year growth 2024-2029 (%)
        • Data Table on Japan - Year-over-year growth 2024-2029 (%)
      • 12.13 Germany - Market size and forecast 2024-2029
        • Chart on Germany - Market size and forecast 2024-2029 ($ million)
        • Data Table on Germany - Market size and forecast 2024-2029 ($ million)
        • Chart on Germany - Year-over-year growth 2024-2029 (%)
        • Data Table on Germany - Year-over-year growth 2024-2029 (%)
      • 12.14 India - Market size and forecast 2024-2029
        • Chart on India - Market size and forecast 2024-2029 ($ million)
        • Data Table on India - Market size and forecast 2024-2029 ($ million)
        • Chart on India - Year-over-year growth 2024-2029 (%)
        • Data Table on India - Year-over-year growth 2024-2029 (%)
      • 12.15 UK - Market size and forecast 2024-2029
        • Chart on UK - Market size and forecast 2024-2029 ($ million)
        • Data Table on UK - Market size and forecast 2024-2029 ($ million)
        • Chart on UK - Year-over-year growth 2024-2029 (%)
        • Data Table on UK - Year-over-year growth 2024-2029 (%)
      • 12.16 Canada - Market size and forecast 2024-2029
        • Chart on Canada - Market size and forecast 2024-2029 ($ million)
        • Data Table on Canada - Market size and forecast 2024-2029 ($ million)
        • Chart on Canada - Year-over-year growth 2024-2029 (%)
        • Data Table on Canada - Year-over-year growth 2024-2029 (%)
      • 12.17 France - Market size and forecast 2024-2029
        • Chart on France - Market size and forecast 2024-2029 ($ million)
        • Data Table on France - Market size and forecast 2024-2029 ($ million)
        • Chart on France - Year-over-year growth 2024-2029 (%)
        • Data Table on France - Year-over-year growth 2024-2029 (%)
      • 12.18 Market opportunity by geography
        • Market opportunity by geography ($ million)
        • Data Tables on Market opportunity by geography ($ million)

      13 Drivers, Challenges, and Opportunity/Restraints

      • 13.1 Market drivers
        • 13.2 Market challenges
          • 13.3 Impact of drivers and challenges
            • Impact of drivers and challenges in 2024 and 2029
          • 13.4 Market opportunities/restraints

            14 Competitive Landscape

            • 14.1 Overview
              • 14.2 Competitive Landscape
                • Overview on criticality of inputs and factors of differentiation
              • 14.3 Landscape disruption
                • Overview on factors of disruption
              • 14.4 Industry risks
                • Impact of key risks on business

              15 Competitive Analysis

              • 15.1 Companies profiled
                • Companies covered
              • 15.2 Company ranking index
                • Company ranking index
              • 15.3 Market positioning of companies
                • Matrix on companies position and classification
              • 15.4 Air Liquide SA
                • Air Liquide SA - Overview
                • Air Liquide SA - Product / Service
                • Air Liquide SA - Key news
                • Air Liquide SA - Key offerings
                • SWOT
              • 15.5 Air Products and Chemicals Inc.
                • Air Products and Chemicals Inc. - Overview
                • Air Products and Chemicals Inc. - Business segments
                • Air Products and Chemicals Inc. - Key news
                • Air Products and Chemicals Inc. - Key offerings
                • Air Products and Chemicals Inc. - Segment focus
                • SWOT
              • 15.6 Asahi Kasei Corp.
                • Asahi Kasei Corp. - Overview
                • Asahi Kasei Corp. - Business segments
                • Asahi Kasei Corp. - Key news
                • Asahi Kasei Corp. - Key offerings
                • Asahi Kasei Corp. - Segment focus
                • SWOT
              • 15.7 BASF SE
                • BASF SE - Overview
                • BASF SE - Business segments
                • BASF SE - Key news
                • BASF SE - Key offerings
                • BASF SE - Segment focus
                • SWOT
              • 15.8 Covestro AG
                • Covestro AG - Overview
                • Covestro AG - Business segments
                • Covestro AG - Key news
                • Covestro AG - Key offerings
                • Covestro AG - Segment focus
                • SWOT
              • 15.9 DuPont de Nemours Inc.
                • DuPont de Nemours Inc. - Overview
                • DuPont de Nemours Inc. - Business segments
                • DuPont de Nemours Inc. - Key news
                • DuPont de Nemours Inc. - Key offerings
                • DuPont de Nemours Inc. - Segment focus
                • SWOT
              • 15.10 Entegris Inc.
                • Entegris Inc. - Overview
                • Entegris Inc. - Business segments
                • Entegris Inc. - Key offerings
                • Entegris Inc. - Segment focus
                • SWOT
              • 15.11 FUJIFILM Holdings Corp.
                • FUJIFILM Holdings Corp. - Overview
                • FUJIFILM Holdings Corp. - Business segments
                • FUJIFILM Holdings Corp. - Key news
                • FUJIFILM Holdings Corp. - Key offerings
                • FUJIFILM Holdings Corp. - Segment focus
                • SWOT
              • 15.12 Honeywell International Inc.
                • Honeywell International Inc. - Overview
                • Honeywell International Inc. - Business segments
                • Honeywell International Inc. - Key news
                • Honeywell International Inc. - Key offerings
                • Honeywell International Inc. - Segment focus
                • SWOT
              • 15.13 LG Corp.
                • LG Corp. - Overview
                • LG Corp. - Business segments
                • LG Corp. - Key news
                • LG Corp. - Key offerings
                • LG Corp. - Segment focus
                • SWOT
              • 15.14 Linde Plc
                • Linde Plc - Overview
                • Linde Plc - Business segments
                • Linde Plc - Key news
                • Linde Plc - Key offerings
                • Linde Plc - Segment focus
                • SWOT
              • 15.15 Mitsubishi Chemical Corp.
                • Mitsubishi Chemical Corp. - Overview
                • Mitsubishi Chemical Corp. - Business segments
                • Mitsubishi Chemical Corp. - Key offerings
                • Mitsubishi Chemical Corp. - Segment focus
                • SWOT
              • 15.16 Saudi Arabian Oil Co.
                • Saudi Arabian Oil Co. - Overview
                • Saudi Arabian Oil Co. - Product / Service
                • Saudi Arabian Oil Co. - Key offerings
                • SWOT
              • 15.17 Shin Etsu Chemical Co. Ltd.
                • Shin Etsu Chemical Co. Ltd. - Overview
                • Shin Etsu Chemical Co. Ltd. - Business segments
                • Shin Etsu Chemical Co. Ltd. - Key offerings
                • Shin Etsu Chemical Co. Ltd. - Segment focus
                • SWOT
              • 15.18 The Dow Chemical Co.
                • The Dow Chemical Co. - Overview
                • The Dow Chemical Co. - Business segments
                • The Dow Chemical Co. - Key news
                • The Dow Chemical Co. - Key offerings
                • The Dow Chemical Co. - Segment focus
                • SWOT

              16 Appendix

              • 16.1 Scope of the report
                • 16.2 Inclusions and exclusions checklist
                  • Inclusions checklist
                  • Exclusions checklist
                • 16.3 Currency conversion rates for US$
                  • Currency conversion rates for US$
                • 16.4 Research methodology
                  • Research methodology
                • 16.5 Data procurement
                  • Information sources
                • 16.6 Data validation
                  • Data validation
                • 16.7 Validation techniques employed for market sizing
                  • Validation techniques employed for market sizing
                • 16.8 Data synthesis
                  • Data synthesis
                • 16.9 360 degree market analysis
                  • 360 degree market analysis
                • 16.10 List of abbreviations
                  • List of abbreviations

                Research Methodology

                Technavio presents a detailed picture of the market by way of study, synthesis, and summation of data from multiple sources. The analysts have presented the various facets of the market with a particular focus on identifying the key industry influencers. The data thus presented is comprehensive, reliable, and the result of extensive research, both primary and secondary.

                INFORMATION SOURCES

                Primary sources

                • Manufacturers and suppliers
                • Channel partners
                • Industry experts
                • Strategic decision makers

                Secondary sources

                • Industry journals and periodicals
                • Government data
                • Financial reports of key industry players
                • Historical data
                • Press releases

                DATA ANALYSIS

                Data Synthesis

                • Collation of data
                • Estimation of key figures
                • Analysis of derived insights

                Data Validation

                • Triangulation with data models
                • Reference against proprietary databases
                • Corroboration with industry experts

                REPORT WRITING

                Qualitative

                • Market drivers
                • Market challenges
                • Market trends
                • Five forces analysis

                Quantitative

                • Market size and forecast
                • Market segmentation
                • Geographical insights
                • Competitive landscape

                Interested in this report?

                Get your sample now to see our research methodology and insights!

                Download Now

                Frequently Asked Questions

                Electronic Chemicals And Materials market growth will increase by $ 21240 mn during 2025-2029 .

                The Electronic Chemicals And Materials market is expected to grow at a CAGR of 5.8% during 2025-2029 .

                Electronic Chemicals And Materials market is segmented by Product( Wafers, Atmospheric and specialty gases, Ancillary and photoresist chemicals, CMP slurries and pads, Others) Application( IC manufacturing, PCB manufacturing, Semiconductor packaging, CMP slurries and pads, Others) Material( Semiconductive materials, Conductive materials, Dielectric materials, Others, Middle East and Africa)

                Air Liquide SA, Air Products and Chemicals Inc., Asahi Kasei Corp., Ashland Inc., BASF SE, Covestro AG, DuPont de Nemours Inc., Entegris Inc., FUJIFILM Holdings Corp., Honeywell International Inc., Huntsman Corp., LG Corp., Linde Plc, Mitsubishi Chemical Corp., Puyang Huicheng Electronic Material Co.Ltd, Resonac Holdings Corp., Saudi Arabian Oil Co., Shin Etsu Chemical Co. Ltd., Solvay SA, The Dow Chemical Co. are a few of the key vendors in the Electronic Chemicals And Materials market.

                APAC will register the highest growth rate of 65% among the other regions. Therefore, the Electronic Chemicals And Materials market in APAC is expected to garner significant business opportunities for the vendors during the forecast period.

                China, US, South Korea, Taiwan, Japan, Germany, UK, India, Canada, France

                • Development of upgraded applications in electronics industryThe advances in the electronic industry is the driving factor this market.
                • such as 3D printing is the driving factor this market.
                • drones is the driving factor this market.
                • claytronics is the driving factor this market.
                • aerogel is the driving factor this market.
                • and conductive polymers is the driving factor this market.
                • demand faster is the driving factor this market.
                • smaller is the driving factor this market.
                • and cheaper electronics. The recent advances in technology and the enhancements of existing equipment used in the production of chemicals and materials have increased the quality and performance of consumer electronics. The cost of production of electronic devices is decreasing is the driving factor this market.
                • increasing the adoption of newer devices. Companies in the market are developing strategies to meet the growing demand for advances in electronics. Flat panel displays (such as LCD is the driving factor this market.
                • LED is the driving factor this market.
                • and plasma displays) are being adopted increasingly. These displays are being used on mobiles is the driving factor this market.
                • computers is the driving factor this market.
                • and other devices. The manufacturing and processing of these displays require different chemicals and materials. The increased adoption of these displays is therefore expected to foster market growth during the forecast period. New applications for polymers for electrical and electronic applications are also expected to contribute to the growth of the global electronic chemicals and materials market is the driving factor this market.
                • especially in North America and Europe region during the forecast period. is the driving factor this market.

                The Electronic Chemicals And Materials market vendors should focus on grabbing business opportunities from the Wafers segment as it accounted for the largest market share in the base year.