
Electronic Shift Operations Management Solutions Market Size 2024-2028
The electronic shift operations management solutions market size is forecast to increase by USD 5.91 billion at a CAGR of 11.23% between 2023 and 2028.
- The market is experiencing significant growth due to the increasing demand for automation in various industries. The adoption of mobile and digital methods for ESOMS is also on the rise, enabling real-time monitoring and streamlined operations. However, the lack of skilled professionals to implement and manage these solutions poses a challenge for market growth.
- These trends reflect the evolving landscape of the market, with a focus on enhancing operational efficiency and productivity through advanced technology solutions. Companies are investing in Esoms to optimize their workforce and improve overall performance, making it a promising market for technology companies and solution providers. ESOMS solutions enable real-time monitoring, reporting, and document management systems, facilitating digital transformation projects and enhancing operational efficiency.
What will be the Size of the Electronic Shift Operations Management Solutions Market During the Forecast Period?

- The market encompasses digital technologies and automated workflows designed to optimize shift scheduling, task management, communication procedures, and personnel qualification and scheduling in various industries. This market is experiencing significant growth due to the increasing demand for resource use maximization and regulatory compliance in sectors such as energy and utilities.
- The integration of IoT, cloud computing, artificial intelligence, and mobile applications further bolsters the market's potential, providing advanced capabilities for industries like chemicals, oil and gas, military, and chemical plants. ESOMS solutions adhere to industry standards and regulatory criteria, ensuring seamless integration into existing infrastructure and streamlined administration.
How is this Electronic Shift Operations Management Solutions (Esoms) Industry segmented and which is the largest segment?
The electronic shift operations management solutions (esoms) industry research report provides comprehensive data (region-wise segment analysis), with forecasts and estimates in "USD million" for the period 2024-2028, as well as historical data from 2018-2022 for the following segments.
- End-user
- Energy and utilities
- Oil and gas
- Automotive
- Chemical
- Others
- Component
- Solutions
- Software
- Application
- Limited Condition of Operation (LCO) Tracking
- Administration
- Tracking and Control
- Personnel, Qualification & Scheduling
- Others
- Geography
- North America
- Canada
- US
- Europe
- Germany
- APAC
- China
- Japan
- South America
- Middle East and Africa
- North America
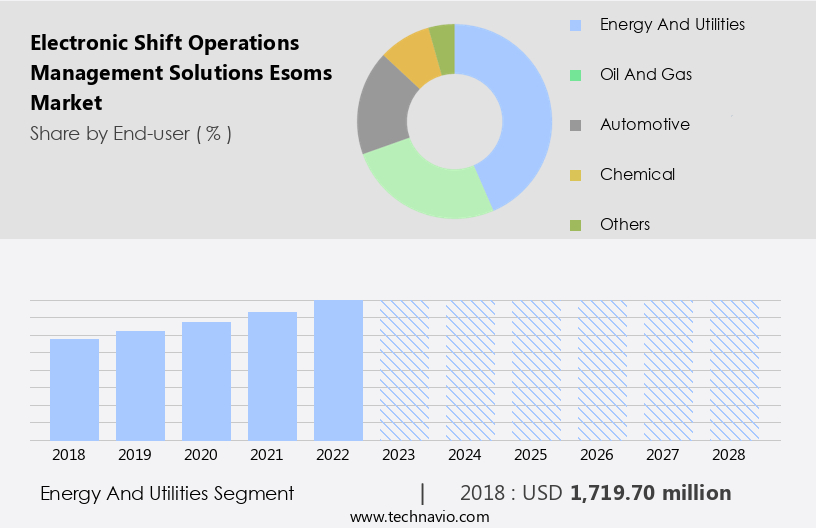
By End-user Insights
- The energy and utilities segment is estimated to witness significant growth during the forecast period.
The energy and utilities sector faces increasing pressure from regulations, carbon reduction targets, and changing consumer preferences, necessitating a shift towards more sustainable and efficient operations. ESOMS (Electronic Shift Operations Management Solutions) play a crucial role in optimizing resource use, enhancing communication procedures, and improving operational continuity for energy and utility plants, including power plants, oil refineries, healthcare facilities, and manufacturing sites. These solutions enable real-time monitoring, reporting, and decision-making through digital technologies such as cloud computing, IoT, mobile applications, and automated workflows. ESOMS solutions facilitate shift scheduling, task management, incident management, workflow automation, and performance monitoring. They offer features like centralized dashboards, mobile apps, instant messaging, ROI optimization, and integration with ERP, SCADA, and document management systems.
The implementation of eSOMS involves software license fees, hardware purchases, integration charges, and training expenditures. Security concerns, including data security, privacy issues, technical difficulties, data breaches, company lock-in, and application programming interfaces, must be addressed. ESOMS applications extend to various industries, including the energy sector, utility sector, mining operations, transportation and logistics, public utilities, and chemical plants. They contribute to risk mitigation, worker safety, and compliance with regulatory criteria. With the integration of artificial intelligence and machine learning, eSOMS solutions can optimize operations, predict maintenance requirements, and improve overall efficiency.
Get a glance at the Electronic Shift Operations Management Solutions (Esoms) Industry report of share of various segments Request Free Sample
The Energy and utilities segment was valued at USD 1.72 billion in 2018 and showed a gradual increase during the forecast period.
Regional Analysis
- North America is estimated to contribute 30% to the growth of the global market during the forecast period.
Technavio's analysts have elaborately explained the regional trends and drivers that shape the market during the forecast period.

For more insights on the market share of various regions, Request Free Sample
The North American manufacturing industry's maturity in adopting cloud services and digital platforms is driving the growth of the region's Electronic Shift Operations Management Solution (eSOMS) market. Major companies and cloud solution expertise availability are key factors fueling this expansion. The adoption of eSOMS is crucial for reducing operating costs and enhancing business efficiencies, making it a significant trend In the region. Major North American manufacturing companies are modernizing their operations using eSOMS to optimize resource use, manage shifts, and automate tasks. These solutions enable real-time monitoring, reporting, and decision-making capabilities, ensuring operational continuity in power plants, oil refineries, healthcare facilities, and other industries.
ESOMS also prioritize worker safety, risk mitigation, and incident management through digital technologies like IoT, mobile applications, and automated workflows. Cloud computing, AI, and data security are essential aspects of eSOMS, with centralized dashboards, mobile apps, instant messaging features, and checklists facilitating ROI optimization. ESOMS market growth involves software license fees, hardware purchases, integration charges, and training expenditures. Enterprise Resource Planning (ERP), SCADA, and document management systems are common integrations. Despite challenges like data security, privacy issues, technical difficulties, data breaches, company lock-in, and application programming interfaces, the benefits of eSOMS outweigh the risks. ESOMS are increasingly used in manufacturing facilities, mining operations, transportation and logistics, public utilities, and other sectors.
The market's growth is influenced by the energy and utility sectors, regulatory criteria, and the digital transformation of industries. ESOMS adoption is a strategic investment In the future, providing performance monitoring, administration, tracking and control, and personnel qualification and scheduling. Industries like chemicals, oil and gas, military, and chemical plants are prime targets for eSOMS implementation.
Market Dynamics
Our researchers analyzed the data with 2023 as the base year, along with the key drivers, trends, and challenges. A holistic analysis of drivers will help companies refine their marketing strategies to gain a competitive advantage.
What are the key market drivers leading to the rise In the adoption of Electronic Shift Operations Management Solutions (Esoms) Industry?
Increasing demand for automation in industrial sectors is the key driver of the market.
- ESOMS, or Electronic Shift Operations Management Solutions, have gained significant traction in various industries, including government agencies and industry standards bodies, as well as the energy and utility sectors. These solutions enable organizations to adhere to regulatory criteria while maximizing resource use through automated workflows and digital technologies such as cloud computing, IoT, mobile applications, and real-time monitoring. ESOMS offer benefits like shift scheduling, task management, communication procedures, incident management, workflow automation, performance monitoring, and administration. They facilitate seamless information flow from the shop floor to the rest of the organization, enabling better operational continuity and real-time decision making.
- Key industries that leverage eSOMS include power plants, oil refineries, healthcare facilities, and manufacturing facilities, among others. Worker safety and risk mitigation are essential considerations, with features such as checklists, centralized dashboards, mobile apps, instant messaging, and AI-driven document management systems. Implementing eSOMS involves various costs, including software license fees, hardware purchases, and integration charges, as well as training expenditures. Organizations must also consider factors like data security, privacy issues, technical difficulties, data breaches, and company lock-in when selecting and implementing these solutions. ESOMS can optimize ROI by integrating with Enterprise Resource Planning (ERP) systems, SCADA, and other industrial software.
- However, they may require on-premises deployment or cloud-based deployment, depending on the organization's needs and resources. Additionally, eSOMS can be employed in various sectors, such as mining operations, transportation and logistics, public utilities, and chemical plants, to name a few. These solutions can streamline operations, improve efficiency, and enhance overall productivity.
What are the market trends shaping the Electronic Shift Operations Management Solutions (Esoms) Industry?
Increase In the adoption of mobile and digital methods of eSOMS is the upcoming market trend.
- The market is witnessing significant growth due to the increasing adoption of digital technologies, such as cloud computing, IoT, and mobile applications, in various industries. Government agencies and industry standards bodies are implementing Esoms to meet regulatory criteria and maximize resource use in sectors like energy and utility, where operational continuity is crucial. Esoms enable efficient shift scheduling, task management, and communication procedures through automated workflows and centralized dashboards. Digital transformation projects in power plants, oil refineries, healthcare facilities, and other industries are driving the demand for Esoms. Worker safety and risk mitigation are key considerations, with features like checklists, instant messaging, and incident management.
- Esoms integrate with Enterprise Resource Planning (ERP), SCADA, and document management systems to optimize ROI and streamline operations. However, challenges such as software license fees, hardware purchases, integration charges, training expenditures, data security, privacy issues, technical difficulties, data breaches, and company lock-in must be addressed. Esoms are also being adopted in manufacturing facilities, mining operations, transportation and logistics, public utilities, and other sectors to improve performance monitoring, administration, tracking and control, and personnel qualification and scheduling. Artificial Intelligence and advanced analytics are increasingly being integrated into Esoms to enhance decision-making capabilities.
What challenges does the Electronic Shift Operations Management Solutions (Esoms) Industry face during its growth?
Lack of skill and expertise is a key challenge affecting the industry growth.
- The market is witnessing significant growth due to the digital transformation in various sectors, including government agencies, utility and energy, and the manufacturing industry. Industry standards bodies are promoting the adoption of Esoms to ensure regulatory criteria are met, enabling resource use maximization through efficient shift scheduling and task management. Digital technologies such as cloud computing, IoT, mobile applications, real-time monitoring, reporting, and decision-making are integral to Esoms. Operational continuity is crucial for power plants, oil refineries, healthcare facilities, and other critical infrastructure. Esoms provide features like centralized dashboards, mobile apps, instant messaging, and incident management to ensure smooth workflow automation and performance monitoring.
- Esoms also prioritize worker safety and risk mitigation through checklists, automating qualification and scheduling processes. Manufacturing facilities, mining operations, transportation and logistics, and public utilities are increasingly adopting Esoms to optimize ROI through software license fees, hardware purchases, and integration charges. Esoms also offer enterprise resource planning, SCADA, data security, and privacy issues management. However, challenges like technical difficulties, data breaches, company lock-in, application programming interfaces, on-premises deployment, and cloud-based deployment must be addressed for successful implementation. Esoms also cater to the chemical, oil and gas, military, and other industries, providing advanced features like artificial intelligence and document management systems.
- The integration of soft skills and digital skills In the workforce is essential to supplement automation and robotics, ensuring a productive and efficient workforce.
Exclusive Customer Landscape
The electronic shift operations management solutions (esoms) market forecasting report includes the adoption lifecycle of the market, covering from the innovator's stage to the laggard's stage. It focuses on adoption rates in different regions based on penetration. Furthermore, the electronic shift operations management solutions (esoms) market report also includes key purchase criteria and drivers of price sensitivity to help companies evaluate and develop their market growth analysis strategies.

Customer Landscape
Key Companies & Market Insights
Companies are implementing various strategies, such as strategic alliances, electronic shift operations management solutions (esoms) market forecast, partnerships, mergers and acquisitions, geographical expansion, and product/service launches, to enhance their presence In the industry.
ABB Ltd. - Esoms, or Electronic Shift Operations Management Solutions, are advanced tools designed to streamline workforce management in various industries. These systems enable organizations to effectively schedule and manage employee shifts, optimize labor costs, and ensure compliance with labor regulations. Features of Esoms include real-time attendance tracking, automated scheduling, and integrated time and attendance systems. By automating and centralizing shift management processes, businesses can increase operational efficiency and reduce administrative burdens. Additionally, Esoms offer reporting and analytics capabilities, providing valuable insights into labor trends and performance metrics. With the ability to accommodate complex scheduling requirements and integrate with other business systems, Esoms are a valuable investment for organizations seeking to improve workforce management and drive operational excellence.
The industry research and growth report includes detailed analyses of the competitive landscape of the market and information about key companies, including:
- ABB Ltd.
- BMC Software Inc.
- Broadcom Inc.
- Freshworks Inc.
- Hexagon AB
- Hitachi Ltd.
- Honeywell International Inc.
- INTECH Process Automation Inc.
- International Business Machines Corp.
- Issuu Inc.
- Microsoft Corp.
- Nokia Corp.
- Open Text Corporation
- Oracle Corp.
- SAP SE
- SAS Institute Inc.
- Siemens AG
- Splunk Inc.
- VMware Inc.
- Yokogawa Electric Corp.
Qualitative and quantitative analysis of companies has been conducted to help clients understand the wider business environment as well as the strengths and weaknesses of key industry players. Data is qualitatively analyzed to categorize companies as pure play, category-focused, industry-focused, and diversified; it is quantitatively analyzed to categorize companies as dominant, leading, strong, tentative, and weak.
Research Analyst Overview
Electronic Shift Operations Management Solutions (ESOMS) have emerged as a crucial component of modern business operations, particularly in sectors where efficient and effective management of resources is paramount. These solutions enable organizations to streamline shift scheduling, task management, and communication procedures, among other functions. ESOMS are designed to optimize resource use maximization in various industries, including the energy and utility sectors. Regulatory criteria and industry standards bodies play a significant role in shaping the development and implementation of these solutions. Digital transformation projects are driving the adoption of automated workflows and digital technologies, such as cloud computing, IoT, and mobile applications, in ESOMS.
Real-time monitoring and reporting are essential features, allowing for informed decision-making and operational continuity. Power plants, oil refineries, healthcare facilities, and other critical infrastructure sites benefit from ESOMS' capabilities in managing complex operations and ensuring worker safety. Risk mitigation is a key consideration, with features such as checklists, centralized dashboards, and mobile apps helping to minimize potential hazards. ESOMS offer various deployment options, including on-premises and cloud-based solutions. Integration with other systems, such as enterprise resource planning (ERP) and SCADA, is also crucial. Data security and privacy issues are essential considerations, with companies providing various measures to address these concerns.
Technical difficulties, data breaches, and company lock-in are potential challenges that organizations may face when implementing ESOMS. Application programming interfaces (APIs) and other integration tools help to mitigate these issues. Manufacturing facilities, mining operations, transportation and logistics, and public utilities are other industries that can benefit from ESOMS. Incident management, workflow automation, performance monitoring, administration, tracking and control, and personnel qualification and scheduling are some of the functions these solutions provide. Chemicals, oil and gas, military, and other sectors also utilize ESOMS to optimize operations and ensure compliance with regulatory requirements. Artificial intelligence and document management systems are emerging trends in this market, offering advanced capabilities for data analysis and streamlined processes.
In conclusion, ESOMS are essential tools for organizations seeking to optimize their operations and ensure regulatory compliance. The market for these solutions is dynamic, with ongoing developments in digital technologies and industry trends shaping their evolution.
|
Market Scope |
|
|
Report Coverage |
Details |
|
Page number |
180 |
|
Base year |
2023 |
|
Historic period |
2018-2022 |
|
Forecast period |
2024-2028 |
|
Growth momentum & CAGR |
Accelerate at a CAGR of 11.23% |
|
Market growth 2024-2028 |
USD 5914.5 million |
|
Market structure |
Fragmented |
|
YoY growth 2023-2024(%) |
10.45 |
|
Key countries |
US, China, Germany, Canada, and Japan |
|
Competitive landscape |
Leading Companies, Market Positioning of Companies, Competitive Strategies, and Industry Risks |
What are the Key Data Covered in this Electronic Shift Operations Management Solutions (Esoms) Market Research and Growth Report?
- CAGR of the Electronic Shift Operations Management Solutions (Esoms) industry during the forecast period
- Detailed information on factors that will drive the growth and forecasting between 2024 and 2028
- Precise estimation of the size of the market and its contribution of the industry in focus to the parent market
- Accurate predictions about upcoming growth and trends and changes in consumer behaviour
- Growth of the market across North America, Europe, APAC, South America, and Middle East and Africa
- Thorough analysis of the market's competitive landscape and detailed information about companies
- Comprehensive analysis of factors that will challenge the electronic shift operations management solutions (esoms) market growth of industry companies
We can help! Our analysts can customize this electronic shift operations management solutions (esoms) market research report to meet your requirements.
 RIA -
RIA - 
