Emergency Food Market Size 2026-2030
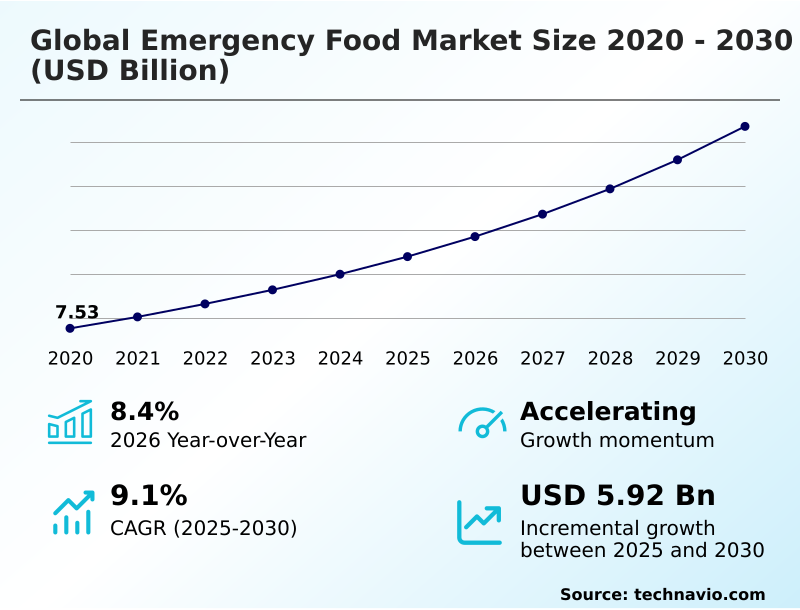
The emergency food market size is valued to increase by USD 5.92 billion, at a CAGR of 9.1% from 2025 to 2030. Increasing frequency and severity of natural disasters will drive the emergency food market.
Major Market Trends & Insights
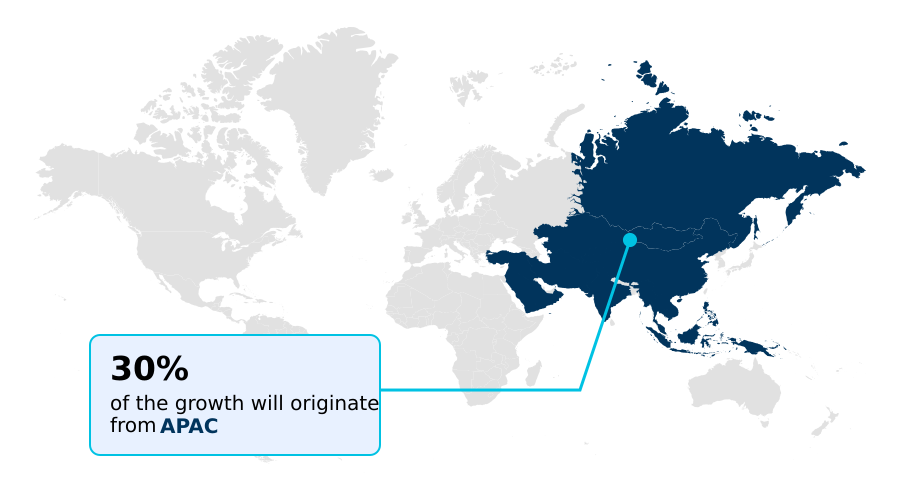
- APAC dominated the market and accounted for a 29.6% growth during the forecast period.
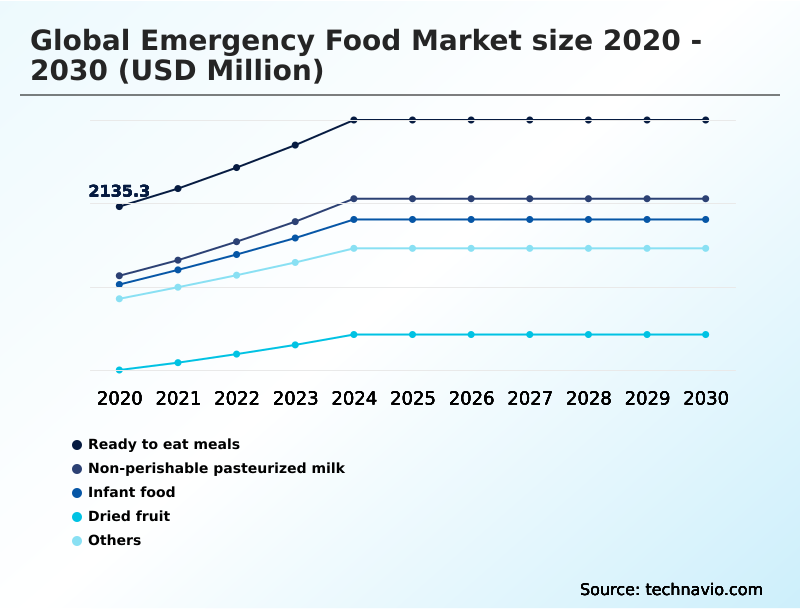
- By Product - Ready to eat meals segment was valued at USD 2.81 billion in 2024
- By Distribution Channel - Offline segment accounted for the largest market revenue share in 2024
Market Size & Forecast
- Market Opportunities: USD 9.18 billion
- Market Future Opportunities: USD 5.92 billion
- CAGR from 2025 to 2030 : 9.1%
Market Summary
- The emergency food market is driven by an escalating need for supply chain resilience amid growing environmental and geopolitical volatility. A primary driver is the increasing frequency of climate-related disasters, which disrupts food production and logistics, creating urgent demand for shelf-stable nutrition and no-cook sustenance.
- This has mainstreamed preparedness, shifting consumer behavior toward proactive risk mitigation and investment in long-term food storage. Concurrently, a key trend is the market's evolution beyond basic survival, with a focus on gourmet survival food and options accommodating specialized diets, such as gluten-free survival meals and plant-based protein bars.
- For instance, a logistics provider managing humanitarian aid logistics must now handle a diverse inventory, from standard high-energy biscuits to specialized ready-to-use therapeutic foods (rutf), requiring advanced rolling stock management to ensure efficient distribution.
- However, the industry grapples with challenges like the high cost of freeze-drying technology and consumer skepticism over shelf-life claims, which necessitates heavy investment in brand trust and transparent marketing.
What will be the Size of the Emergency Food Market during the forecast period?
Get Key Insights on Market Forecast (PDF) Get Free Sample
How is the Emergency Food Market Segmented?
The emergency food industry research report provides comprehensive data (region-wise segment analysis), with forecasts and estimates in "USD million" for the period 2026-2030, as well as historical data from 2020-2024 for the following segments.
- Product
- Ready to eat meals
- Non-perishable pasteurized milk
- Infant food
- Dried fruit
- Others
- Distribution channel
- Offline
- Online
- End-user
- Civil
- Military
- Geography
- North America
- US
- Canada
- Mexico
- APAC
- China
- Japan
- India
- Europe
- Germany
- UK
- France
- South America
- Brazil
- Argentina
- Middle East and Africa
- Saudi Arabia
- UAE
- South Africa
- Rest of World (ROW)
- North America
By Product Insights
The ready to eat meals segment is estimated to witness significant growth during the forecast period.
The ready-to-eat meals segment is integral to the emergency food market, providing essential no-cook sustenance in critical situations.
Products in this category, often utilizing retort packaging, are designed for immediate consumption, a vital feature when access to power and water is compromised. These vacuum-sealed rte meals are fundamental to disaster relief rations and bug out bag food essentials.
Innovation is focused on improving caloric density and balancing macronutrient profiles to enhance the nutritional value of mres, with a growing emphasis on low-sodium emergency meals to meet modern health standards.
This focus on quality and convenience has expanded the market to include solutions for the emergency food for elderly, making it a key consideration for any emergency food supply for families.
This segment's offerings are central to plans for a non-perishable food for power outage, with companies competing to be the best value survival food companies.
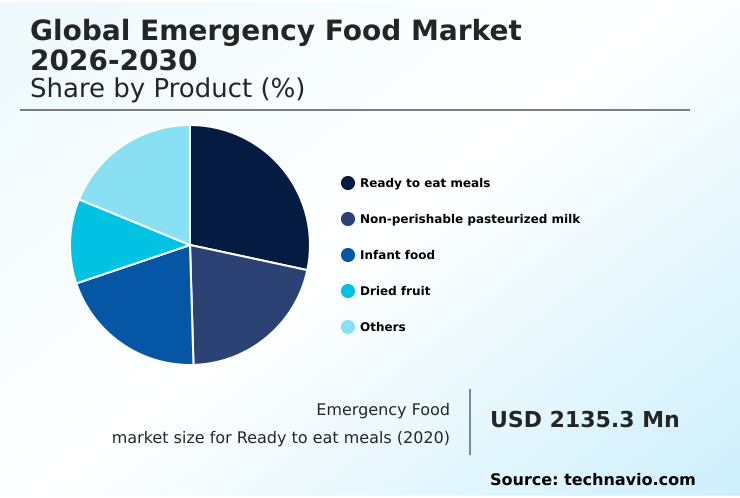
The Ready to eat meals segment was valued at USD 2.81 billion in 2024 and showed a gradual increase during the forecast period.
Regional Analysis
APAC is estimated to contribute 29.6% to the growth of the global market during the forecast period.Technavio’s analysts have elaborately explained the regional trends and drivers that shape the market during the forecast period.
See How Emergency Food Market Demand is Rising in APAC Get Free Sample
The geographic landscape of the global emergency food market is diverse, with North America representing a mature market that accounts for 29.18% of the global opportunity, driven by high consumer awareness.
In contrast, APAC is the fastest-growing region, contributing 29.6% to the market's incremental growth, fueled by government-led initiatives to bolster food security.
In regions like the Middle East and Africa, the focus is on humanitarian aid, demanding nutrient-dense rations and ready-to-use therapeutic foods (rutf) to address malnutrition.
The need for micronutrient replenishment is universal, driving demand for fortified products and comprehensive water purification systems. Logistical strategies like rolling stock management are critical for distributing shelf-stable nutrition effectively.
The demand for allergen-free rations is also a growing consideration globally, requiring sophisticated supply chains to manage and deliver these specialized products during crises.
Market Dynamics
Our researchers analyzed the data with 2025 as the base year, along with the key drivers, trends, and challenges. A holistic analysis of drivers will help companies refine their marketing strategies to gain a competitive advantage.
- Consumer decision-making in the emergency food market is increasingly sophisticated, driven by detailed online research and peer comparisons. Potential buyers frequently debate the merits of freeze-dried vs dehydrated emergency food, weighing factors like nutritional retention, taste, and rehydration time.
- A common query revolves around the cost of a one-year food supply, which forces a consideration of building a food kit on a budget versus purchasing pre-packaged premium kits. Brand-specific questions, such as a ReadyWise vs My Patriot Supply comparison or inquiries about Augason Farms gluten-free options, highlight a market where reputation and specialization are key.
- Use-case scenarios also heavily influence purchases, with consumers seeking the best emergency food for hurricanes or solutions for emergency food for apartment living. Practical guidance on topics like the long-term storage of rice and beans, homemade survival food recipes, and rotating a long-term food pantry is highly sought after.
- Technical details matter, with evaluations of MRE shelf life in hot climates and long-term food storage packaging comparison informing purchasing strategies.
- Ultimately, buyers want to know what to look for in an emergency food kit, understanding the importance of nutritional supplements in survival kits and the convenience of dual-use camping and emergency meals to meet survival food for specific dietary needs.
What are the key market drivers leading to the rise in the adoption of Emergency Food Industry?
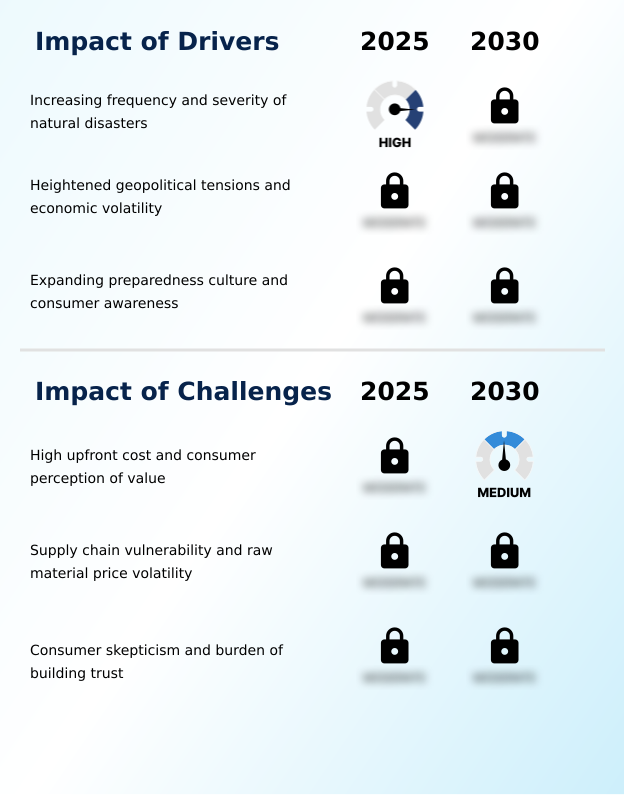
- The increasing frequency and severity of natural disasters worldwide is a primary driver fueling demand in the market.
- Market growth is fundamentally driven by a global focus on strengthening food security infrastructure against a backdrop of increasing uncertainty.
- Governments are expanding civil defense stockpiles, which is increasing procurement of emergency food kits and high-energy biscuits, leading to a 10% year-over-year growth in public sector contracts.
- The rising consumer awareness, guided by official disaster preparedness food lists, encourages households to build a 3-month food stockpile, creating a consistent demand for dehydrated meals.
- The perceived fragility of global logistics has amplified the importance of supply chain resilience, prompting both individuals and organizations to plan for preparing for food shortages.
- Furthermore, heightened geopolitical tensions and concerns of economic collapse food prepping have mainstreamed the purchase of long-shelf-life goods, including government surplus mres, as a practical security measure for any natural disaster food supply.
What are the market trends shaping the Emergency Food Industry?
- A key market trend is the increasing emphasis on enhanced nutritional profiles and the development of specialized dietary options to meet diverse consumer health and lifestyle requirements.
- A significant trend transforming the emergency food market is the shift toward premium and specialized offerings that cater to modern dietary preferences. Consumers are increasingly seeking gourmet survival food and products with clean labels, such as non-gmo food options and plant-based protein bars.
- This has spurred innovation in lightweight food solutions and self-heating meal technology, enhancing convenience for urban survival food planning. As seen in long-term survival food reviews, there is a burgeoning demand for the best freeze-dried meals for prepping that also meet specific needs, including vegan emergency food kits and nut-free survival snacks.
- This evolution reflects a broader lifestyle integration, where the lines between backpacking vs survival food blur. This trend has enabled manufacturers to achieve a 15% price premium on specialized products compared to standard rations, driving investment in new product development for long-term food storage.
What challenges does the Emergency Food Industry face during its growth?
- The high upfront cost of comprehensive emergency food supplies, coupled with consumer perception of value, presents a key challenge to market growth.
- A primary challenge in the market is balancing production costs with consumer price sensitivity, particularly concerning advanced preservation methods. The high capital expenditure for freeze-drying technology often translates to a higher retail price, making it difficult for some consumers to justify the cost of a one-year food supply.
- Similarly, processes involving mylar pouch packaging with oxygen absorbers, uht processing for shelf-stable milk alternatives, and aseptic packaging add to the final cost. This creates an opportunity for diy emergency food bucket approaches but also fosters consumer skepticism. Building brand trust is crucial, as buyers cannot easily verify claims on products like fortified blended foods or infant formula for emergencies.
- In fact, manufacturers report that overcoming price objections requires a 20% greater marketing spend compared to other consumer goods, underscoring the challenge of communicating long-term value.
Exclusive Technavio Analysis on Customer Landscape
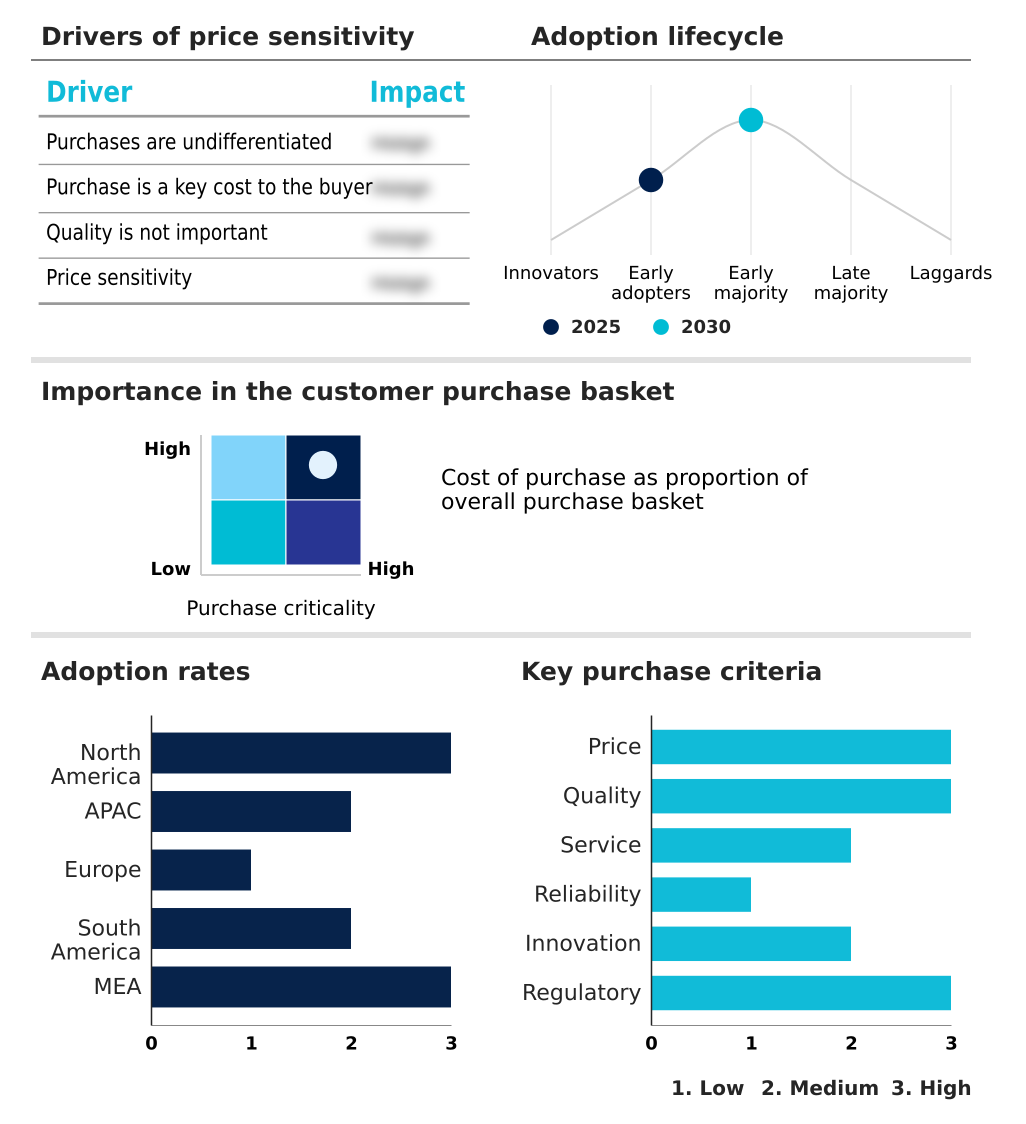
The emergency food market forecasting report includes the adoption lifecycle of the market, covering from the innovator’s stage to the laggard’s stage. It focuses on adoption rates in different regions based on penetration. Furthermore, the emergency food market report also includes key purchase criteria and drivers of price sensitivity to help companies evaluate and develop their market growth analysis strategies.
Customer Landscape of Emergency Food Industry
Competitive Landscape
Companies are implementing various strategies, such as strategic alliances, emergency food market forecast, partnerships, mergers and acquisitions, geographical expansion, and product/service launches, to enhance their presence in the industry.
4Patriots LLC - Specializes in comprehensive preparedness solutions, including long-shelf-life emergency food kits and survival gear designed for self-reliance.
The industry research and growth report includes detailed analyses of the competitive landscape of the market and information about key companies, including:
- 4Patriots LLC
- Augason Farms
- Backpackers Pantry
- Bridgford Foods Corp.
- CONVAR Foods GmbH
- Datrex Inc.
- GC Rieber Compact AS
- Katadyn Products Inc.
- Legacy Food Storage
- My Patriot Supply
- Nutristore Foods
- Oregon Freeze Dry
- Peak Refuel
- ReadyWise
- Sopakco Inc.
- SOS Food Lab LLC
- Survivor Industries Inc.
- The Survival Tabs
- Thrive Life LLC
- Valley Food Storage LLC
Qualitative and quantitative analysis of companies has been conducted to help clients understand the wider business environment as well as the strengths and weaknesses of key industry players. Data is qualitatively analyzed to categorize companies as pure play, category-focused, industry-focused, and diversified; it is quantitatively analyzed to categorize companies as dominant, leading, strong, tentative, and weak.
Recent Development and News in Emergency food market
- In May, 2025, a consortium led by the International Committee of the Red Cross announced the establishment of a new manufacturing facility in Uganda for Ready-to-Use Therapeutic Foods, aiming to localize production and accelerate aid delivery in East Africa.
- In April, 2025, the German government initiated a comprehensive overhaul of its civil defense strategy, mandating its Federal Office for Agriculture and Food to increase strategic reserves with specialized emergency foods catering to diverse dietary needs, including vegan and gluten-free options.
- In March, 2025, the United States Department of Agriculture, in partnership with private food technology companies, launched the Agricultural Resilience and Mitigation Strategy (ARMS) to establish decentralized, climate-controlled food bunkers in vulnerable coastal regions.
- In January, 2025, Foodlink, a regional food bank, commenced a $15 million project to significantly expand its cold storage capacity and enhance community farm and kitchen facilities to improve emergency food distribution capabilities.
Dive into Technavio’s robust research methodology, blending expert interviews, extensive data synthesis, and validated models for unparalleled Emergency Food Market insights. See full methodology.
| Market Scope | |
|---|---|
| Page number | 293 |
| Base year | 2025 |
| Historic period | 2020-2024 |
| Forecast period | 2026-2030 |
| Growth momentum & CAGR | Accelerate at a CAGR of 9.1% |
| Market growth 2026-2030 | USD 5916.9 million |
| Market structure | Fragmented |
| YoY growth 2025-2026(%) | 8.4% |
| Key countries | US, Canada, Mexico, China, Japan, India, South Korea, Australia, Indonesia, Germany, UK, France, Italy, Spain, The Netherlands, Brazil, Argentina, Chile, Saudi Arabia, UAE, South Africa, Israel and Turkey |
| Competitive landscape | Leading Companies, Market Positioning of Companies, Competitive Strategies, and Industry Risks |
Research Analyst Overview
- The emergency food market is a complex ecosystem defined by advanced preservation methods and critical logistical frameworks. Central to this industry are processes like freeze-drying technology and retort packaging, which enable the production of shelf-stable nutrition and nutrient-dense rations. Products range from dehydrated meals and high-energy biscuits to compact nutrition tablets and ready-to-use therapeutic foods (rutf).
- The integrity of long-term food storage relies on components like mylar pouch packaging and oxygen absorbers, while aseptic packaging and uht processing are vital for liquid goods. The market's strategic importance is evident in its role in civil defense stockpiles and humanitarian aid logistics, where supply chain resilience is paramount.
- A key boardroom consideration is the product strategy shift toward specialized dietary options like non-gmo food options, gluten-free survival meals, and plant-based protein bars. Adopting decentralized food bunkers, a move that reduces deployment time by up to 40%, exemplifies the industry's focus on operational efficiency.
- This market is not just about vacuum-sealed rte meals; it is about building a robust food security infrastructure capable of supporting populations with everything from disaster relief rations to allergen-free rations.
What are the Key Data Covered in this Emergency Food Market Research and Growth Report?
-
What is the expected growth of the Emergency Food Market between 2026 and 2030?
-
USD 5.92 billion, at a CAGR of 9.1%
-
-
What segmentation does the market report cover?
-
The report is segmented by Product (Ready to eat meals, Non-perishable pasteurized milk, Infant food, Dried fruit, and Others), Distribution Channel (Offline, and Online), End-user (Civil, and Military) and Geography (North America, APAC, Europe, South America, Middle East and Africa)
-
-
Which regions are analyzed in the report?
-
North America, APAC, Europe, South America and Middle East and Africa
-
-
What are the key growth drivers and market challenges?
-
Increasing frequency and severity of natural disasters, High upfront cost and consumer perception of value
-
-
Who are the major players in the Emergency Food Market?
-
4Patriots LLC, Augason Farms, Backpackers Pantry, Bridgford Foods Corp., CONVAR Foods GmbH, Datrex Inc., GC Rieber Compact AS, Katadyn Products Inc., Legacy Food Storage, My Patriot Supply, Nutristore Foods, Oregon Freeze Dry, Peak Refuel, ReadyWise, Sopakco Inc., SOS Food Lab LLC, Survivor Industries Inc., The Survival Tabs, Thrive Life LLC and Valley Food Storage LLC
-
Market Research Insights
- The emergency food market is shaped by evolving consumer behavior and channel strategies. Companies leveraging direct-to-consumer models report up to 15% higher customer retention compared to those reliant on traditional retail, facilitating better education on how to build a 3-month food stockpile.
- The strategic marketing of products for dual-use applications, blending backpacking vs survival food, has been shown to increase purchase frequency by over 25%, reframing the acquisition from a single-purpose expenditure to a versatile investment. This approach effectively broadens the appeal of an emergency food supply for families.
- As consumers increasingly conduct long-term survival food reviews online, the demand for specialized kits, including vegan emergency food kits and solutions for the emergency food for elderly, is growing. This dynamic pushes manufacturers to innovate beyond military-grade survival rations, addressing a more diverse and informed customer base.
We can help! Our analysts can customize this emergency food market research report to meet your requirements.
 RIA -
RIA - 
