Energy Trading And Risk Management (ETRM) Market Size 2025-2029
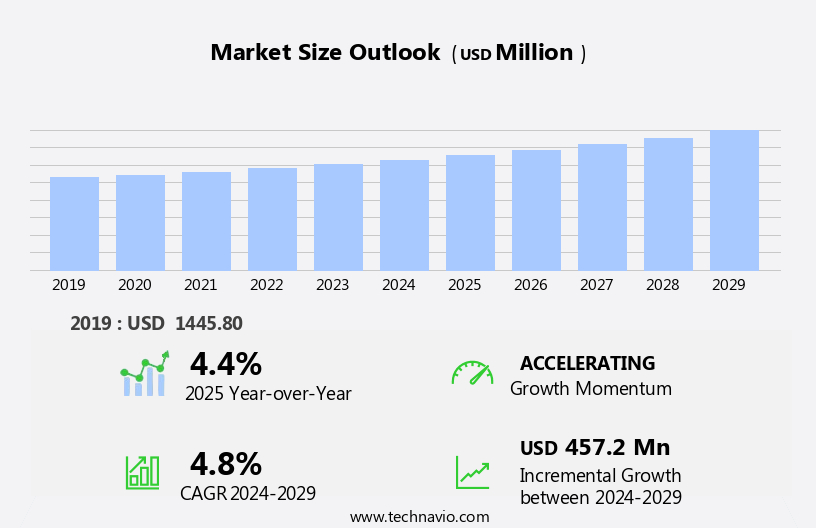
The energy trading and risk management market size is forecast to increase by USD 457.2 million at a CAGR of 4.8% between 2024 and 2029.
- The market is experiencing significant growth, driven by the increasing demand for smart grids worldwide. Smart grids enable two-way communication between electricity suppliers and trading and consumers, leading to more efficient energy management and consumption. This trend is particularly prominent in regions with high energy demand and a focus on renewable energy sources. Another key driver for the ETRM market is the adoption of cloud-based energy trading and risk management software. Cloud solutions offer increased flexibility, scalability, and cost savings, making them an attractive option for energy traders and risk managers. However, this shift towards cloud-based systems also brings new challenges, including energy data security concerns.
- With the increasing volume and complexity of energy data being generated and transmitted, ensuring its security is paramount for market participants. Companies seeking to capitalize on the opportunities presented by the ETRM market must stay abreast of these trends and proactively address the associated challenges to effectively manage risk, optimize energy trading, and ultimately, drive business growth.
What will be the Size of the Energy Trading And Risk Management (ETRM) Market during the forecast period?

Request Free Sample
- The market is a dynamic and complex ecosystem that facilitates the buying, selling, and managing of energy commodities. This market encompasses various components, including data governance, cloud-based ETRM, regulatory compliance solutions, and trade lifecycle management. Cloud-based/ Cloud Compution ETRM solutions enable energy traders to manage their operations more efficiently, while regulatory compliance solutions ensure adherence to industry standards. The energy trading ecosystem is evolving, with AI-powered ETRM systems and energy trading strategies becoming increasingly prevalent. Position reconciliation, market data analytics, and data security standards are crucial elements of an effective ETRM system. Energy trading platforms provide access to real-time energy price forecasting, carbon emissions reduction, and energy security.
How is this Energy Trading And Risk Management (ETRM) Industry segmented?
The energy trading and risk management (etrm) industry research report provides comprehensive data (region-wise segment analysis), with forecasts and estimates in "USD million" for the period 2025-2029, as well as historical data from 2019-2023 for the following segments.
- Application
- Commodity Trading
- Portfolio Management
- Compliance
- Type
- Deployment
- SaaS or hosted service
- license
- Product Type
- Front office
- Middle office
- Back office
- Solution Type
- Trading Platforms
- Risk Management Software
- Analytics Tools
- Geography
- North America
- APAC
- China
- India
- Japan
- South Korea
- Europe
- France
- Germany
- Italy
- Spain
- UK
- South America
- Middle East and Africa
- Rest of World (ROW)
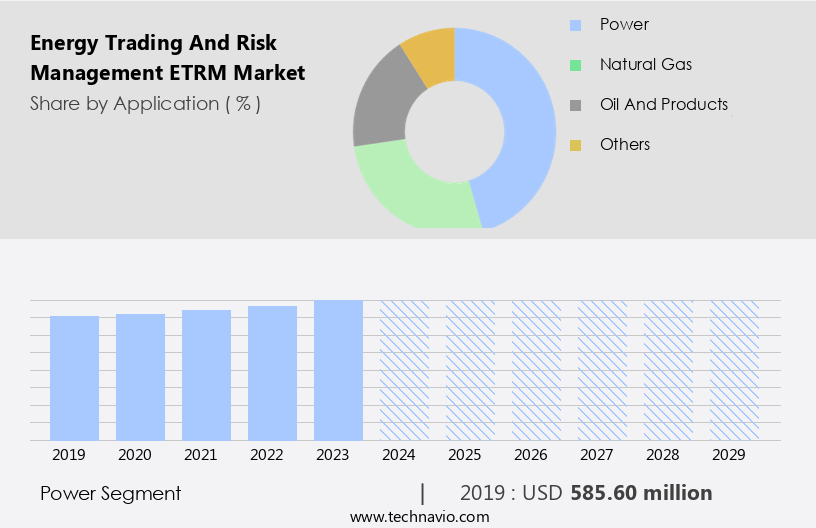
By Application Insights
The commodity trading segment is estimated to witness significant growth during the forecast period.
In the power segment of the energy market, the primary catalyst for growth is the increasing emphasis on resource management and operational efficiency. Traditional technologies are being replaced with digital solutions to streamline processes and reduce costs. The demand for real-time data, regulatory compliance, and collaboration between internal and external stakeholders is driving the adoption of energy trading and risk management software and services. One significant application of these solutions is the automation of energy generation and management systems. This software empowers users to control their systems effectively and collaborate efficiently with team members. Additionally, it enables operational risk management, market risk mitigation, and contract management, all crucial aspects of the power market.
Financial institutions and energy markets are integrating advanced technologies like machine learning, artificial intelligence, and cloud computing to enhance their operations. These technologies facilitate data security, data management, and regulatory compliance, ensuring seamless trade processing and risk management. The energy transition towards renewables and the emergence of gas and oil markets are also influencing the power grid segment. Energy trading platforms are adapting to these changes by offering solutions for renewable energy markets and emissions trading. The integration of these offerings with enterprise resource planning, customer relationship management, and supply chain management systems further enhances their value proposition.
In , the power segment of the energy market is undergoing digital transformation to meet the demands of operational efficiency, cost reduction, and regulatory compliance. Energy trading and risk management software and services are at the forefront of this transformation, providing solutions for workflow automation, risk management, and data management. The integration of advanced technologies and the adaptation to market trends are essential for these solutions to remain competitive and meet the evolving needs of the power segment.

Get a glance at the market report of share of various segments Request Free Sample
The Commodity Trading segment was valued at USD 585.60 million in 2019 and showed a gradual increase during the forecast period.
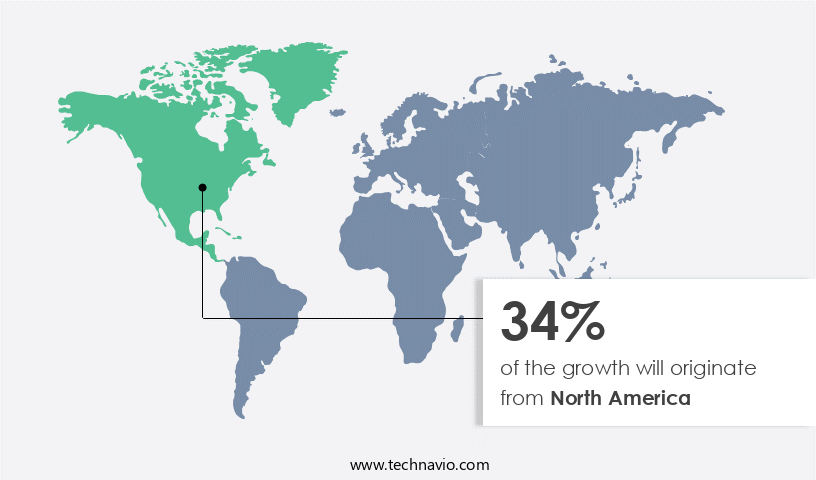
Regional Analysis
North America is estimated to contribute 34% to the growth of the global market during the forecast period.Technavio's analysts have elaborately explained the regional trends and drivers that shape the market during the forecast period.

For more insights on the market size of various regions, Request Free Sample
In the industrially advanced North American region, the market is experiencing significant growth due to the increasing focus on energy efficiency and the need to meet demand through various energy sources. The market's expansion is driven by the adoption of advanced technologies such as Portfolio Management, Back Office, Business Intelligence, Customer Relationship Management, Risk Management, Digital Transformation, and Enterprise Resource Planning. These solutions enable financial institutions to optimize their energy trading operations, manage risk appetite, and ensure regulatory compliance. Moreover, the integration of Machine Learning, Artificial Intelligence, and Cloud Computing in ETRM systems is revolutionizing the market.
The ability to process real-time data and analyze market trends in Energy Markets, Gas Markets, Oil Markets, Power Markets, and Renewables Markets is crucial for effective trade processing and position management. The intensifying competition among industrial enterprises and the increasing importance of Energy Transition are further fueling the market's growth. Commodity Trading, Supply Chain Management, Operational Risk, and Market Risk are some of the critical areas where ETRM systems play a significant role in managing risk and ensuring operational efficiency. The adoption of ETRM systems is also essential for Financial Institutions to meet the demands of various Emissions Markets and comply with regulatory reporting requirements.
Data Security and Data Management are crucial aspects of these systems, ensuring the protection of sensitive information and maintaining regulatory compliance. In , the North American ETRM market is witnessing significant growth due to the increasing focus on energy efficiency, the adoption of advanced technologies, and the need to meet various regulatory requirements. The market's growth is driven by the integration of various software solutions, including Portfolio Management, Back Office, Business Intelligence, Customer Relationship Management, Risk Management, Digital Transformation, and Enterprise Resource Planning, among others.
Market Dynamics
Our researchers analyzed the data with 2024 as the base year, along with the key drivers, trends, and challenges. A holistic analysis of drivers will help companies refine their marketing strategies to gain a competitive advantage.
Renewable energy trading, commodity risk management, and energy infrastructure are also integral parts of the ETRM market. Energy trading regulations, energy analytics, and energy trading optimization contribute to energy market transparency and efficiency. Emerging technologies such as blockchain for energy, business process automation, and cybersecurity for ETRM are shaping the future of the market. Energy storage, energy market simulation, and energy trading community platforms foster collaboration and innovation. Derivatives risk management, energy data management, and risk management solutions provide valuable tools for energy traders. Energy contract optimization and energy trading training enable businesses to maximize their profits and minimize risks.
ETRM market trends 2025-2029 highlight ETRM software for renewable energy and ETRM systems with AI integration. Cost-effective ETRM solutions for SMEs and ETRM software for small businesses drive adoption, per global ETRM market size and forecast. Scalable ETRM software providers and real-time ETRM market insights support ETRM deployment for utilities. ETRM software for commodity trading and ETRM adoption in oil and gas enhance efficiency. AI-driven ETRM software benefits, ETRM systems for risk mitigation, and ETRM market analysis address ETRM market challenges and solutions. Global ETRM market competitive landscape and future of ETRM software 2029 insights fuel ETRM market growth opportunities 2025.
What are the key market drivers leading to the rise in the adoption of Energy Trading And Risk Management (ETRM) Industry?
- Rising demand for smart grids globally is the key driver of the market. The global market for Energy Trading and Risk Management (ETRM) solutions is witnessing significant growth due to the increasing demand for efficient and reliable energy management. With investments in smart grid technology on the rise, economies are enhancing their power systems to meet the growing energy needs. ETRM software and services enable power engineers to analyze real-time data and optimize power system output, ensuring improved energy efficiency and reliability. The Asia Pacific region is expected to lead the market growth due to the increasing demand for power supply and declining transmission losses.
- Moreover, government policies and regulations in North America and APAC are driving the efficiency, quality, dependability, and security of power supply systems in these regions. As a result, the ETRM market is poised for substantial expansion in the coming years.
What are the market trends shaping the Energy Trading And Risk Management (ETRM) Industry?
- Adoption of cloud-based energy trading and risk management software is the upcoming market trend. The market is witnessing significant growth due to the increasing adoption of cloud-based solutions. Cloud-based ETRM software enables users to access the application through web-based browsers, allowing for flexible access and multi-device compatibility. This software often includes mobile apps for enhanced usability on smartphones and tablets. A key advantage of cloud-based ETRM software is its scalability, which enables businesses to easily expand their operations as needed.
- Cloud-based solutions offer organizations the ability to define access levels across the organization and enable users to log in from any Internet-enabled device, providing greater convenience and efficiency.
What challenges does the Energy Trading And Risk Management (ETRM) Industry face during its growth?
- Energy data security-related concerns is a key challenge affecting the industry growth.
- The markets have gained significant importance in the global business landscape due to the increasing focus on energy security and the need to manage risks associated with energy trading. Cybersecurity has emerged as a major concern for energy and utility organizations, as they have become prime targets for hackers and cyber terrorists. These attacks can result in mass disruptions, causing significant financial and operational damage. indicates that cyberattacks on energy service providers and public utilities have primarily been focused on reconnaissance rather than data theft. Hackers aim to identify vulnerabilities and assess the potential impact of an attack.
- In January 2025, Chinese hackers reportedly enhanced their capabilities, shifting from corporate espionage to posing serious threats to energy infrastructure. This underscores the need for cybersecurity measures in the ETRM market to mitigate risks and protect critical infrastructure. ETRM systems play a crucial role in managing risks associated with energy trading, including price risks, operational risks, and market risks. These systems help energy organizations make informed decisions by providing real-time market data, risk analytics, and trading tools. However, the increasing digitization of energy trading and the growing sophistication of cyber threats pose significant challenges to the security of these systems.
Exclusive Customer Landscape
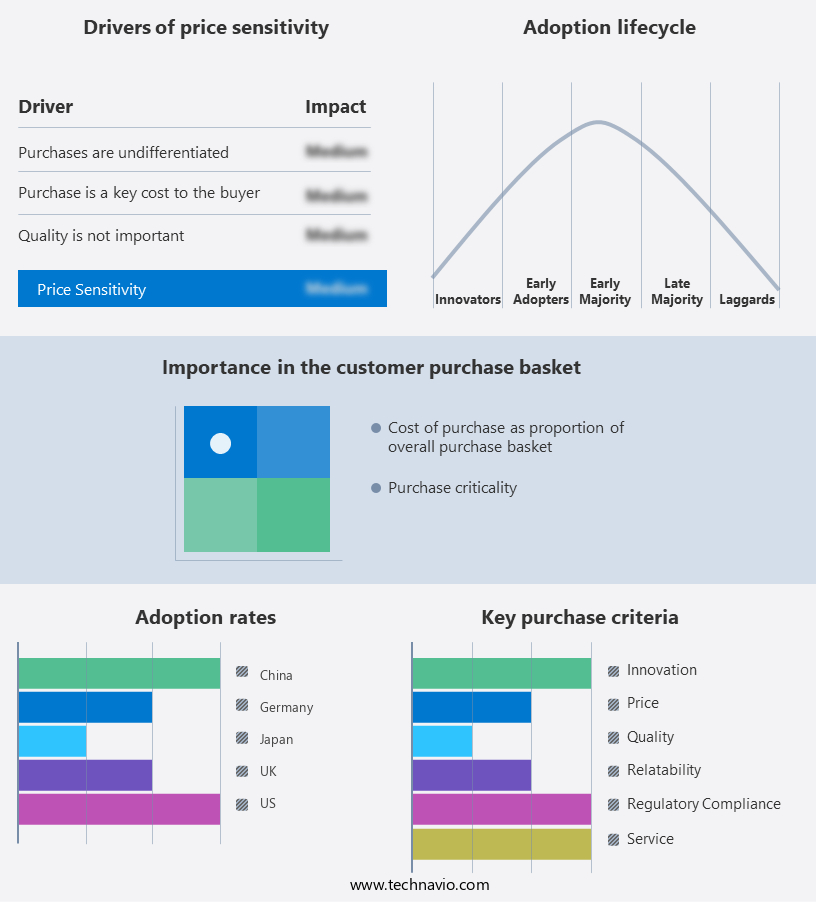
The energy trading and risk management (etrm) market forecasting report includes the adoption lifecycle of the market, covering from the innovator's stage to the laggard's stage. It focuses on adoption rates in different regions based on penetration. Furthermore, the energy trading and risk management (etrm) market report also includes key purchase criteria and drivers of price sensitivity to help companies evaluate and develop their market growth analysis strategies.

Customer Landscape
Key Companies & Market Insights
Companies are implementing various strategies, such as strategic alliances, energy trading and risk management (etrm) market forecast, partnerships, mergers and acquisitions, geographical expansion, and product/service launches, to enhance their presence in the industry.
OpenLink Financial LLC - The company specializes in providing energy trading and risk management solutions through advanced software offerings, including Accenture Energy and Utilities and Accenture Risk and Compliance. These innovative tools enable clients to effectively manage energy markets, mitigate risks, and ensure regulatory compliance. By leveraging cutting-edge technology and industry expertise, the company empowers businesses to optimize their energy strategies and enhance operational efficiency.
The industry research and growth report includes detailed analyses of the competitive landscape of the market and information about key companies, including:
- OpenLink Financial LLC
- ION Group
- Allegro Development Corporation
- Eka Software Solutions
- Amphora Inc.
- Triple Point Technology Inc.
- SAP SE
- Hitachi Energy
- Atos SE
- Capgemini SE
- Accenture plc
- CGI Group Inc.
- Fujitsu Limited
- NTT Data Corporation
- Toshiba Energy Systems & Solutions
- Beijing Energy Trading Platform Co. Ltd.
- Shanghai Electric Power Co. Ltd.
- China Huaneng Group
- Kyndryl Holdings Inc.
- Fiserv Inc.
Qualitative and quantitative analysis of companies has been conducted to help clients understand the wider business environment as well as the strengths and weaknesses of key industry players. Data is qualitatively analyzed to categorize companies as pure play, category-focused, industry-focused, and diversified; it is quantitatively analyzed to categorize companies as dominant, leading, strong, tentative, and weak.
Research Analyst Overview
In the complex and dynamic world of Energy Trading and Risk Management (ETRM), financial institutions face numerous challenges in optimizing their operations and managing risks. The ETRM market encompasses various functions, including portfolio management, back office, business intelligence, customer relationship management, and enterprise resource planning. Portfolio management plays a crucial role in ETRM, enabling institutions to effectively allocate resources and manage risk exposure. This function is integral to deriving maximum value from their trading activities in energy markets, such as gas, oil, power, emissions, and renewables. The back office is another essential component of ETRM, responsible for trade capture, position management, and regulatory reporting.
These functions are critical in ensuring accurate and timely processing of trades, maintaining proper records, and adhering to regulatory requirements. Business intelligence and data management are essential for gaining insights into market trends and managing risks effectively. The use of advanced technologies, such as machine learning and artificial intelligence, can help institutions analyze vast amounts of data in real-time, enabling them to make informed decisions and respond to market changes swiftly. Digital transformation is a key trend in the ETRM market, with financial institutions increasingly adopting cloud computing and ETRM systems to streamline their operations and improve efficiency. These technologies enable institutions to access real-time data, automate processes, and enhance collaboration between front, middle, and back office functions.
Risk management is a critical aspect of ETRM, with institutions facing various types of risks, including market risk, credit risk, and operational risk. Effective risk management requires a risk management framework, including risk appetite setting, risk identification, assessment, and mitigation strategies. Energy transition and the growing focus on renewable energy sources present new opportunities and challenges for financial institutions in the ETRM market. Managing the risks associated with these emerging markets requires a deep of the unique characteristics and complexities of renewable energy markets. Supply chain management and contract management are also essential functions in ETRM, enabling institutions to manage their relationships with counterparties and ensure the timely and efficient execution of trades.
Effective contract management is crucial in mitigating counterparty risk and ensuring compliance with regulatory requirements. Data security and regulatory compliance are critical concerns for financial institutions in the ETRM market. Ensuring the security and confidentiality of sensitive data is essential in maintaining trust with customers and regulatory authorities. Compliance with regulatory requirements is also crucial in avoiding fines and reputational damage. In , the ETRM market is a complex and dynamic environment, requiring financial institutions to effectively manage risks, optimize operations, and adapt to emerging trends. The use of advanced technologies, such as machine learning and artificial intelligence, can help institutions gain insights into market trends and make informed decisions in real-time.
|
Market Scope
|
|
Report Coverage
|
Details
|
|
Page number
|
224
|
|
Base year
|
2024
|
|
Historic period
|
2019-2023 |
|
Forecast period
|
2025-2029
|
|
Growth momentum & CAGR
|
Accelerate at a CAGR of 4.8%
|
|
Market growth 2025-2029
|
USD 457.2 million
|
|
Market structure
|
Fragmented
|
|
YoY growth 2024-2025(%)
|
4.4
|
|
Key countries
|
US, China, Japan, Germany, France, Spain, Canada, India, South Korea, France, Japan, Italy, Brazil, UAE, UK, Spain, Rest of World (ROW), and Mexico
|
|
Competitive landscape
|
Leading Companies, Market Positioning of Companies, Competitive Strategies, and Industry Risks
|
Request Free Sample
What are the Key Data Covered in this Energy Trading And Risk Management (ETRM) Market Research and Growth Report?
- CAGR of the Energy Trading And Risk Management (ETRM) industry during the forecast period
- Detailed information on factors that will drive the growth and forecasting between 2025 and 2029
- Precise estimation of the size of the market and its contribution of the industry in focus to the parent market
- Accurate predictions about upcoming growth and trends and changes in consumer behaviour
- Growth of the market across North America, APAC, Europe, South America, and Middle East and Africa
- Thorough analysis of the market's competitive landscape and detailed information about companies
- Comprehensive analysis of factors that will challenge the energy trading and risk management (etrm) market growth of industry companies
We can help! Our analysts can customize this energy trading and risk management (etrm) market research report to meet your requirements.
Get in touch
1 Executive Summary
- 1.1 Market overview
- Executive Summary - Chart on Market Overview
- Executive Summary - Data Table on Market Overview
- Executive Summary - Chart on Global Market Characteristics
- Executive Summary - Chart on Market by Geography
- Executive Summary - Chart on Market Segmentation by Application
- Executive Summary - Chart on Market Segmentation by Type
- Executive Summary - Chart on Market Segmentation by Deployment
- Executive Summary - Chart on Market Segmentation by Product Type
- Executive Summary - Chart on Incremental Growth
- Executive Summary - Data Table on Incremental Growth
- Executive Summary - Chart on Company Market Positioning
2 Technavio Analysis
- 2.1 Analysis of price sensitivity, lifecycle, customer purchase basket, adoption rates, and purchase criteria
- Analysis of price sensitivity, lifecycle, customer purchase basket, adoption rates, and purchase criteria
- 2.2 Criticality of inputs and Factors of differentiation
- Overview on criticality of inputs and factors of differentiation
- 2.3 Factors of disruption
- Overview on factors of disruption
- 2.4 Impact of drivers and challenges
- Impact of drivers and challenges in 2024 and 2029
3 Market Landscape
- 3.1 Market ecosystem
- Parent Market
- Data Table on - Parent Market
- 3.2 Market characteristics
- Market characteristics analysis
4 Market Sizing
- 4.1 Market definition
- Offerings of companies included in the market definition
- 4.2 Market segment analysis
- 4.4 Market outlook: Forecast for 2024-2029
- Chart on Global - Market size and forecast 2024-2029 ($ million)
- Data Table on Global - Market size and forecast 2024-2029 ($ million)
- Chart on Global Market: Year-over-year growth 2024-2029 (%)
- Data Table on Global Market: Year-over-year growth 2024-2029 (%)
5 Historic Market Size
- 5.1 Global Energy Trading And Risk Management (ETRM) Market 2019 - 2023
- Historic Market Size - Data Table on Global Energy Trading And Risk Management (ETRM) Market 2019 - 2023 ($ million)
- 5.2 Application segment analysis 2019 - 2023
- Historic Market Size - Application Segment 2019 - 2023 ($ million)
- 5.3 Type segment analysis 2019 - 2023
- Historic Market Size - Type Segment 2019 - 2023 ($ million)
- 5.4 Deployment segment analysis 2019 - 2023
- Historic Market Size - Deployment Segment 2019 - 2023 ($ million)
- 5.5 Product Type segment analysis 2019 - 2023
- Historic Market Size - Product Type Segment 2019 - 2023 ($ million)
- 5.6 Geography segment analysis 2019 - 2023
- Historic Market Size - Geography Segment 2019 - 2023 ($ million)
- 5.7 Country segment analysis 2019 - 2023
- Historic Market Size - Country Segment 2019 - 2023 ($ million)
6 Qualitative Analysis
- 6.1 The AI impact on Global Energy Trading and Risk Management (ETRM) Market
7 Five Forces Analysis
- 7.1 Five forces summary
- Five forces analysis - Comparison between 2024 and 2029
- 7.2 Bargaining power of buyers
- Bargaining power of buyers - Impact of key factors 2024 and 2029
- 7.3 Bargaining power of suppliers
- Bargaining power of suppliers - Impact of key factors in 2024 and 2029
- 7.4 Threat of new entrants
- Threat of new entrants - Impact of key factors in 2024 and 2029
- 7.5 Threat of substitutes
- Threat of substitutes - Impact of key factors in 2024 and 2029
- 7.6 Threat of rivalry
- Threat of rivalry - Impact of key factors in 2024 and 2029
- 7.7 Market condition
- Chart on Market condition - Five forces 2024 and 2029
8 Market Segmentation by Application
- 8.1 Market segments
- Chart on Application - Market share 2024-2029 (%)
- Data Table on Application - Market share 2024-2029 (%)
- 8.2 Comparison by Application
- Chart on Comparison by Application
- Data Table on Comparison by Application
- 8.3 Power - Market size and forecast 2024-2029
- Chart on Power - Market size and forecast 2024-2029 ($ million)
- Data Table on Power - Market size and forecast 2024-2029 ($ million)
- Chart on Power - Year-over-year growth 2024-2029 (%)
- Data Table on Power - Year-over-year growth 2024-2029 (%)
- 8.4 Natural gas - Market size and forecast 2024-2029
- Chart on Natural gas - Market size and forecast 2024-2029 ($ million)
- Data Table on Natural gas - Market size and forecast 2024-2029 ($ million)
- Chart on Natural gas - Year-over-year growth 2024-2029 (%)
- Data Table on Natural gas - Year-over-year growth 2024-2029 (%)
- 8.5 Oil and products - Market size and forecast 2024-2029
- Chart on Oil and products - Market size and forecast 2024-2029 ($ million)
- Data Table on Oil and products - Market size and forecast 2024-2029 ($ million)
- Chart on Oil and products - Year-over-year growth 2024-2029 (%)
- Data Table on Oil and products - Year-over-year growth 2024-2029 (%)
- 8.6 Others - Market size and forecast 2024-2029
- Chart on Others - Market size and forecast 2024-2029 ($ million)
- Data Table on Others - Market size and forecast 2024-2029 ($ million)
- Chart on Others - Year-over-year growth 2024-2029 (%)
- Data Table on Others - Year-over-year growth 2024-2029 (%)
- 8.7 Market opportunity by Application
- Market opportunity by Application ($ million)
- Data Table on Market opportunity by Application ($ million)
9 Market Segmentation by Type
- 9.1 Market segments
- Chart on Type - Market share 2024-2029 (%)
- Data Table on Type - Market share 2024-2029 (%)
- 9.2 Comparison by Type
- Chart on Comparison by Type
- Data Table on Comparison by Type
- 9.3 Software - Market size and forecast 2024-2029
- Chart on Software - Market size and forecast 2024-2029 ($ million)
- Data Table on Software - Market size and forecast 2024-2029 ($ million)
- Chart on Software - Year-over-year growth 2024-2029 (%)
- Data Table on Software - Year-over-year growth 2024-2029 (%)
- 9.4 Service - Market size and forecast 2024-2029
- Chart on Service - Market size and forecast 2024-2029 ($ million)
- Data Table on Service - Market size and forecast 2024-2029 ($ million)
- Chart on Service - Year-over-year growth 2024-2029 (%)
- Data Table on Service - Year-over-year growth 2024-2029 (%)
- 9.5 Market opportunity by Type
- Market opportunity by Type ($ million)
- Data Table on Market opportunity by Type ($ million)
10 Market Segmentation by Deployment
- 10.1 Market segments
- Chart on Deployment - Market share 2024-2029 (%)
- Data Table on Deployment - Market share 2024-2029 (%)
- 10.2 Comparison by Deployment
- Chart on Comparison by Deployment
- Data Table on Comparison by Deployment
- 10.3 SaaS or hosted service - Market size and forecast 2024-2029
- Chart on SaaS or hosted service - Market size and forecast 2024-2029 ($ million)
- Data Table on SaaS or hosted service - Market size and forecast 2024-2029 ($ million)
- Chart on SaaS or hosted service - Year-over-year growth 2024-2029 (%)
- Data Table on SaaS or hosted service - Year-over-year growth 2024-2029 (%)
- 10.4 Vendor license - Market size and forecast 2024-2029
- Chart on Vendor license - Market size and forecast 2024-2029 ($ million)
- Data Table on Vendor license - Market size and forecast 2024-2029 ($ million)
- Chart on Vendor license - Year-over-year growth 2024-2029 (%)
- Data Table on Vendor license - Year-over-year growth 2024-2029 (%)
- 10.5 Market opportunity by Deployment
- Market opportunity by Deployment ($ million)
- Data Table on Market opportunity by Deployment ($ million)
11 Market Segmentation by Product Type
- 11.1 Market segments
- Chart on Product Type - Market share 2024-2029 (%)
- Data Table on Product Type - Market share 2024-2029 (%)
- 11.2 Comparison by Product Type
- Chart on Comparison by Product Type
- Data Table on Comparison by Product Type
- 11.3 Front office - Market size and forecast 2024-2029
- Chart on Front office - Market size and forecast 2024-2029 ($ million)
- Data Table on Front office - Market size and forecast 2024-2029 ($ million)
- Chart on Front office - Year-over-year growth 2024-2029 (%)
- Data Table on Front office - Year-over-year growth 2024-2029 (%)
- 11.4 Middle office - Market size and forecast 2024-2029
- Chart on Middle office - Market size and forecast 2024-2029 ($ million)
- Data Table on Middle office - Market size and forecast 2024-2029 ($ million)
- Chart on Middle office - Year-over-year growth 2024-2029 (%)
- Data Table on Middle office - Year-over-year growth 2024-2029 (%)
- 11.5 Back office - Market size and forecast 2024-2029
- Chart on Back office - Market size and forecast 2024-2029 ($ million)
- Data Table on Back office - Market size and forecast 2024-2029 ($ million)
- Chart on Back office - Year-over-year growth 2024-2029 (%)
- Data Table on Back office - Year-over-year growth 2024-2029 (%)
- 11.6 Market opportunity by Product Type
- Market opportunity by Product Type ($ million)
- Data Table on Market opportunity by Product Type ($ million)
12 Market Segmentation by Application
- 12.1 Market segments
- Chart on Application - Market share (2024-2029) (%)
- Data Table on Application - Market share (2024-2029) (%)
- 12.2 Comparison by Application
- Chart on Comparison by Application
- Data Table on Comparison by Application
- 12.3 Commodity Trading - Market size and forecast (2024-2029)
- Chart on Commodity Trading - Market size and forecast (2024-2029) ($ million)
- Data Table on Commodity Trading - Market size and forecast (2024-2029) ($ million)
- Chart on Commodity Trading - Year-over-year growth (2024-2029) (%)
- Data Table on Commodity Trading - Year-over-year growth (2024-2029) (%)
- 12.4 Portfolio Management - Market size and forecast (2024-2029)
- Chart on Portfolio Management - Market size and forecast (2024-2029) ($ million)
- Data Table on Portfolio Management - Market size and forecast (2024-2029) ($ million)
- Chart on Portfolio Management - Year-over-year growth (2024-2029) (%)
- Data Table on Portfolio Management - Year-over-year growth (2024-2029) (%)
- 12.5 Compliance - Market size and forecast (2024-2029)
- Chart on Compliance - Market size and forecast (2024-2029) ($ million)
- Data Table on Compliance - Market size and forecast (2024-2029) ($ million)
- Chart on Compliance - Year-over-year growth (2024-2029) (%)
- Data Table on Compliance - Year-over-year growth (2024-2029) (%)
- 12.6 Market opportunity by Application
- Market opportunity by Application ($ million)
- Data Table on Market opportunity by Application ($ million)
13 Market Segmentation by Type
- 13.1 Market segments
- Chart on Type - Market share (2024-2029) (%)
- Data Table on Type - Market share (2024-2029) (%)
- 13.2 Comparison by Type
- Chart on Comparison by Type
- Data Table on Comparison by Type
- 13.3 Software - Market size and forecast (2024-2029)
- Chart on Software - Market size and forecast (2024-2029) ($ million)
- Data Table on Software - Market size and forecast (2024-2029) ($ million)
- Chart on Software - Year-over-year growth (2024-2029) (%)
- Data Table on Software - Year-over-year growth (2024-2029) (%)
- 13.4 Service - Market size and forecast (2024-2029)
- Chart on Service - Market size and forecast (2024-2029) ($ million)
- Data Table on Service - Market size and forecast (2024-2029) ($ million)
- Chart on Service - Year-over-year growth (2024-2029) (%)
- Data Table on Service - Year-over-year growth (2024-2029) (%)
- 13.5 Market opportunity by Type
- Market opportunity by Type ($ million)
- Data Table on Market opportunity by Type ($ million)
14 Market Segmentation by Deployment
- 14.1 Market segments
- Chart on Deployment - Market share (2024-2029) (%)
- Data Table on Deployment - Market share (2024-2029) (%)
- 14.2 Comparison by Deployment
- Chart on Comparison by Deployment
- Data Table on Comparison by Deployment
- 14.3 SaaS or hosted service - Market size and forecast (2024-2029)
- Chart on SaaS or hosted service - Market size and forecast (2024-2029) ($ million)
- Data Table on SaaS or hosted service - Market size and forecast (2024-2029) ($ million)
- Chart on SaaS or hosted service - Year-over-year growth (2024-2029) (%)
- Data Table on SaaS or hosted service - Year-over-year growth (2024-2029) (%)
- 14.4 Vendor license - Market size and forecast (2024-2029)
- Chart on Vendor license - Market size and forecast (2024-2029) ($ million)
- Data Table on Vendor license - Market size and forecast (2024-2029) ($ million)
- Chart on Vendor license - Year-over-year growth (2024-2029) (%)
- Data Table on Vendor license - Year-over-year growth (2024-2029) (%)
- 14.5 Market opportunity by Deployment
- Market opportunity by Deployment ($ million)
- Data Table on Market opportunity by Deployment ($ million)
15 Market Segmentation by Product Type
- 15.1 Market segments
- Chart on Product Type - Market share (2024-2029) (%)
- Data Table on Product Type - Market share (2024-2029) (%)
- 15.2 Comparison by Product Type
- Chart on Comparison by Product Type
- Data Table on Comparison by Product Type
- 15.3 Front office - Market size and forecast (2024-2029)
- Chart on Front office - Market size and forecast (2024-2029) ($ million)
- Data Table on Front office - Market size and forecast (2024-2029) ($ million)
- Chart on Front office - Year-over-year growth (2024-2029) (%)
- Data Table on Front office - Year-over-year growth (2024-2029) (%)
- 15.4 Middle office - Market size and forecast (2024-2029)
- Chart on Middle office - Market size and forecast (2024-2029) ($ million)
- Data Table on Middle office - Market size and forecast (2024-2029) ($ million)
- Chart on Middle office - Year-over-year growth (2024-2029) (%)
- Data Table on Middle office - Year-over-year growth (2024-2029) (%)
- 15.5 Back office - Market size and forecast (2024-2029)
- Chart on Back office - Market size and forecast (2024-2029) ($ million)
- Data Table on Back office - Market size and forecast (2024-2029) ($ million)
- Chart on Back office - Year-over-year growth (2024-2029) (%)
- Data Table on Back office - Year-over-year growth (2024-2029) (%)
- 15.6 Market opportunity by Product Type
- Market opportunity by Product Type ($ million)
- Data Table on Market opportunity by Product Type ($ million)
16 Market Segmentation by Geography
- 16.1 Market segments
- Chart on Geography - Market share (2024-2029) (%)
- Data Table on Geography - Market share (2024-2029) (%)
- 16.2 Comparison by Geography
- Chart on Comparison by Geography
- Data Table on Comparison by Geography
- 16.3 North America - Market size and forecast (2024-2029)
- Chart on North America - Market size and forecast (2024-2029) ($ million)
- Data Table on North America - Market size and forecast (2024-2029) ($ million)
- Chart on North America - Year-over-year growth (2024-2029) (%)
- Data Table on North America - Year-over-year growth (2024-2029) (%)
- 16.4 APAC - Market size and forecast (2024-2029)
- Chart on APAC - Market size and forecast (2024-2029) ($ million)
- Data Table on APAC - Market size and forecast (2024-2029) ($ million)
- Chart on APAC - Year-over-year growth (2024-2029) (%)
- Data Table on APAC - Year-over-year growth (2024-2029) (%)
- 16.5 Europe - Market size and forecast (2024-2029)
- Chart on Europe - Market size and forecast (2024-2029) ($ million)
- Data Table on Europe - Market size and forecast (2024-2029) ($ million)
- Chart on Europe - Year-over-year growth (2024-2029) (%)
- Data Table on Europe - Year-over-year growth (2024-2029) (%)
- 16.6 South America - Market size and forecast (2024-2029)
- Chart on South America - Market size and forecast (2024-2029) ($ million)
- Data Table on South America - Market size and forecast (2024-2029) ($ million)
- Chart on South America - Year-over-year growth (2024-2029) (%)
- Data Table on South America - Year-over-year growth (2024-2029) (%)
- 16.7 Middle East and Africa - Market size and forecast (2024-2029)
- Chart on Middle East and Africa - Market size and forecast (2024-2029) ($ million)
- Data Table on Middle East and Africa - Market size and forecast (2024-2029) ($ million)
- Chart on Middle East and Africa - Year-over-year growth (2024-2029) (%)
- Data Table on Middle East and Africa - Year-over-year growth (2024-2029) (%)
- 16.8 Market opportunity by Geography
- Market opportunity by Geography ($ million)
- Data Table on Market opportunity by Geography ($ million)
17 Market Segmentation by Application
- 17.1 Market segments
- Chart on Application - Market share (2024-2029) (%)
- Data Table on Application - Market share (2024-2029) (%)
- 17.2 Comparison by Application
- Chart on Comparison by Application
- Data Table on Comparison by Application
- 17.3 Commodity Trading - Market size and forecast (2024-2029)
- Chart on Commodity Trading - Market size and forecast (2024-2029) ($ million)
- Data Table on Commodity Trading - Market size and forecast (2024-2029) ($ million)
- Chart on Commodity Trading - Year-over-year growth (2024-2029) (%)
- Data Table on Commodity Trading - Year-over-year growth (2024-2029) (%)
- 17.4 Portfolio Management - Market size and forecast (2024-2029)
- Chart on Portfolio Management - Market size and forecast (2024-2029) ($ million)
- Data Table on Portfolio Management - Market size and forecast (2024-2029) ($ million)
- Chart on Portfolio Management - Year-over-year growth (2024-2029) (%)
- Data Table on Portfolio Management - Year-over-year growth (2024-2029) (%)
- 17.5 Compliance - Market size and forecast (2024-2029)
- Chart on Compliance - Market size and forecast (2024-2029) ($ million)
- Data Table on Compliance - Market size and forecast (2024-2029) ($ million)
- Chart on Compliance - Year-over-year growth (2024-2029) (%)
- Data Table on Compliance - Year-over-year growth (2024-2029) (%)
- 17.6 Market opportunity by Application
- Market opportunity by Application ($ million)
- Data Table on Market opportunity by Application ($ million)
18 Market Segmentation by Solution Type
- 18.1 Market segments
- Chart on Solution Type - Market share (2024-2029) (%)
- Data Table on Solution Type - Market share (2024-2029) (%)
- 18.2 Comparison by Solution Type
- Chart on Comparison by Solution Type
- Data Table on Comparison by Solution Type
- 18.3 Trading Platforms - Market size and forecast (2024-2029)
- Chart on Trading Platforms - Market size and forecast (2024-2029) ($ million)
- Data Table on Trading Platforms - Market size and forecast (2024-2029) ($ million)
- Chart on Trading Platforms - Year-over-year growth (2024-2029) (%)
- Data Table on Trading Platforms - Year-over-year growth (2024-2029) (%)
- 18.4 Risk Management Software - Market size and forecast (2024-2029)
- Chart on Risk Management Software - Market size and forecast (2024-2029) ($ million)
- Data Table on Risk Management Software - Market size and forecast (2024-2029) ($ million)
- Chart on Risk Management Software - Year-over-year growth (2024-2029) (%)
- Data Table on Risk Management Software - Year-over-year growth (2024-2029) (%)
- 18.5 Analytics Tools - Market size and forecast (2024-2029)
- Chart on Analytics Tools - Market size and forecast (2024-2029) ($ million)
- Data Table on Analytics Tools - Market size and forecast (2024-2029) ($ million)
- Chart on Analytics Tools - Year-over-year growth (2024-2029) (%)
- Data Table on Analytics Tools - Year-over-year growth (2024-2029) (%)
- 18.6 Market opportunity by Solution Type
- Market opportunity by Solution Type ($ million)
- Data Table on Market opportunity by Solution Type ($ million)
19 Customer Landscape
- 19.1 Customer landscape overview
- Analysis of price sensitivity, lifecycle, customer purchase basket, adoption rates, and purchase criteria
20 Geographic Landscape
- 20.1 Geographic segmentation
- Chart on Market share by geography 2024-2029 (%)
- Data Table on Market share by geography 2024-2029 (%)
- 20.2 Geographic comparison
- Chart on Geographic comparison
- Data Table on Geographic comparison
- 20.3 North America - Market size and forecast 2024-2029
- Chart on North America - Market size and forecast 2024-2029 ($ million)
- Data Table on North America - Market size and forecast 2024-2029 ($ million)
- Chart on North America - Year-over-year growth 2024-2029 (%)
- Data Table on North America - Year-over-year growth 2024-2029 (%)
- 20.4 APAC - Market size and forecast 2024-2029
- Chart on APAC - Market size and forecast 2024-2029 ($ million)
- Data Table on APAC - Market size and forecast 2024-2029 ($ million)
- Chart on APAC - Year-over-year growth 2024-2029 (%)
- Data Table on APAC - Year-over-year growth 2024-2029 (%)
- 20.5 Europe - Market size and forecast 2024-2029
- Chart on Europe - Market size and forecast 2024-2029 ($ million)
- Data Table on Europe - Market size and forecast 2024-2029 ($ million)
- Chart on Europe - Year-over-year growth 2024-2029 (%)
- Data Table on Europe - Year-over-year growth 2024-2029 (%)
- 20.6 South America - Market size and forecast 2024-2029
- Chart on South America - Market size and forecast 2024-2029 ($ million)
- Data Table on South America - Market size and forecast 2024-2029 ($ million)
- Chart on South America - Year-over-year growth 2024-2029 (%)
- Data Table on South America - Year-over-year growth 2024-2029 (%)
- 20.7 Middle East and Africa - Market size and forecast 2024-2029
- Chart on Middle East and Africa - Market size and forecast 2024-2029 ($ million)
- Data Table on Middle East and Africa - Market size and forecast 2024-2029 ($ million)
- Chart on Middle East and Africa - Year-over-year growth 2024-2029 (%)
- Data Table on Middle East and Africa - Year-over-year growth 2024-2029 (%)
- 20.8 US - Market size and forecast 2024-2029
- Chart on US - Market size and forecast 2024-2029 ($ million)
- Data Table on US - Market size and forecast 2024-2029 ($ million)
- Chart on US - Year-over-year growth 2024-2029 (%)
- Data Table on US - Year-over-year growth 2024-2029 (%)
- 20.9 China - Market size and forecast 2024-2029
- Chart on China - Market size and forecast 2024-2029 ($ million)
- Data Table on China - Market size and forecast 2024-2029 ($ million)
- Chart on China - Year-over-year growth 2024-2029 (%)
- Data Table on China - Year-over-year growth 2024-2029 (%)
- 20.10 Canada - Market size and forecast 2024-2029
- Chart on Canada - Market size and forecast 2024-2029 ($ million)
- Data Table on Canada - Market size and forecast 2024-2029 ($ million)
- Chart on Canada - Year-over-year growth 2024-2029 (%)
- Data Table on Canada - Year-over-year growth 2024-2029 (%)
- 20.11 Japan - Market size and forecast 2024-2029
- Chart on Japan - Market size and forecast 2024-2029 ($ million)
- Data Table on Japan - Market size and forecast 2024-2029 ($ million)
- Chart on Japan - Year-over-year growth 2024-2029 (%)
- Data Table on Japan - Year-over-year growth 2024-2029 (%)
- 20.12 UK - Market size and forecast 2024-2029
- Chart on UK - Market size and forecast 2024-2029 ($ million)
- Data Table on UK - Market size and forecast 2024-2029 ($ million)
- Chart on UK - Year-over-year growth 2024-2029 (%)
- Data Table on UK - Year-over-year growth 2024-2029 (%)
- 20.13 India - Market size and forecast 2024-2029
- Chart on India - Market size and forecast 2024-2029 ($ million)
- Data Table on India - Market size and forecast 2024-2029 ($ million)
- Chart on India - Year-over-year growth 2024-2029 (%)
- Data Table on India - Year-over-year growth 2024-2029 (%)
- 20.14 Germany - Market size and forecast 2024-2029
- Chart on Germany - Market size and forecast 2024-2029 ($ million)
- Data Table on Germany - Market size and forecast 2024-2029 ($ million)
- Chart on Germany - Year-over-year growth 2024-2029 (%)
- Data Table on Germany - Year-over-year growth 2024-2029 (%)
- 20.15 South Korea - Market size and forecast 2024-2029
- Chart on South Korea - Market size and forecast 2024-2029 ($ million)
- Data Table on South Korea - Market size and forecast 2024-2029 ($ million)
- Chart on South Korea - Year-over-year growth 2024-2029 (%)
- Data Table on South Korea - Year-over-year growth 2024-2029 (%)
- 20.16 France - Market size and forecast 2024-2029
- Chart on France - Market size and forecast 2024-2029 ($ million)
- Data Table on France - Market size and forecast 2024-2029 ($ million)
- Chart on France - Year-over-year growth 2024-2029 (%)
- Data Table on France - Year-over-year growth 2024-2029 (%)
- 20.17 Italy - Market size and forecast 2024-2029
- Chart on Italy - Market size and forecast 2024-2029 ($ million)
- Data Table on Italy - Market size and forecast 2024-2029 ($ million)
- Chart on Italy - Year-over-year growth 2024-2029 (%)
- Data Table on Italy - Year-over-year growth 2024-2029 (%)
- 20.18 Market opportunity by geography
- Market opportunity by geography ($ million)
- Data Tables on Market opportunity by geography ($ million)
- 20.19 Brazil - Market size and forecast (2024-2029)
- Chart on Brazil - Market size and forecast (2024-2029) ($ million)
- Data Table on Brazil - Market size and forecast (2024-2029) ($ million)
- Chart on Brazil - Year-over-year growth (2024-2029) (%)
- Data Table on Brazil - Year-over-year growth (2024-2029) (%)
- 20.20 UAE - Market size and forecast (2024-2029)
- Chart on UAE - Market size and forecast (2024-2029) ($ million)
- Data Table on UAE - Market size and forecast (2024-2029) ($ million)
- Chart on UAE - Year-over-year growth (2024-2029) (%)
- Data Table on UAE - Year-over-year growth (2024-2029) (%)
- 20.21 Spain - Market size and forecast (2024-2029)
- Chart on Spain - Market size and forecast (2024-2029) ($ million)
- Data Table on Spain - Market size and forecast (2024-2029) ($ million)
- Chart on Spain - Year-over-year growth (2024-2029) (%)
- Data Table on Spain - Year-over-year growth (2024-2029) (%)
- 20.22 Mexico - Market size and forecast (2024-2029)
- Chart on Mexico - Market size and forecast (2024-2029) ($ million)
- Data Table on Mexico - Market size and forecast (2024-2029) ($ million)
- Chart on Mexico - Year-over-year growth (2024-2029) (%)
- Data Table on Mexico - Year-over-year growth (2024-2029) (%)
- 20.23 Rest of World (ROW) - Market size and forecast (2024-2029)
- Chart on Rest of World (ROW) - Market size and forecast (2024-2029) ($ million)
- Data Table on Rest of World (ROW) - Market size and forecast (2024-2029) ($ million)
- Chart on Rest of World (ROW) - Year-over-year growth (2024-2029) (%)
- Data Table on Rest of World (ROW) - Year-over-year growth (2024-2029) (%)
21 Drivers, Challenges, and Opportunity/Restraints
- 21.3 Impact of drivers and challenges
- Impact of drivers and challenges in 2024 and 2029
- 21.4 Market opportunities/restraints
22 Competitive Landscape
- 22.2 Competitive Landscape
- Overview on criticality of inputs and factors of differentiation
- 22.3 Landscape disruption
- Overview on factors of disruption
- 22.4 Industry risks
- Impact of key risks on business
23 Competitive Analysis
- 23.2 Market positioning of companies
- Matrix on companies position and classification
- 23.3 OpenLink Financial LLC
- OpenLink Financial LLC - Overview
- OpenLink Financial LLC - Product / Service
- OpenLink Financial LLC - Key offerings
- 23.4 ION Group
- ION Group - Overview
- ION Group - Product / Service
- ION Group - Key offerings
- 23.5 Allegro Development Corporation
- Allegro Development Corporation - Overview
- Allegro Development Corporation - Product / Service
- Allegro Development Corporation - Key offerings
- 23.6 Eka Software Solutions
- Eka Software Solutions - Overview
- Eka Software Solutions - Product / Service
- Eka Software Solutions - Key offerings
- 23.7 Amphora Inc.
- Amphora Inc. - Overview
- Amphora Inc. - Product / Service
- Amphora Inc. - Key offerings
- 23.8 Triple Point Technology Inc.
- Triple Point Technology Inc. - Overview
- Triple Point Technology Inc. - Product / Service
- Triple Point Technology Inc. - Key offerings
- 23.9 SAP SE
- SAP SE - Overview
- SAP SE - Product / Service
- SAP SE - Key offerings
- 23.10 Hitachi Energy
- Hitachi Energy - Overview
- Hitachi Energy - Product / Service
- Hitachi Energy - Key offerings
- 23.11 Atos SE
- Atos SE - Overview
- Atos SE - Product / Service
- Atos SE - Key offerings
- 23.12 Capgemini SE
- Capgemini SE - Overview
- Capgemini SE - Product / Service
- Capgemini SE - Key offerings
- 23.13 Accenture plc
- Accenture plc - Overview
- Accenture plc - Product / Service
- Accenture plc - Key offerings
- 23.14 CGI Group Inc.
- CGI Group Inc. - Overview
- CGI Group Inc. - Product / Service
- CGI Group Inc. - Key offerings
- 23.15 Fujitsu Limited
- Fujitsu Limited - Overview
- Fujitsu Limited - Product / Service
- Fujitsu Limited - Key offerings
- 23.16 NTT Data Corporation
- NTT Data Corporation - Overview
- NTT Data Corporation - Product / Service
- NTT Data Corporation - Key offerings
- 23.17 Toshiba Energy Systems & Solutions
- Toshiba Energy Systems & Solutions - Overview
- Toshiba Energy Systems & Solutions - Product / Service
- Toshiba Energy Systems & Solutions - Key offerings
- 23.18 Beijing Energy Trading Platform Co. Ltd.
- Beijing Energy Trading Platform Co. Ltd. - Overview
- Beijing Energy Trading Platform Co. Ltd. - Product / Service
- Beijing Energy Trading Platform Co. Ltd. - Key offerings
- 23.19 Shanghai Electric Power Co. Ltd.
- Shanghai Electric Power Co. Ltd. - Overview
- Shanghai Electric Power Co. Ltd. - Product / Service
- Shanghai Electric Power Co. Ltd. - Key offerings
- 23.20 China Huaneng Group
- China Huaneng Group - Overview
- China Huaneng Group - Product / Service
- China Huaneng Group - Key offerings
- 23.21 Kyndryl Holdings Inc.
- Kyndryl Holdings Inc. - Overview
- Kyndryl Holdings Inc. - Product / Service
- Kyndryl Holdings Inc. - Key offerings
- 23.22 Fiserv Inc.
- Fiserv Inc. - Overview
- Fiserv Inc. - Product / Service
- Fiserv Inc. - Key offerings
- 23.23 Accenture PLC
- Accenture PLC - Overview
- Accenture PLC - Product / Service
- Accenture PLC - Key offerings
- 23.24 Brady Technologies
- Brady Technologies - Overview
- Brady Technologies - Product / Service
- Brady Technologies - Key offerings
- 23.25 ENGIE SA
- ENGIE SA - Overview
- ENGIE SA - Product / Service
- ENGIE SA - Key offerings
- 23.26 Enuit LLC
- Enuit LLC - Overview
- Enuit LLC - Product / Service
- Enuit LLC - Key offerings
- 23.27 Enverus Inc.
- Enverus Inc. - Overview
- Enverus Inc. - Product / Service
- Enverus Inc. - Key offerings
- 23.28 Fidelity National Information Services Inc.
- Fidelity National Information Services Inc. - Overview
- Fidelity National Information Services Inc. - Product / Service
- Fidelity National Information Services Inc. - Key offerings
- 23.29 FTI Consulting Inc.
- FTI Consulting Inc. - Overview
- FTI Consulting Inc. - Product / Service
- FTI Consulting Inc. - Key offerings
- 23.30 IGNITE CTRM LLC
- IGNITE CTRM LLC - Overview
- IGNITE CTRM LLC - Product / Service
- IGNITE CTRM LLC - Key offerings
- 23.31 ION Group
- ION Group - Overview
- ION Group - Product / Service
- ION Group - Key offerings
- 23.32 nGenue LLC
- nGenue LLC - Overview
- nGenue LLC - Product / Service
- nGenue LLC - Key offerings
- 23.33 Open Access Technology International Inc.
- Open Access Technology International Inc. - Overview
- Open Access Technology International Inc. - Product / Service
- Open Access Technology International Inc. - Key offerings
- 23.34 Publicis Sapient
- Publicis Sapient - Overview
- Publicis Sapient - Product / Service
- Publicis Sapient - Key offerings
- 23.35 Quorum Business Solutions Inc.
- Quorum Business Solutions Inc. - Overview
- Quorum Business Solutions Inc. - Product / Service
- Quorum Business Solutions Inc. - Key offerings
- 23.36 SAP SE
- SAP SE - Overview
- SAP SE - Product / Service
- SAP SE - Key offerings
- 23.37 The MathWorks Inc.
- The MathWorks Inc. - Overview
- The MathWorks Inc. - Product / Service
- The MathWorks Inc. - Key offerings
- 23.38 TotalEnergies SE
- TotalEnergies SE - Overview
- TotalEnergies SE - Product / Service
- TotalEnergies SE - Key offerings
- 23.39 Wipro Ltd.
- Wipro Ltd. - Overview
- Wipro Ltd. - Product / Service
- Wipro Ltd. - Key offerings
24 Appendix
- 24.2 Inclusions and exclusions checklist
- Inclusions checklist
- Exclusions checklist
- 24.3 Currency conversion rates for US$
- Currency conversion rates for US$
- 24.4 Research methodology
- 24.7 Validation techniques employed for market sizing
- Validation techniques employed for market sizing
- 24.9 360 degree market analysis
- 360 degree market analysis
- 24.10 List of abbreviations