Enterprise Generative AI Market Analysis, Size, and Forecast 2025-2029: North America (US, Canada, and Mexico), APAC (China, Japan, and India), Europe (Germany, UK, and France), Middle East and Africa (UAE, Saudi Arabia, and Israel), South America (Brazil, Argentina, and Colombia), and Rest of World (ROW)

Enterprise Generative AI Market Analysis, Size, and Forecast 2025-2029:
North America (US, Canada, and Mexico), APAC (China, Japan, and India), Europe (Germany, UK, and France), Middle East and Africa (UAE, Saudi Arabia, and Israel), South America (Brazil, Argentina, and Colombia), and Rest of World (ROW)

Published: Dec 2025 290 Pages SKU: IRTNTR81071

Market Overview at a Glance

$9.24 B
Market Opportunity
36.2%
CAGR
40.1%
North America Growth

Enterprise Generative AI Market Size 2025-2029

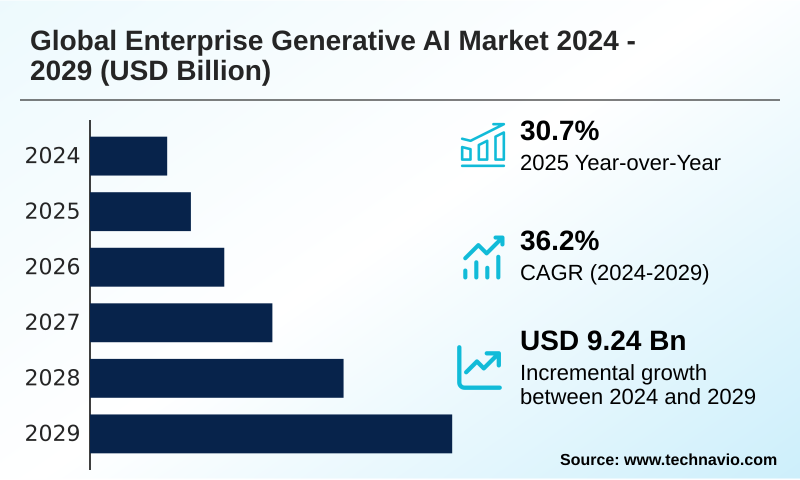
The enterprise generative ai market size is valued to increase by USD 9.24 billion, at a CAGR of 36.2% from 2024 to 2029. Surging demand for hyper-automation and operational efficiency will drive the enterprise generative ai market.

Major Market Trends & Insights

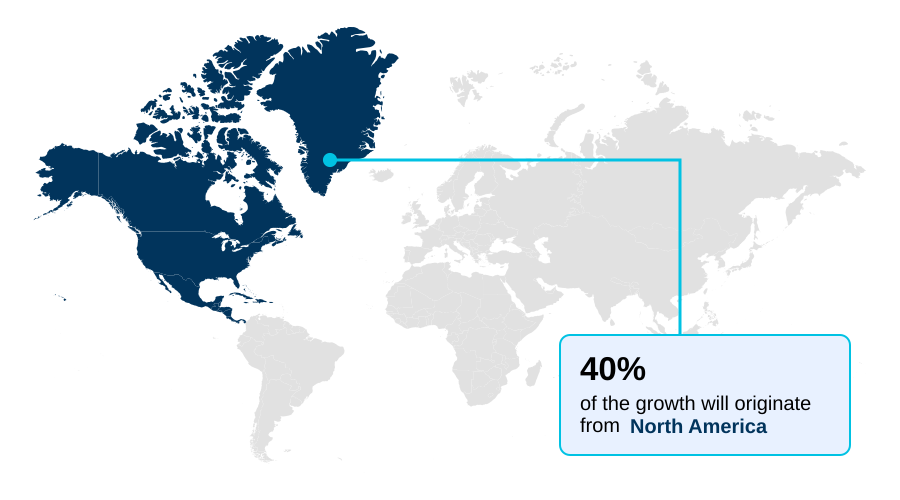
  • North America dominated the market and accounted for a 40.1% growth during the forecast period.
  • CAGR from 2024 to 2029 : 36.2%

Market Summary

  • The Enterprise Generative AI market is transitioning from experimental phases to strategic, large-scale implementation across industries. This shift is driven by the clear value proposition of augmenting human productivity and achieving significant operational efficiencies. Organizations are moving beyond basic chatbots to deploy sophisticated systems for complex tasks like generative design, software development, and advanced data synthesis.
  • For instance, in supply chain management, businesses use AI to generate synthetic logistics data, enabling them to model and stress-test their networks against potential disruptions without using sensitive real-world information. The technology, including advanced techniques like retrieval-augmented generation (RAG) and generative adversarial networks (GANs), helps create more resilient and predictive operational frameworks.
  • However, this adoption is tempered by challenges such as ensuring data privacy, managing high computational costs, and navigating an evolving regulatory landscape, which demands robust governance and ethical oversight for sustainable, long-term deployment.

What will be the Size of the Enterprise Generative AI Market during the forecast period?

Get Key Insights on Market Forecast (PDF) Request Free Sample

How is the Enterprise Generative AI Market Segmented?

The enterprise generative ai industry research report provides comprehensive data (region-wise segment analysis), with forecasts and estimates in "USD million" for the period 2025-2029.
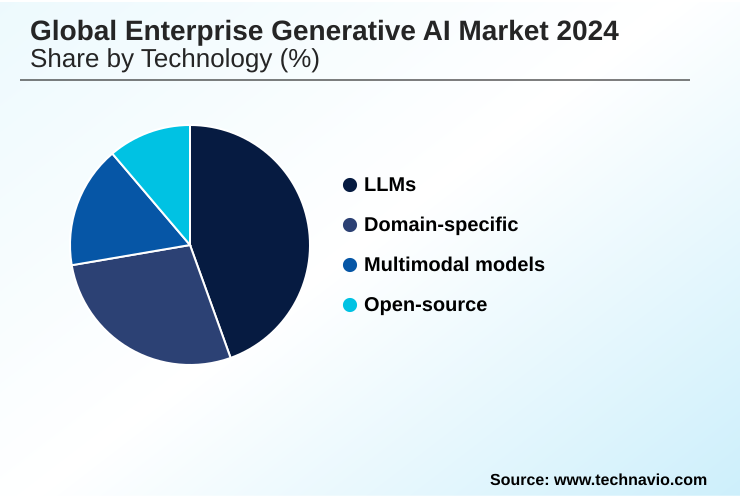
  • Technology
    • LLMs
    • Domain-specific
    • Multimodal models
    • Open-source
  • Application
    • Content creation
    • Code generation
    • Data augmentation
    • Others
  • Deployment
    • Cloud-based
    • Hybrid
    • On-premises
  • Geography
    • North America
      • US
      • Canada
      • Mexico
    • APAC
      • China
      • Japan
      • India
    • Europe
      • Germany
      • UK
      • France
    • Middle East and Africa
      • UAE
      • Saudi Arabia
      • Israel
    • South America
      • Brazil
      • Argentina
      • Colombia
    • Rest of World (ROW)

By Technology Insights

The llms segment is estimated to witness significant growth during the forecast period.

The Enterprise Generative AI Market is fundamentally shaped by large language models, which leverage complex neural network architecture to power applications. These systems are pivotal for functions like cognitive process automation and advanced knowledge management AI.

Enterprises utilize these models for synthetic data generation and data augmentation techniques to train other machine learning systems, addressing data scarcity. The deployment landscape is increasingly favoring a hybrid AI infrastructure, balancing cloud flexibility with on-premise security.

A key focus is on AI risk management and enabling custom AI model training to refine outputs.

Through sophisticated natural language understanding (NLU) and expanded AI model context windows, these technologies are transforming AI-driven software development, with some firms improving code quality by over 25%.

This evolution is critical for building robust, enterprise-ready generative adversarial networks (GANs) and other advanced systems.

Request Free Sample

Regional Analysis

North America is estimated to contribute 40.1% to the growth of the global market during the forecast period.Technavio’s analysts have elaborately explained the regional trends and drivers that shape the market during the forecast period.

See How Enterprise Generative AI Market Demand is Rising in North America Request Free Sample

The global landscape is characterized by diverse adoption strategies, heavily influenced by regional infrastructure and regulatory priorities. North America leads in foundation model development, while APAC is seeing the fastest growth in enterprise generative AI applications.

The expansion of cloud-based deployment models and managed AI services is crucial for this growth, providing accessible API-based AI access.

In regions like Europe, the emphasis on data sovereignty solutions is driving demand for private cloud AI and secure, on-premise code generation tools.

Enterprises globally are deploying open-source models for custom solutions in areas like sales enablement AI and research assistance tools, ensuring both AI safety and reliability.

This distributed innovation is critical for building production-grade AI systems, with adoption in emerging markets showing a 2x increase in pilot projects over the last year. Enhanced enterprise search AI is becoming a standard feature.

Market Dynamics

Our researchers analyzed the data with 2024 as the base year, along with the key drivers, trends, and challenges. A holistic analysis of drivers will help companies refine their marketing strategies to gain a competitive advantage.

  • As organizations mature in their AI journey, strategic decisions are moving beyond initial adoption to focus on long-term value and risk mitigation. Boardroom conversations now center on the vertical integration impact on AI market dynamics and the necessity of custom silicon for AI model training to gain a competitive edge.
  • A primary focus is on implementing secure on-premise generative AI to protect sensitive data, which is a critical aspect of managing generative AI intellectual property risks and ensuring data privacy with third-party AI models. The generative AI role in operational efficiency is undisputed, but leaders are now analyzing how to manage generative AI implementation costs effectively.
  • This involves comparing cloud vs hybrid generative AI deployment models to balance scalability with control. Success hinges on robust enterprise AI platform governance strategies designed to minimize security vulnerabilities and reduce AI model hallucination in enterprise settings, with firms adopting such frameworks reporting 20% fewer data-related incidents.
  • For specific sectors, applications like multimodal generative AI for manufacturing and generative AI for synthetic data in healthcare are unlocking new possibilities.
  • Ultimately, leveraging AI for new revenue streams through initiatives like open-source generative AI model customization and generative AI for hyper-personalized marketing requires addressing ethical considerations in enterprise AI deployment and developing effective generative AI talent acquisition strategies to secure the necessary expertise.
  • These factors are crucial for capitalizing on opportunities in generative AI for software development acceleration and generative AI applications in financial services.

What are the key market drivers leading to the rise in the adoption of Enterprise Generative AI Industry?

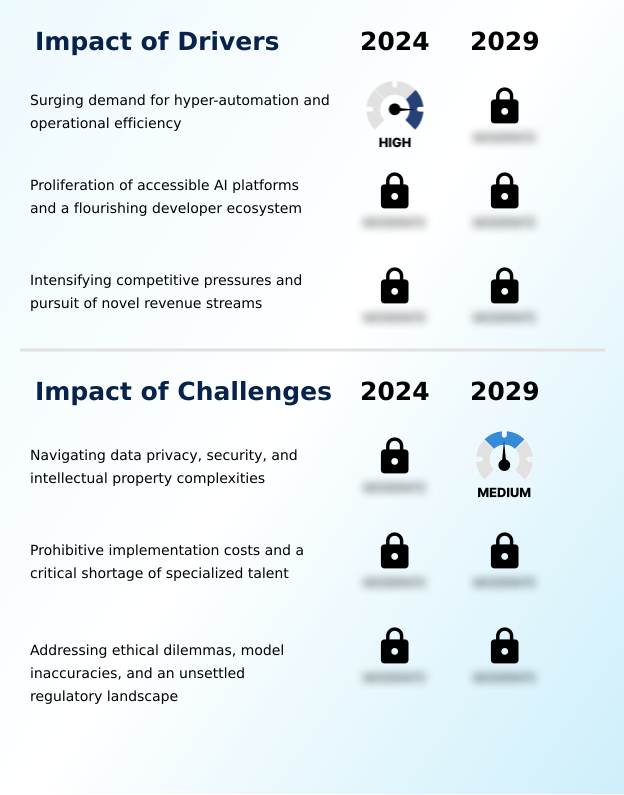
  • The market is primarily driven by a surging enterprise demand for hyper-automation and enhanced operational efficiency.

  • The primary market driver is the intense enterprise pursuit of hyper-automation and operational efficiency AI.
  • Businesses are deploying AI-powered chatbots and virtual assistants to handle customer interactions, with some platforms managing workloads equivalent to hundreds of full-time agents and achieving a 25% reduction in repeat inquiries.
  • This push extends to internal processes through AI-driven workflow automation and intelligent automation tools that accelerate the entire AI development lifecycle.
  • The accessibility of enterprise-grade AI solutions, offered as model-as-a-service (MaaS) with strong AI model performance benchmarks, is democratizing access to both proprietary AI models and open-source alternatives.
  • This is enabling widespread content creation automation and AI-driven personalization at scale, fundamentally altering how companies innovate and compete. This trend is unlocking unprecedented levels of productivity and creating new avenues for revenue generation across all sectors.

What are the market trends shaping the Enterprise Generative AI Industry?

  • The market is undergoing a significant shift toward specialization. This is characterized by the rising adoption of multimodal and domain-specific foundation models.

  • The market is pivoting from general-purpose tools to specialized systems, marked by a dual focus on multimodality and domain-specificity. Enterprises are increasingly demanding AI that performs multimodality reasoning, integrating text with image and audio analysis through technologies like diffusion models. This trend is unlocking advanced applications such as AI-driven generative design.
  • Simultaneously, the adoption of domain-specific models and domain-aware models, especially in high-stakes industries, is improving accuracy by over 15% compared to generalist counterparts. The strategic push towards vertical integration stacks and walled garden ecosystems is another defining trend, as corporations build full-stack AI solutions to control the entire AI value chain.
  • This allows for the creation of tightly integrated AI-native systems and specialized AI copilots. Techniques like retrieval-augmented generation (RAG) are becoming standard for enhancing the factual accuracy of these sophisticated systems.

What challenges does the Enterprise Generative AI Industry face during its growth?

  • Navigating the complexities of data privacy, security, and intellectual property rights presents a key challenge to industry growth.

  • Navigating significant implementation hurdles is a key challenge for enterprises. The high AI inference costs and the soaring expense of GPU acceleration create substantial financial barriers, with on-premise AI deployment requiring millions in upfront hardware investment. This is compounded by a severe AI talent gap, making it difficult to source experts for prompt engineering and responsible AI implementation.
  • Furthermore, ensuring data security within enterprise AI platforms is paramount, as firms strive to create secure AI environments and mitigate risks of data leakage, which have reportedly increased by 15% with the use of public tools. Addressing AI ethics and model bias mitigation through robust AI governance frameworks is now a critical compliance requirement.
  • Even with advanced foundation model development and custom AI silicon, achieving explainable AI (XAI) remains a complex technical challenge that hinders trust and full-scale adoption in regulated industries.

Exclusive Technavio Analysis on Customer Landscape

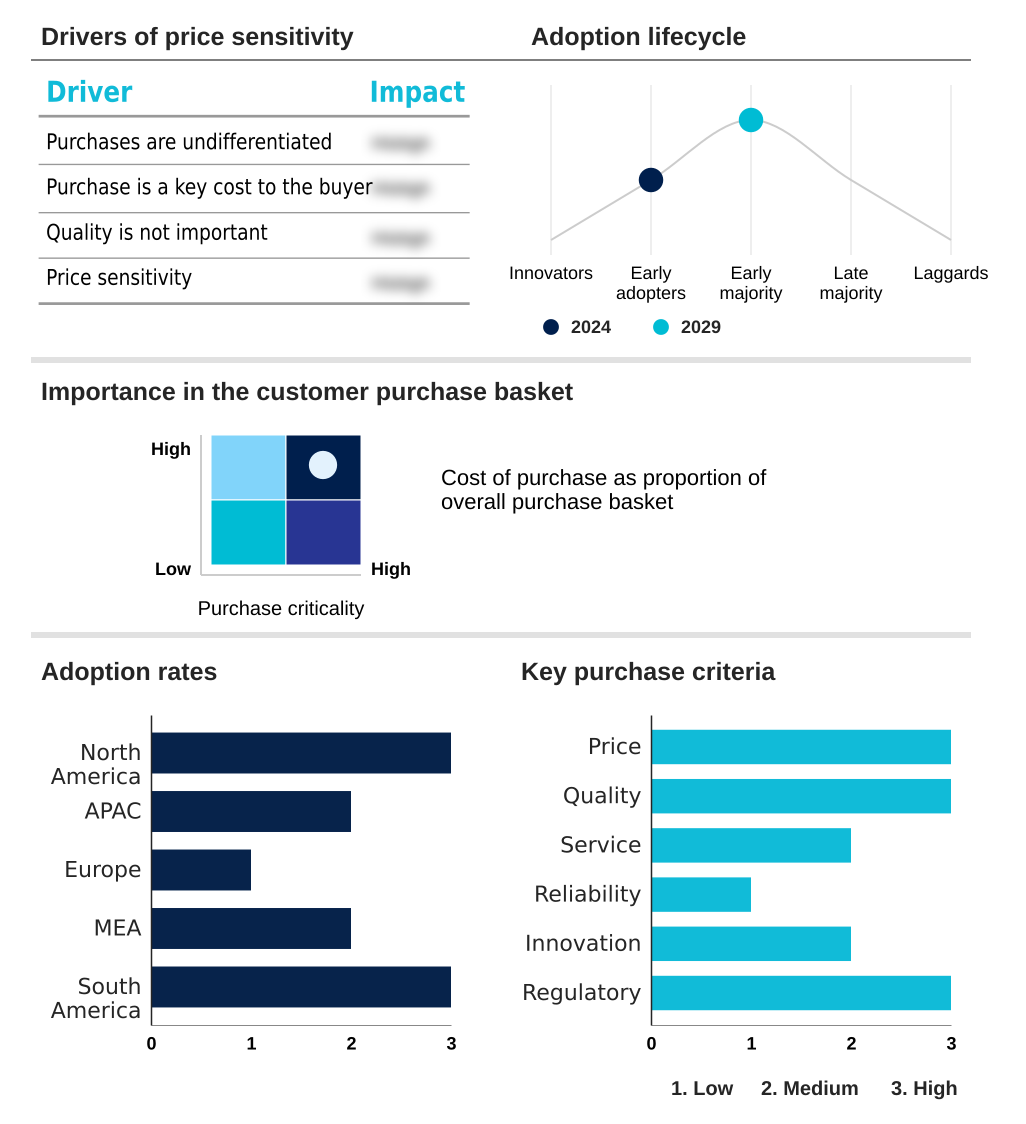
The enterprise generative ai market forecasting report includes the adoption lifecycle of the market, covering from the innovator’s stage to the laggard’s stage. It focuses on adoption rates in different regions based on penetration. Furthermore, the enterprise generative ai market report also includes key purchase criteria and drivers of price sensitivity to help companies evaluate and develop their market growth analysis strategies.

Customer Landscape of Enterprise Generative AI Industry

Competitive Landscape

Companies are implementing various strategies, such as strategic alliances, enterprise generative ai market forecast, partnerships, mergers and acquisitions, geographical expansion, and product/service launches, to enhance their presence in the industry.

Adobe Inc. - Delivers enterprise generative tools for scalable content creation, streamlining image, video, and copy production to boost creative workflow efficiency.

The industry research and growth report includes detailed analyses of the competitive landscape of the market and information about key companies, including:

  • Adobe Inc.
  • AI21 Labs
  • Amazon Web Services Inc.
  • Anthropic
  • Cohere
  • Databricks Inc.
  • Google Cloud
  • Hugging Face
  • IBM Corp.
  • Meta Platforms Inc.
  • Microsoft Corp.
  • Mistral AI
  • NVIDIA Corp.
  • OpenAI
  • Oracle Corp.
  • Salesforce Inc.
  • SAP SE
  • Scale
  • ServiceNow Inc.
  • Snowflake Inc.

Qualitative and quantitative analysis of companies has been conducted to help clients understand the wider business environment as well as the strengths and weaknesses of key industry players. Data is qualitatively analyzed to categorize companies as pure play, category-focused, industry-focused, and diversified; it is quantitatively analyzed to categorize companies as dominant, leading, strong, tentative, and weak.

Recent Development and News in Enterprise generative ai market

  • In September, 2024, Salesforce Inc. announced a strategic collaboration with a leading open-source AI firm to integrate advanced, multilingual code generation tools directly into its developer platform, aiming to accelerate custom application development for its global enterprise clients.
  • In November, 2024, IBM Corp. launched watsonx.gov, a new government-focused cloud platform offering a suite of generative AI models and governance tools designed to meet the stringent security and compliance requirements of public sector agencies.
  • In February, 2025, Databricks Inc. acquired a prominent AI observability startup for approximately USD 500 million, enhancing its Lakehouse AI platform with advanced model monitoring and performance management capabilities to ensure enterprise-grade reliability.
  • In April, 2025, Amazon Web Services Inc. announced a USD 2 billion investment to expand its sovereign cloud and AI infrastructure in Southeast Asia, launching new data center regions in Malaysia and Thailand to support growing enterprise demand for localized generative AI services.

Dive into Technavio’s robust research methodology, blending expert interviews, extensive data synthesis, and validated models for unparalleled Enterprise Generative AI Market insights. See full methodology.

Market Scope
Page number 290
Base year 2024
Forecast period 2025-2029
Growth momentum & CAGR Accelerate at a CAGR of 36.2%
Market growth 2025-2029 USD 9243.5 million
Market structure Fragmented
YoY growth 2024-2025(%) 30.7%
Key countries US, Canada, Mexico, China, Japan, India, South Korea, Australia, Indonesia, Germany, UK, France, The Netherlands, Spain, Italy, UAE, Saudi Arabia, Israel, South Africa, Turkey, Brazil, Argentina and Colombia
Competitive landscape Leading Companies, Market Positioning of Companies, Competitive Strategies, and Industry Risks

Request Free Sample

Research Analyst Overview

  • The Enterprise Generative AI market is defined by a strategic arms race toward vertical integration stacks, a trend compelling boardroom decisions on long-term capital allocation for custom AI silicon. This move is driven by the need for optimized neural network architecture and more efficient foundation model development.
  • The landscape is populated by a range of technologies, from proprietary AI models to open-source models, all accessible via cloud-based deployment or hybrid AI infrastructure. Key applications gaining traction include content creation automation, code generation tools, and advanced data augmentation techniques using synthetic data generation.
  • Organizations are deploying AI-powered chatbots and virtual assistants for operational efficiency AI, while leveraging AI copilots for complex cognitive process automation tasks such as generative design and research assistance tools. Successful deployment relies on robust AI governance frameworks to manage AI ethics and model bias mitigation.
  • Firms are utilizing prompt engineering and retrieval-augmented generation (RAG) to refine outputs, with some achieving a 30% reduction in data processing times. As adoption scales, managed AI services and API-based AI access become critical for on-premise AI deployment, sales enablement AI, and knowledge management AI.

What are the Key Data Covered in this Enterprise Generative AI Market Research and Growth Report?

  • What is the expected growth of the Enterprise Generative AI Market between 2025 and 2029?

    • USD 9.24 billion, at a CAGR of 36.2%

  • What segmentation does the market report cover?

    • The report is segmented by Technology (LLMs, Domain-specific, Multimodal models, Open-source), Application (Content creation, Code generation, Data augmentation, Others), Deployment (Cloud-based, Hybrid, On-premises) and Geography (North America, APAC, Europe, Middle East and Africa, South America)

  • Which regions are analyzed in the report?

    • North America, APAC, Europe, Middle East and Africa and South America

  • What are the key growth drivers and market challenges?

    • Surging demand for hyper-automation and operational efficiency, Navigating data privacy, security, and intellectual property complexities

  • Who are the major players in the Enterprise Generative AI Market?

    • Adobe Inc., AI21 Labs, Amazon Web Services Inc., Anthropic, Cohere, Databricks Inc., Google Cloud, Hugging Face, IBM Corp., Meta Platforms Inc., Microsoft Corp., Mistral AI, NVIDIA Corp., OpenAI, Oracle Corp., Salesforce Inc., SAP SE, Scale, ServiceNow Inc. and Snowflake Inc.

Market Research Insights

  • The market is defined by a push for intelligent automation and enterprise-grade AI solutions that deliver measurable outcomes. As businesses integrate AI-driven workflow automation, they report significant gains, with some achieving a 30% acceleration in their AI development lifecycle.
  • This drive for efficiency is fueling the adoption of model-as-a-service (MaaS) platforms, which improve AI model performance benchmarks and lower initial investment. The focus is on creating secure AI environments and enabling AI risk management, with private cloud AI deployments growing to address data sovereignty concerns.
  • This move toward production-grade AI is supported by a demand for full-stack AI solutions and enhanced enterprise search AI capabilities, which together are helping companies resolve the AI talent gap solutions by empowering existing teams. Firms leveraging these platforms see tangible results, including up to a 25% reduction in repeat customer inquiries.

We can help! Our analysts can customize this enterprise generative ai market research report to meet your requirements.

Get in touch

1. Executive Summary

1.1 Market overview

Executive Summary - Chart on Market Overview
Executive Summary - Data Table on Market Overview
Executive Summary - Chart on Global Market Characteristics
Executive Summary - Chart on Market by Geography
Executive Summary - Chart on Market Segmentation by Technology
Executive Summary - Chart on Market Segmentation by Application
Executive Summary - Chart on Market Segmentation by Deployment
Executive Summary - Chart on Incremental Growth
Executive Summary - Data Table on Incremental Growth
Executive Summary - Chart on Company Market Positioning

2. Technavio Analysis

2.1 Analysis of price sensitivity, lifecycle, customer purchase basket, adoption rates, and purchase criteria

2.2 Criticality of inputs and Factors of differentiation

Chart on Overview on criticality of inputs and factors of differentiation

2.3 Factors of disruption

Chart on Overview on factors of disruption

2.4 Impact of drivers and challenges

Chart on Impact of drivers and challenges in 2024 and 2029

3. Market Landscape

3.1 Market ecosystem

Chart on Parent Market
Data Table on - Parent Market

3.2 Market characteristics

Chart on Market characteristics analysis

3.3 Value chain analysis

Chart on Value chain analysis

4. Market Sizing

4.1 Market definition

Data Table on Offerings of companies included in the market definition

4.2 Market segment analysis

Market segments

4.3 Market size 2024

4.4 Market outlook: Forecast for 2024-2029

Chart on Global - Market size and forecast 2024-2029 ($ million)
Data Table on Global - Market size and forecast 2024-2029 ($ million)
Chart on Global Market: Year-over-year growth 2024-2029 (%)
Data Table on Global Market: Year-over-year growth 2024-2029 (%)

5. Five Forces Analysis

5.1 Five forces summary

Five forces analysis - Comparison between 2024 and 2029

5.2 Bargaining power of buyers

Bargaining power of buyers - Impact of key factors 2024 and 2029

5.3 Bargaining power of suppliers

Bargaining power of suppliers - Impact of key factors in 2024 and 2029

5.4 Threat of new entrants

Threat of new entrants - Impact of key factors in 2024 and 2029

5.5 Threat of substitutes

Threat of substitutes - Impact of key factors in 2024 and 2029

5.6 Threat of rivalry

Threat of rivalry - Impact of key factors in 2024 and 2029

5.7 Market condition

Chart on Market condition - Five forces 2024 and 2029

6. Market Segmentation by Technology

6.1 Market segments

Chart on Technology - Market share 2024-2029 (%)
Data Table on Technology - Market share 2024-2029 (%)

6.2 Comparison by Technology

Chart on Comparison by Technology
Data Table on Comparison by Technology

6.3 LLMs - Market size and forecast 2024-2029

Chart on LLMs - Market size and forecast 2024-2029 ($ million)
Data Table on LLMs - Market size and forecast 2024-2029 ($ million)
Chart on LLMs - Year-over-year growth 2024-2029 (%)
Data Table on LLMs - Year-over-year growth 2024-2029 (%)

6.4 Domain-specific - Market size and forecast 2024-2029

Chart on Domain-specific - Market size and forecast 2024-2029 ($ million)
Data Table on Domain-specific - Market size and forecast 2024-2029 ($ million)
Chart on Domain-specific - Year-over-year growth 2024-2029 (%)
Data Table on Domain-specific - Year-over-year growth 2024-2029 (%)

6.5 Multimodal models - Market size and forecast 2024-2029

Chart on Multimodal models - Market size and forecast 2024-2029 ($ million)
Data Table on Multimodal models - Market size and forecast 2024-2029 ($ million)
Chart on Multimodal models - Year-over-year growth 2024-2029 (%)
Data Table on Multimodal models - Year-over-year growth 2024-2029 (%)

6.6 Open-source - Market size and forecast 2024-2029

Chart on Open-source - Market size and forecast 2024-2029 ($ million)
Data Table on Open-source - Market size and forecast 2024-2029 ($ million)
Chart on Open-source - Year-over-year growth 2024-2029 (%)
Data Table on Open-source - Year-over-year growth 2024-2029 (%)

6.7 Market opportunity by Technology

Market opportunity by Technology ($ million)
Data Table on Market opportunity by Technology ($ million)

7. Market Segmentation by Application

7.1 Market segments

Chart on Application - Market share 2024-2029 (%)
Data Table on Application - Market share 2024-2029 (%)

7.2 Comparison by Application

Chart on Comparison by Application
Data Table on Comparison by Application

7.3 Content creation - Market size and forecast 2024-2029

Chart on Content creation - Market size and forecast 2024-2029 ($ million)
Data Table on Content creation - Market size and forecast 2024-2029 ($ million)
Chart on Content creation - Year-over-year growth 2024-2029 (%)
Data Table on Content creation - Year-over-year growth 2024-2029 (%)

7.4 Code generation - Market size and forecast 2024-2029

Chart on Code generation - Market size and forecast 2024-2029 ($ million)
Data Table on Code generation - Market size and forecast 2024-2029 ($ million)
Chart on Code generation - Year-over-year growth 2024-2029 (%)
Data Table on Code generation - Year-over-year growth 2024-2029 (%)

7.5 Data augmentation - Market size and forecast 2024-2029

Chart on Data augmentation - Market size and forecast 2024-2029 ($ million)
Data Table on Data augmentation - Market size and forecast 2024-2029 ($ million)
Chart on Data augmentation - Year-over-year growth 2024-2029 (%)
Data Table on Data augmentation - Year-over-year growth 2024-2029 (%)

7.6 Others - Market size and forecast 2024-2029

Chart on Others - Market size and forecast 2024-2029 ($ million)
Data Table on Others - Market size and forecast 2024-2029 ($ million)
Chart on Others - Year-over-year growth 2024-2029 (%)
Data Table on Others - Year-over-year growth 2024-2029 (%)

7.7 Market opportunity by Application

Market opportunity by Application ($ million)
Data Table on Market opportunity by Application ($ million)

8. Market Segmentation by Deployment

8.1 Market segments

Chart on Deployment - Market share 2024-2029 (%)
Data Table on Deployment - Market share 2024-2029 (%)

8.2 Comparison by Deployment

Chart on Comparison by Deployment
Data Table on Comparison by Deployment

8.3 Cloud-based - Market size and forecast 2024-2029

Chart on Cloud-based - Market size and forecast 2024-2029 ($ million)
Data Table on Cloud-based - Market size and forecast 2024-2029 ($ million)
Chart on Cloud-based - Year-over-year growth 2024-2029 (%)
Data Table on Cloud-based - Year-over-year growth 2024-2029 (%)

8.4 Hybrid - Market size and forecast 2024-2029

Chart on Hybrid - Market size and forecast 2024-2029 ($ million)
Data Table on Hybrid - Market size and forecast 2024-2029 ($ million)
Chart on Hybrid - Year-over-year growth 2024-2029 (%)
Data Table on Hybrid - Year-over-year growth 2024-2029 (%)

8.5 On-premises - Market size and forecast 2024-2029

Chart on On-premises - Market size and forecast 2024-2029 ($ million)
Data Table on On-premises - Market size and forecast 2024-2029 ($ million)
Chart on On-premises - Year-over-year growth 2024-2029 (%)
Data Table on On-premises - Year-over-year growth 2024-2029 (%)

8.6 Market opportunity by Deployment

Market opportunity by Deployment ($ million)
Data Table on Market opportunity by Deployment ($ million)

9. Customer Landscape

9.1 Customer landscape overview

Analysis of price sensitivity, lifecycle, customer purchase basket, adoption rates, and purchase criteria

10. Geographic Landscape

10.1 Geographic segmentation

Chart on Market share by geography 2024-2029 (%)
Data Table on Market share by geography 2024-2029 (%)

10.2 Geographic comparison

Chart on Geographic comparison
Data Table on Geographic comparison

10.3 North America - Market size and forecast 2024-2029

Chart on North America - Market size and forecast 2024-2029 ($ million)
Data Table on North America - Market size and forecast 2024-2029 ($ million)
Chart on North America - Year-over-year growth 2024-2029 (%)
Data Table on North America - Year-over-year growth 2024-2029 (%)
Chart on Regional Comparison - North America
Data Table on Regional Comparison - North America

10.3.1 US - Market size and forecast 2024-2029

Chart on US - Market size and forecast 2024-2029 ($ million)
Data Table on US - Market size and forecast 2024-2029 ($ million)
Chart on US - Year-over-year growth 2024-2029 (%)
Data Table on US - Year-over-year growth 2024-2029 (%)

10.3.2 Canada - Market size and forecast 2024-2029

Chart on Canada - Market size and forecast 2024-2029 ($ million)
Data Table on Canada - Market size and forecast 2024-2029 ($ million)
Chart on Canada - Year-over-year growth 2024-2029 (%)
Data Table on Canada - Year-over-year growth 2024-2029 (%)

10.3.3 Mexico - Market size and forecast 2024-2029

Chart on Mexico - Market size and forecast 2024-2029 ($ million)
Data Table on Mexico - Market size and forecast 2024-2029 ($ million)
Chart on Mexico - Year-over-year growth 2024-2029 (%)
Data Table on Mexico - Year-over-year growth 2024-2029 (%)

10.4 APAC - Market size and forecast 2024-2029

Chart on APAC - Market size and forecast 2024-2029 ($ million)
Data Table on APAC - Market size and forecast 2024-2029 ($ million)
Chart on APAC - Year-over-year growth 2024-2029 (%)
Data Table on APAC - Year-over-year growth 2024-2029 (%)
Chart on Regional Comparison - APAC
Data Table on Regional Comparison - APAC

10.4.1 China - Market size and forecast 2024-2029

Chart on China - Market size and forecast 2024-2029 ($ million)
Data Table on China - Market size and forecast 2024-2029 ($ million)
Chart on China - Year-over-year growth 2024-2029 (%)
Data Table on China - Year-over-year growth 2024-2029 (%)

10.4.2 Japan - Market size and forecast 2024-2029

Chart on Japan - Market size and forecast 2024-2029 ($ million)
Data Table on Japan - Market size and forecast 2024-2029 ($ million)
Chart on Japan - Year-over-year growth 2024-2029 (%)
Data Table on Japan - Year-over-year growth 2024-2029 (%)

10.4.3 India - Market size and forecast 2024-2029

Chart on India - Market size and forecast 2024-2029 ($ million)
Data Table on India - Market size and forecast 2024-2029 ($ million)
Chart on India - Year-over-year growth 2024-2029 (%)
Data Table on India - Year-over-year growth 2024-2029 (%)

10.4.4 South Korea - Market size and forecast 2024-2029

Chart on South Korea - Market size and forecast 2024-2029 ($ million)
Data Table on South Korea - Market size and forecast 2024-2029 ($ million)
Chart on South Korea - Year-over-year growth 2024-2029 (%)
Data Table on South Korea - Year-over-year growth 2024-2029 (%)

10.4.5 Australia - Market size and forecast 2024-2029

Chart on Australia - Market size and forecast 2024-2029 ($ million)
Data Table on Australia - Market size and forecast 2024-2029 ($ million)
Chart on Australia - Year-over-year growth 2024-2029 (%)
Data Table on Australia - Year-over-year growth 2024-2029 (%)

10.4.6 Indonesia - Market size and forecast 2024-2029

Chart on Indonesia - Market size and forecast 2024-2029 ($ million)
Data Table on Indonesia - Market size and forecast 2024-2029 ($ million)
Chart on Indonesia - Year-over-year growth 2024-2029 (%)
Data Table on Indonesia - Year-over-year growth 2024-2029 (%)

10.5 Europe - Market size and forecast 2024-2029

Chart on Europe - Market size and forecast 2024-2029 ($ million)
Data Table on Europe - Market size and forecast 2024-2029 ($ million)
Chart on Europe - Year-over-year growth 2024-2029 (%)
Data Table on Europe - Year-over-year growth 2024-2029 (%)
Chart on Regional Comparison - Europe
Data Table on Regional Comparison - Europe

10.5.1 Germany - Market size and forecast 2024-2029

Chart on Germany - Market size and forecast 2024-2029 ($ million)
Data Table on Germany - Market size and forecast 2024-2029 ($ million)
Chart on Germany - Year-over-year growth 2024-2029 (%)
Data Table on Germany - Year-over-year growth 2024-2029 (%)

10.5.2 UK - Market size and forecast 2024-2029

Chart on UK - Market size and forecast 2024-2029 ($ million)
Data Table on UK - Market size and forecast 2024-2029 ($ million)
Chart on UK - Year-over-year growth 2024-2029 (%)
Data Table on UK - Year-over-year growth 2024-2029 (%)

10.5.3 France - Market size and forecast 2024-2029

Chart on France - Market size and forecast 2024-2029 ($ million)
Data Table on France - Market size and forecast 2024-2029 ($ million)
Chart on France - Year-over-year growth 2024-2029 (%)
Data Table on France - Year-over-year growth 2024-2029 (%)

10.5.4 The Netherlands - Market size and forecast 2024-2029

Chart on The Netherlands - Market size and forecast 2024-2029 ($ million)
Data Table on The Netherlands - Market size and forecast 2024-2029 ($ million)
Chart on The Netherlands - Year-over-year growth 2024-2029 (%)
Data Table on The Netherlands - Year-over-year growth 2024-2029 (%)

10.5.5 Spain - Market size and forecast 2024-2029

Chart on Spain - Market size and forecast 2024-2029 ($ million)
Data Table on Spain - Market size and forecast 2024-2029 ($ million)
Chart on Spain - Year-over-year growth 2024-2029 (%)
Data Table on Spain - Year-over-year growth 2024-2029 (%)

10.5.6 Italy - Market size and forecast 2024-2029

Chart on Italy - Market size and forecast 2024-2029 ($ million)
Data Table on Italy - Market size and forecast 2024-2029 ($ million)
Chart on Italy - Year-over-year growth 2024-2029 (%)
Data Table on Italy - Year-over-year growth 2024-2029 (%)

10.6 Middle East and Africa - Market size and forecast 2024-2029

Chart on Middle East and Africa - Market size and forecast 2024-2029 ($ million)
Data Table on Middle East and Africa - Market size and forecast 2024-2029 ($ million)
Chart on Middle East and Africa - Year-over-year growth 2024-2029 (%)
Data Table on Middle East and Africa - Year-over-year growth 2024-2029 (%)
Chart on Regional Comparison - Middle East and Africa
Data Table on Regional Comparison - Middle East and Africa

10.6.1 UAE - Market size and forecast 2024-2029

Chart on UAE - Market size and forecast 2024-2029 ($ million)
Data Table on UAE - Market size and forecast 2024-2029 ($ million)
Chart on UAE - Year-over-year growth 2024-2029 (%)
Data Table on UAE - Year-over-year growth 2024-2029 (%)

10.6.2 Saudi Arabia - Market size and forecast 2024-2029

Chart on Saudi Arabia - Market size and forecast 2024-2029 ($ million)
Data Table on Saudi Arabia - Market size and forecast 2024-2029 ($ million)
Chart on Saudi Arabia - Year-over-year growth 2024-2029 (%)
Data Table on Saudi Arabia - Year-over-year growth 2024-2029 (%)

10.6.3 Israel - Market size and forecast 2024-2029

Chart on Israel - Market size and forecast 2024-2029 ($ million)
Data Table on Israel - Market size and forecast 2024-2029 ($ million)
Chart on Israel - Year-over-year growth 2024-2029 (%)
Data Table on Israel - Year-over-year growth 2024-2029 (%)

10.6.4 South Africa - Market size and forecast 2024-2029

Chart on South Africa - Market size and forecast 2024-2029 ($ million)
Data Table on South Africa - Market size and forecast 2024-2029 ($ million)
Chart on South Africa - Year-over-year growth 2024-2029 (%)
Data Table on South Africa - Year-over-year growth 2024-2029 (%)

10.6.5 Turkey - Market size and forecast 2024-2029

Chart on Turkey - Market size and forecast 2024-2029 ($ million)
Data Table on Turkey - Market size and forecast 2024-2029 ($ million)
Chart on Turkey - Year-over-year growth 2024-2029 (%)
Data Table on Turkey - Year-over-year growth 2024-2029 (%)

10.7 South America - Market size and forecast 2024-2029

Chart on South America - Market size and forecast 2024-2029 ($ million)
Data Table on South America - Market size and forecast 2024-2029 ($ million)
Chart on South America - Year-over-year growth 2024-2029 (%)
Data Table on South America - Year-over-year growth 2024-2029 (%)
Chart on Regional Comparison - South America
Data Table on Regional Comparison - South America

10.7.1 Brazil - Market size and forecast 2024-2029

Chart on Brazil - Market size and forecast 2024-2029 ($ million)
Data Table on Brazil - Market size and forecast 2024-2029 ($ million)
Chart on Brazil - Year-over-year growth 2024-2029 (%)
Data Table on Brazil - Year-over-year growth 2024-2029 (%)

10.7.2 Argentina - Market size and forecast 2024-2029

Chart on Argentina - Market size and forecast 2024-2029 ($ million)
Data Table on Argentina - Market size and forecast 2024-2029 ($ million)
Chart on Argentina - Year-over-year growth 2024-2029 (%)
Data Table on Argentina - Year-over-year growth 2024-2029 (%)

10.7.3 Colombia - Market size and forecast 2024-2029

Chart on Colombia - Market size and forecast 2024-2029 ($ million)
Data Table on Colombia - Market size and forecast 2024-2029 ($ million)
Chart on Colombia - Year-over-year growth 2024-2029 (%)
Data Table on Colombia - Year-over-year growth 2024-2029 (%)

10.8 Market opportunity by geography

Market opportunity by geography ($ million)
Data Tables on Market opportunity by geography ($ million)

11. Drivers, Challenges, and Opportunity

11.1 Market drivers

Surging demand for hyper-automation and operational efficiency
Proliferation of accessible AI platforms and a flourishing developer ecosystem
Intensifying competitive pressures and pursuit of novel revenue streams

11.2 Market challenges

Navigating data privacy, security, and intellectual property complexities
Prohibitive implementation costs and a critical shortage of specialized talent
Addressing ethical dilemmas, model inaccuracies, and an unsettled regulatory landscape

11.3 Impact of drivers and challenges

Impact of drivers and challenges in 2024 and 2029

11.4 Market opportunities

Shift towards multimodal and domain specific foundation models
Operationalization of generative AI through enterprise grade platforms and governance frameworks
Accelerating vertical integration and creation of walled ecosystems

12. Competitive Landscape

12.1 Overview

12.2

Overview on criticality of inputs and factors of differentiation

12.3 Landscape disruption

Overview on factors of disruption

12.4 Industry risks

Impact of key risks on business

13. Competitive Analysis

13.1 Companies profiled

Companies covered

13.2 Company ranking index

13.3 Market positioning of companies

Matrix on companies position and classification

13.4 Adobe Inc.

Adobe Inc. - Overview
Adobe Inc. - Business segments
Adobe Inc. - Key news
Adobe Inc. - Key offerings
Adobe Inc. - Segment focus
SWOT

13.5 Amazon Web Services Inc.

Amazon Web Services Inc. - Overview
Amazon Web Services Inc. - Product / Service
Amazon Web Services Inc. - Key news
Amazon Web Services Inc. - Key offerings
SWOT

13.6 Anthropic

Anthropic - Overview
Anthropic - Product / Service
Anthropic - Key offerings
SWOT

13.7 Cohere

Cohere - Overview
Cohere - Product / Service
Cohere - Key offerings
SWOT

13.8 Databricks Inc.

Databricks Inc. - Overview
Databricks Inc. - Product / Service
Databricks Inc. - Key offerings
SWOT

13.9 Google Cloud

Google Cloud - Overview
Google Cloud - Product / Service
Google Cloud - Key offerings
SWOT

13.10 Hugging Face

Hugging Face - Overview
Hugging Face - Product / Service
Hugging Face - Key offerings
SWOT

13.11 IBM Corp.

IBM Corp. - Overview
IBM Corp. - Business segments
IBM Corp. - Key news
IBM Corp. - Key offerings
IBM Corp. - Segment focus
SWOT

13.12 Microsoft Corp.

Microsoft Corp. - Overview
Microsoft Corp. - Business segments
Microsoft Corp. - Key news
Microsoft Corp. - Key offerings
Microsoft Corp. - Segment focus
SWOT

13.13 NVIDIA Corp.

NVIDIA Corp. - Overview
NVIDIA Corp. - Business segments
NVIDIA Corp. - Key news
NVIDIA Corp. - Key offerings
NVIDIA Corp. - Segment focus
SWOT

13.14 OpenAI

OpenAI - Overview
OpenAI - Product / Service
OpenAI - Key offerings
SWOT

13.15 Oracle Corp.

Oracle Corp. - Overview
Oracle Corp. - Business segments
Oracle Corp. - Key news
Oracle Corp. - Key offerings
Oracle Corp. - Segment focus
SWOT

13.16 Salesforce Inc.

Salesforce Inc. - Overview
Salesforce Inc. - Product / Service
Salesforce Inc. - Key news
Salesforce Inc. - Key offerings
SWOT

13.17 ServiceNow Inc.

ServiceNow Inc. - Overview
ServiceNow Inc. - Product / Service
ServiceNow Inc. - Key news
ServiceNow Inc. - Key offerings
SWOT

13.18 Snowflake Inc.

Snowflake Inc. - Overview
Snowflake Inc. - Product / Service
Snowflake Inc. - Key offerings
SWOT

14. Appendix

14.1 Scope of the report

Market definition
Objectives
Notes and caveats

14.2 Inclusions and exclusions checklist

Inclusions checklist
Exclusions checklist

14.3 Currency conversion rates for US$

14.4 Research methodology

14.5 Data procurement

Information sources

14.6 Data validation

14.7 Validation techniques employed for market sizing

14.8 Data synthesis

14.9 360 degree market analysis

14.10 List of abbreviations

Research Methodology

Technavio presents a detailed picture of the market by way of study, synthesis, and summation of data from multiple sources. The analysts have presented the various facets of the market with a particular focus on identifying the key industry influencers. The data thus presented is comprehensive, reliable, and the result of extensive research, both primary and secondary.

INFORMATION SOURCES

Primary sources

  • Manufacturers and suppliers
  • Channel partners
  • Industry experts
  • Strategic decision makers

Secondary sources

  • Industry journals and periodicals
  • Government data
  • Financial reports of key industry players
  • Historical data
  • Press releases

DATA ANALYSIS

Data Synthesis

  • Collation of data
  • Estimation of key figures
  • Analysis of derived insights

Data Validation

  • Triangulation with data models
  • Reference against proprietary databases
  • Corroboration with industry experts

REPORT WRITING

Qualitative

  • Market drivers
  • Market challenges
  • Market trends
  • Five forces analysis

Quantitative

  • Market size and forecast
  • Market segmentation
  • Geographical insights
  • Competitive landscape

Interested in this report?

Get your sample now to see our research methodology and insights!

Download Now

Frequently Asked Questions

Enterprise Generative AI market growth will increase by USD 9243.5 million during 2025-2029.

The Enterprise Generative AI market is expected to grow at a CAGR of 36.2% during 2025-2029.

Enterprise Generative AI market is segmented by Technology (LLMs, Domain-specific, Multimodal models, Open-source) Application (Content creation, Code generation, Data augmentation, Others) Deployment (Cloud-based, Hybrid, On-premises)

Adobe Inc., AI21 Labs, Amazon Web Services Inc., Anthropic, Cohere, Databricks Inc., Google Cloud, Hugging Face, IBM Corp., Meta Platforms Inc., Microsoft Corp., Mistral AI, NVIDIA Corp., OpenAI, Oracle Corp., Salesforce Inc., SAP SE, Scale, ServiceNow Inc., Snowflake Inc. are a few of the key vendors in the Enterprise Generative AI market.

North America will register the highest growth rate of 40.1% among the other regions. Therefore, the Enterprise Generative AI market in North America is expected to garner significant business opportunities for the vendors during the forecast period.

US, Canada, Mexico, China, Japan, India, South Korea, Australia, Indonesia, Germany, UK, France, The Netherlands, Spain, Italy, UAE, Saudi Arabia, Israel, South Africa, Turkey, Brazil, Argentina, Colombia

  • Surging demand for hyper-automation and operational efficiency is the driving factor this market.

The Enterprise Generative AI market vendors should focus on grabbing business opportunities from the Technology segment as it accounted for the largest market share in the base year.