Equestrian Equipment Market Size- North America, Europe, APAC, South America, Middle East and Africa - US, China, Canada, UK, Australia, Germany, Japan, France, Italy, India - Growth and Forecast Report 2024-2028

Equestrian Equipment Market Size- North America, Europe, APAC, South America, Middle East and Africa - US, China, Canada, UK, Australia, Germany, Japan, France, Italy, India - Growth and Forecast Report 2024-2028

Published: Oct 2024 201 Pages SKU: IRTNTR80214

Market Overview at a Glance

$3.13 B
Market Opportunity
4.8%
CAGR
3.5
YoY growth 2023-2024(%)

Equestrian Equipment Market Size 2024-2028 

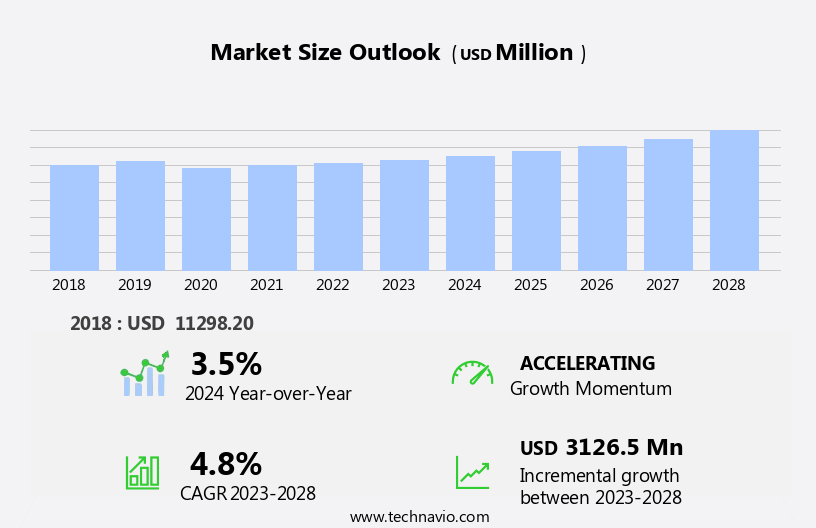
The equestrian equipment market size is forecast to increase by USD 3.13 billion at a CAGR of 4.8% between 2023 and 2028.

  • The market is experiencing significant growth due to several key factors. One of the primary drivers is the increasing participation in equestrian sports, fueled by the rising popularity of events such as the Olympics and the growth of recreational riding. Another trend is the focus of companies on new product launches, which include advanced technologies and innovative designs to cater to the evolving needs of riders. Additionally, the availability of pre-owned and rented equestrian equipment provides cost-effective solutions for those who may not be able to afford new gear. These factors are expected to continue driving market growth In the coming years. Overall, the market is poised for continued expansion, offering opportunities for companies and suppliers in this dynamic industry.

What will be the Size of the Equestrian Equipment Market During the Forecast Period?

Equestrian Equipment Market Size

 Request Free Sample

  • The market is experiencing strong growth, driven by the increasing popularity of horse riding as a recreational activity and participation in equestrian sports. Safety remains a top priority, with demand for certified helmets, protective vests, and airbag vests continuing to rise. Advanced materials, such as moisture-wicking fabrics, are being used to create tailored riding apparel that enhances both rider comfort and horse comfort. e-commerce platforms have made it easier for consumers to access specialized gear, including saddles, bridles, and accessories, from the convenience of their homes.
  • The equestrian community is diverse, encompassing various riding disciplines, from dressage and show jumping to recreational riding. With disposable incomes on the rise, consumers are investing in high-quality, specialized equipment to enhance their equestrian experiences. Communication and innovation are key trends, with new bridle designs and riding apparel offering improved functionality and performance.

How is this Equestrian Equipment Industry segmented and which is the largest segment?

The equestrian equipment industry research report provides comprehensive data (region-wise segment analysis), with forecasts and estimates in "USD billion" for the period 2024-2028, as well as historical data from 2018-2022 for the following segments.
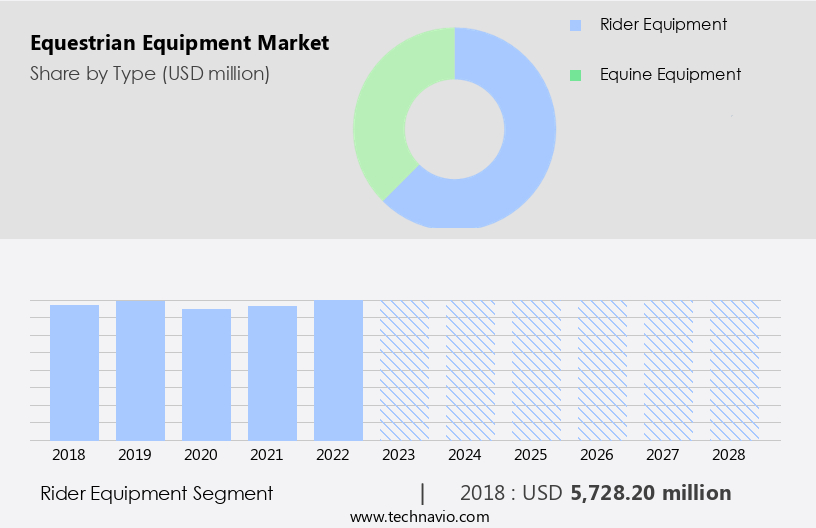
  • Type
    • Rider equipment
    • Equine equipment
  • Distribution Channel
    • Offline
    • Online
  • Geography
    • North America
      • Canada
      • US
    • Europe
      • Germany
      • UK
      • France
      • Italy
    • APAC
      • China
      • India
      • Japan
    • South America
    • Middle East and Africa

By Type Insights

  • The rider equipment segment is estimated to witness significant growth during the forecast period.

The market caters to the demand for gear and accessories essential for riders participating in various equestrian activities. This market segment includes helmets, riding apparel, body protectors, and gloves, designed to ensure rider safety, comfort, and optimal performance. Helmets, a crucial safety component, protect against head injuries. The Kylo riding helmet, launched by Charles Owen in 2023, is an innovative example. It offers an affordable option with features such as a wide peak, adjustable precision fit, and a flexible peak. Additionally, the market prioritizes ethical considerations, with offerings of cruelty-free products, recycled plastics, organic cotton, and vegan leather. Transparent supply chains ensure ethical sourcing and production practices.

Equestrian Equipment Market Size

Get a glance at the  Equestrian Equipment Industry report of share of various segments Request Free Sample

The rider equipment segment was valued at USD 5.73 billion in 2018 and showed a gradual increase during the forecast period.

Regional Analysis

  • APAC is estimated to contribute 35% to the growth of the global market during the forecast period.

Technavio's analysts have elaborately explained the regional trends and drivers that shape the market during the forecast period.

Equestrian Equipment Market Share by Geography

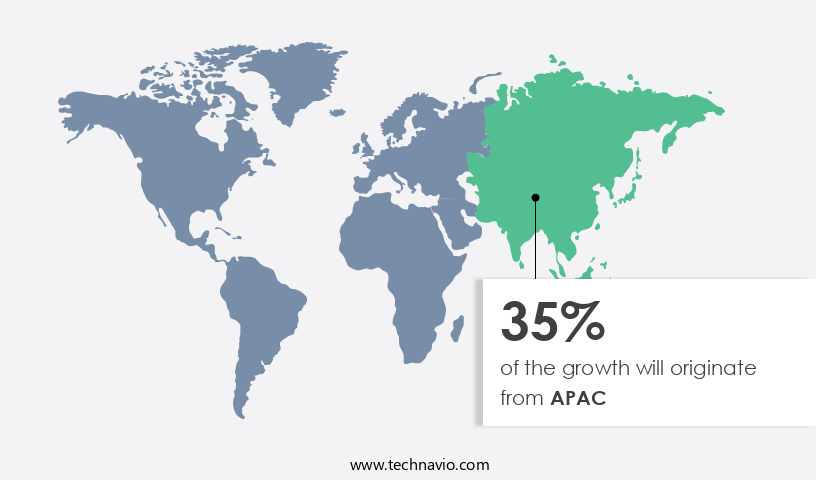
For more insights on the market share of various regions, Request Free Sample

The North American market is driven by the substantial equine population and the large number of horse enthusiasts In the United States. With approximately 6.65 million horses and 10 million horse owners, the demand for equestrian equipment is significant. Annual participation in horse-related activities reaches 25 million people, necessitating the use of high-quality equipment for safety and optimal performance in riding, training, and Olympic-level competitions. Equestrian equipment encompasses various categories, including equine wearables, smart sensors, monitoring devices, horse health products, rider equipment, and performance insights tools. These technologies enhance horse and rider well-being, improve training methods, and provide valuable data for better decision-making.

Market Dynamics

Our equestrian equipment market researchers analyzed the data with 2023 as the base year, along with the key drivers, trends, and challenges. A holistic analysis of drivers will help companies refine their marketing strategies to gain a competitive advantage.

What are the key market drivers leading to the rise In the adoption of the Equestrian Equipment Industry?

Increasing participation in equestrian sports is the key driver of the market.

  • The market is experiencing growth due to the rising popularity of equestrian sports and recreational riding. According to industry reports, over 480,000 Americans engage in horse riding activities, fueling the demand for a diverse range of equipment. From certified helmets and protective vests to specialized footwear and advanced materials, horse riding equipment is essential for both recreational and competitive riders. Safety gear, such as airbag vests and body protectors, are increasingly in demand as riders prioritize their safety. E-commerce platforms have made it easier for consumers to access specialized equipment from the comfort of their homes.
  • Fashion in equestrian is also a significant trend, with a focus on tailored equipment, lightweight fabrics, and cruelty-free products made from recycled plastics, organic cotton, and vegan leather. Equestrian events and tourism have become popular leisure activities, leading to increased sales of riding apparel, gloves, horse boots, blankets, and other accessories. Rider comfort and horse comfort are crucial considerations In the design of saddles and bridle designs. The market for equestrian equipment caters to both individuals and institutions, with offline channels and specialty stores complementing online sales. The equestrian community values safety regulations and transparency In the supply chain.

What are the market trends shaping the Equestrian Equipment Industry?

The increasing focus of companies on new product launches is the upcoming market trend.

  • The market is experiencing a notable shift towards advanced and specialized products, prioritizing both rider and horse comfort and safety. Innovative companies are introducing new items to cater to evolving consumer demands and maintain a competitive edge. For instance, WeatherBeeta's Spring 2024 collection, launched on March 7, 2024, showcases various products designed to enhance the equestrian experience. One such offering is the Green-Tec Airflow Mesh Fly Sheet from the WeatherBeeta Fly collection, which focuses on breathable materials and effective insect protection for horse comfort. This trend is driven by the growing popularity of equestrian sports, recreational riding, and equestrian tourism.
  • Consumers are increasingly seeking safety gear, such as certified helmets, protective vests, and airbag vests, made from advanced materials like lightweight fabrics and recycled plastics. E-commerce platforms and specialty stores are making these products more accessible, while ensuring transparent supply chains and offering cruelty-free, organic cotton, and vegan leather options. Safety regulations continue to play a significant role In the market, driving the demand for safety equipment. Riding apparel, such as moisture-wicking fabrics, body protectors, and gloves, are essential components of rider safety. Horses' comfort is also a priority, with horse boots, blankets, and saddles being designed to cater to various riding disciplines and bridle designs.

What challenges does the Equestrian Equipment Industry face during its growth?

The availability of pre-owned and rented equestrian equipment is a key challenge affecting the industry growth.

  • The market is undergoing a transformation due to shifting consumer preferences towards pre-owned and rented gear. This trend is driven by the increasing availability of platforms dedicated to buying and selling used equestrian equipment, such as Equestrian Closet, LLC and eBay Inc. These marketplaces offer affordable options for budget-conscious riders and those new to the sport, who may be hesitant to invest in expensive new equipment. The rise of pre-owned gear has significant implications for the equestrian industry. On the one hand, it presents opportunities for increased accessibility and affordability, particularly for recreational riders and those participating in leisure activities.
  • On the other hand, it poses challenges for manufacturers and retailers of new equipment, who must adapt to changing market dynamics and consumer behavior. Safety remains a top priority In the market, with a focus on certified helmets, protective vests, airbag vests, and other safety gear. Advanced materials, such as lightweight fabrics and recycled plastics, are increasingly being used to create high-performance, comfortable, and sustainable equipment. Specialty stores and e-commerce platforms offer a wide range of tailored equipment for various riding disciplines, including dressage, show jumping, and recreational riding. The equestrian community is also embracing cruelty-free products, with a growing demand for organic cotton, vegan leather, and transparent supply chains.
  • Smart sensors and monitoring devices are being integrated into equestrian wearables to provide performance insights and enhance horse health and rider safety. The market is diverse, catering to both individual and institutional buyers, as well as offline channels. Safety regulations continue to evolve, driving the development of innovative safety equipment, such as lightweight materials and smart sensors. The market is expected to grow as disposable incomes increase and equestrian sports continue to gain popularity as recreational and leisure activities.

Exclusive Customer Landscape

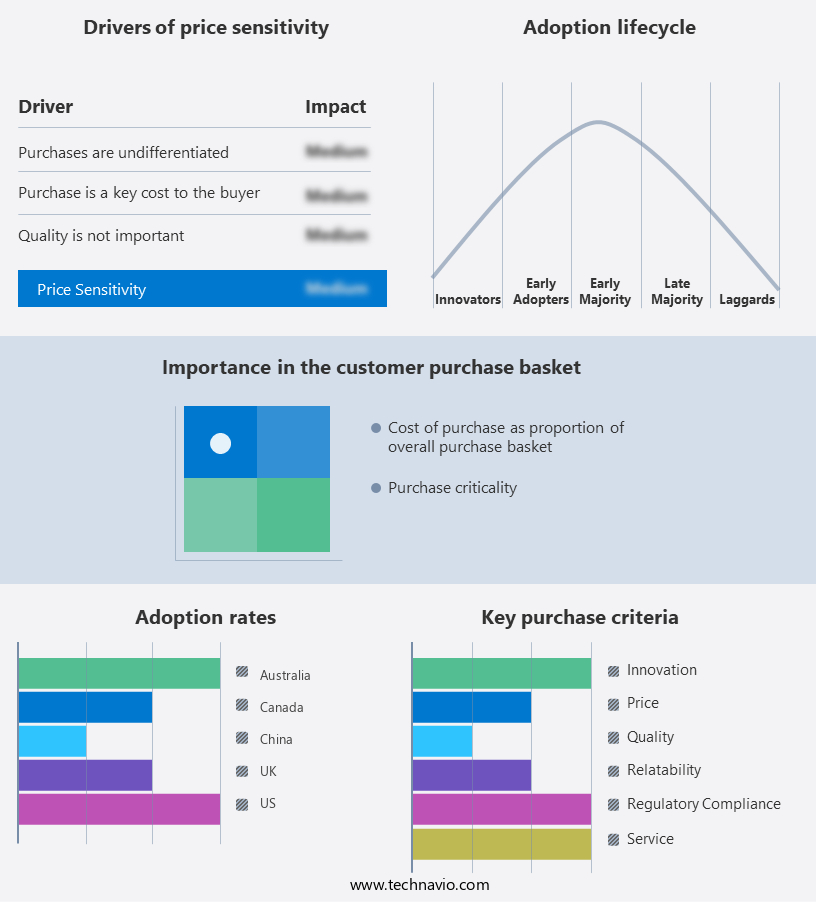
The equestrian equipment market forecasting report includes the adoption lifecycle of the market, covering from the innovator's stage to the laggard's stage. It focuses on adoption rates in different regions based on penetration. Furthermore, the equestrian equipment market report also includes key purchase criteria and drivers of price sensitivity to help companies evaluate and develop their market growth analysis strategies.

Equestrian Equipment Market Share by Geography

 Customer Landscape

Key Companies & Market Insights

Companies are implementing various strategies, such as strategic alliances, equestrian equipment market forecast, partnerships, mergers and acquisitions, geographical expansion, and product/service launches, to enhance their presence In the industry.

The industry research and growth report includes detailed analyses of the competitive landscape of the market and information about key companies, including:

  • Alfa Jump
  • Ariat International Inc.
  • Bates Saddles
  • Beval saddlery
  • Cavallo GmbH and Co. KG
  • Charles Owen
  • Devoucoux
  • GEMS International
  • Hermes International SA
  • HKM Sports Equipment GmbH
  • Horseware Products Ltd.
  • LeMieux Ltd
  • Mariam International
  • Nunn Finer
  • SALEHA INTERNATIONAL
  • Sharie International
  • Weatherbeeta USA Inc.
  • Weaver Equine

Qualitative and quantitative analysis of companies has been conducted to help clients understand the wider business environment as well as the strengths and weaknesses of key industry players. Data is qualitatively analyzed to categorize companies as pure play, category-focused, industry-focused, and diversified; it is quantitatively analyzed to categorize companies as dominant, leading, strong, tentative, and weak.

Research Analyst Overview

The market encompasses a wide range of products designed to enhance the experience of both riders and horses in various equestrian activities. This market caters to the needs of equestrian sports, recreational riding, and equestrian tourism. Equestrian equipment includes certified helmets, protective vests, specialized footwear, saddles, bridles, riding apparel, and accessories. The demand for safety gear is a significant market driver, as rider and horse safety are paramount in equestrian activities. Advanced materials, such as lightweight fabrics and airbag vests, have revolutionized safety equipment, offering superior protection without compromising comfort. E-commerce platforms have made it easier for consumers to access these products, allowing for greater convenience and increased competition among retailers.

Further, rider comfort and horse comfort are essential considerations in equestrian equipment design. Tailored equipment, including body protectors and saddle pads, cater to individual rider and horse needs. Equestrian culture places a high value on safety, performance, and fashion, leading to the development of luxury products and the integration of smart sensors and monitoring devices into equine wearables. The market is influenced by various factors, including raw material prices, rider and horse preferences, and safety regulations. The use of cruelty-free products, recycled plastics, organic cotton, and vegan leather is becoming increasingly popular, reflecting consumers' growing concern for animal welfare and the environment.

Additionally, transparent supply chains are also gaining importance, as consumers demand greater accountability and ethical production practices. Specialty stores and sporting goods retailers cater to the diverse needs of the equestrian community. Riding disciplines, such as dressage, show jumping, and recreational riding, each have unique equipment requirements. Communication between riders, trainers, and equipment manufacturers is essential to ensure the development of specialized gear that meets the demands of each discipline. Equestrian equipment is not only essential for competitive sports but also for leisure activities and outdoor pursuits. The equestrian tourism industry relies heavily on the availability of high-quality, reliable equipment to provide enjoyable experiences for riders and their horses.

Equestrian Equipment Market Scope

Report Coverage

Details

Page number

201

Base year

2023

Historic period

2018-2022

Forecast period

2024-2028

Growth momentum & CAGR

Accelerate at a CAGR of 4.8%

Market Growth 2024-2028

USD 3.13 billion

Market structure

Fragmented

YoY growth 2023-2024(%)

3.5

Key countries

US, China, Canada, UK, Australia, Germany, Japan, France, Italy, and India

Competitive landscape

Leading Companies, Market Positioning of Companies, Competitive Strategies, and Industry Risks

Request Free Sample

What are the Key Data Covered in this Equestrian Equipment Market Research and Growth Report?

  • CAGR of the Equestrian Equipment industry during the forecast period
  • Detailed information on factors that will drive the Equestrian Equipment Market growth and forecasting between 2024 and 2028
  • Precise estimation of the size of the market and its contribution of the industry in focus to the parent market
  • Accurate predictions about upcoming growth and trends and changes in consumer behaviour
  • Growth of the market across North America, Europe, APAC, South America, and Middle East and Africa
  • Thorough analysis of the market's competitive landscape and detailed information about companies
  • Comprehensive analysis of factors that will challenge the equestrian equipment market growth of industry companies

We can help! Our analysts can customize this equestrian equipment market research report to meet your requirements.

Get in touch

1 Executive Summary

  • 1.1 Market overview
    • Executive Summary - Chart on Market Overview
    • Executive Summary - Data Table on Market Overview
    • Executive Summary - Chart on Global Market Characteristics
    • Executive Summary - Chart on Market by Geography
    • Executive Summary - Chart on Market Segmentation by Type
    • Executive Summary - Chart on Market Segmentation by Distribution Channel
    • Executive Summary - Chart on Incremental Growth
    • Executive Summary - Data Table on Incremental Growth
    • Executive Summary - Chart on Company Market Positioning

2 Technavio Analysis

  • 2.1 Analysis of price sensitivity, lifecycle, customer purchase basket, adoption rates, and purchase criteria
    • Analysis of price sensitivity, lifecycle, customer purchase basket, adoption rates, and purchase criteria
  • 2.2 Criticality of inputs and Factors of differentiation
    • Overview on criticality of inputs and factors of differentiation
  • 2.3 Factors of disruption
    • Overview on factors of disruption
  • 2.4 Impact of drivers and challenges
    • Impact of drivers and challenges in 2023 and 2028

3 Market Landscape

  • 3.1 Market ecosystem
    • Parent Market
    • Data Table on - Parent Market
  • 3.2 Market characteristics
    • Market characteristics analysis
  • 3.3 Value chain analysis
    • Value Chain Analysis

4 Market Sizing

  • 4.1 Market definition
    • Offerings of companies included in the market definition
  • 4.2 Market segment analysis
    • Market segments
  • 4.3 Market size 2023
    • 4.4 Market outlook: Forecast for 2023-2028
      • Chart on Global - Market size and forecast 2023-2028 ($ million)
      • Data Table on Global - Market size and forecast 2023-2028 ($ million)
      • Chart on Global Market: Year-over-year growth 2023-2028 (%)
      • Data Table on Global Market: Year-over-year growth 2023-2028 (%)

    5 Historic Market Size

    • 5.1 Global Equestrian Equipment Market 2018 - 2022
      • Historic Market Size - Data Table on Global Equestrian Equipment Market 2018 - 2022 ($ million)
    • 5.2 Type segment analysis 2018 - 2022
      • Historic Market Size - Type Segment 2018 - 2022 ($ million)
    • 5.3 Distribution Channel segment analysis 2018 - 2022
      • Historic Market Size - Distribution Channel Segment 2018 - 2022 ($ million)
    • 5.4 Geography segment analysis 2018 - 2022
      • Historic Market Size - Geography Segment 2018 - 2022 ($ million)
    • 5.5 Country segment analysis 2018 - 2022
      • Historic Market Size - Country Segment 2018 - 2022 ($ million)

    6 Qualitative Analysis

    • 6.1 Impact of AI on the global equestrian equipment market

      7 Five Forces Analysis

      • 7.1 Five forces summary
        • Five forces analysis - Comparison between 2023 and 2028
      • 7.2 Bargaining power of buyers
        • Bargaining power of buyers - Impact of key factors 2023 and 2028
      • 7.3 Bargaining power of suppliers
        • Bargaining power of suppliers - Impact of key factors in 2023 and 2028
      • 7.4 Threat of new entrants
        • Threat of new entrants - Impact of key factors in 2023 and 2028
      • 7.5 Threat of substitutes
        • Threat of substitutes - Impact of key factors in 2023 and 2028
      • 7.6 Threat of rivalry
        • Threat of rivalry - Impact of key factors in 2023 and 2028
      • 7.7 Market condition
        • Chart on Market condition - Five forces 2023 and 2028

      8 Market Segmentation by Type

      • 8.1 Market segments
        • Chart on Type - Market share 2023-2028 (%)
        • Data Table on Type - Market share 2023-2028 (%)
      • 8.2 Comparison by Type
        • Chart on Comparison by Type
        • Data Table on Comparison by Type
      • 8.3 Rider equipment - Market size and forecast 2023-2028
        • Chart on Rider equipment - Market size and forecast 2023-2028 ($ million)
        • Data Table on Rider equipment - Market size and forecast 2023-2028 ($ million)
        • Chart on Rider equipment - Year-over-year growth 2023-2028 (%)
        • Data Table on Rider equipment - Year-over-year growth 2023-2028 (%)
      • 8.4 Equine equipment - Market size and forecast 2023-2028
        • Chart on Equine equipment - Market size and forecast 2023-2028 ($ million)
        • Data Table on Equine equipment - Market size and forecast 2023-2028 ($ million)
        • Chart on Equine equipment - Year-over-year growth 2023-2028 (%)
        • Data Table on Equine equipment - Year-over-year growth 2023-2028 (%)
      • 8.5 Market opportunity by Type
        • Market opportunity by Type ($ million)
        • Data Table on Market opportunity by Type ($ million)

      9 Market Segmentation by Distribution Channel

      • 9.1 Market segments
        • Chart on Distribution Channel - Market share 2023-2028 (%)
        • Data Table on Distribution Channel - Market share 2023-2028 (%)
      • 9.2 Comparison by Distribution Channel
        • Chart on Comparison by Distribution Channel
        • Data Table on Comparison by Distribution Channel
      • 9.3 Offline - Market size and forecast 2023-2028
        • Chart on Offline - Market size and forecast 2023-2028 ($ million)
        • Data Table on Offline - Market size and forecast 2023-2028 ($ million)
        • Chart on Offline - Year-over-year growth 2023-2028 (%)
        • Data Table on Offline - Year-over-year growth 2023-2028 (%)
      • 9.4 Online - Market size and forecast 2023-2028
        • Chart on Online - Market size and forecast 2023-2028 ($ million)
        • Data Table on Online - Market size and forecast 2023-2028 ($ million)
        • Chart on Online - Year-over-year growth 2023-2028 (%)
        • Data Table on Online - Year-over-year growth 2023-2028 (%)
      • 9.5 Market opportunity by Distribution Channel
        • Market opportunity by Distribution Channel ($ million)
        • Data Table on Market opportunity by Distribution Channel ($ million)

      10 Customer Landscape

      • 10.1 Customer landscape overview
        • Analysis of price sensitivity, lifecycle, customer purchase basket, adoption rates, and purchase criteria

      11 Geographic Landscape

      • 11.1 Geographic segmentation
        • Chart on Market share by geography 2023-2028 (%)
        • Data Table on Market share by geography 2023-2028 (%)
      • 11.2 Geographic comparison
        • Chart on Geographic comparison
        • Data Table on Geographic comparison
      • 11.3 North America - Market size and forecast 2023-2028
        • Chart on North America - Market size and forecast 2023-2028 ($ million)
        • Data Table on North America - Market size and forecast 2023-2028 ($ million)
        • Chart on North America - Year-over-year growth 2023-2028 (%)
        • Data Table on North America - Year-over-year growth 2023-2028 (%)
      • 11.4 Europe - Market size and forecast 2023-2028
        • Chart on Europe - Market size and forecast 2023-2028 ($ million)
        • Data Table on Europe - Market size and forecast 2023-2028 ($ million)
        • Chart on Europe - Year-over-year growth 2023-2028 (%)
        • Data Table on Europe - Year-over-year growth 2023-2028 (%)
      • 11.5 APAC - Market size and forecast 2023-2028
        • Chart on APAC - Market size and forecast 2023-2028 ($ million)
        • Data Table on APAC - Market size and forecast 2023-2028 ($ million)
        • Chart on APAC - Year-over-year growth 2023-2028 (%)
        • Data Table on APAC - Year-over-year growth 2023-2028 (%)
      • 11.6 South America - Market size and forecast 2023-2028
        • Chart on South America - Market size and forecast 2023-2028 ($ million)
        • Data Table on South America - Market size and forecast 2023-2028 ($ million)
        • Chart on South America - Year-over-year growth 2023-2028 (%)
        • Data Table on South America - Year-over-year growth 2023-2028 (%)
      • 11.7 Middle East and Africa - Market size and forecast 2023-2028
        • Chart on Middle East and Africa - Market size and forecast 2023-2028 ($ million)
        • Data Table on Middle East and Africa - Market size and forecast 2023-2028 ($ million)
        • Chart on Middle East and Africa - Year-over-year growth 2023-2028 (%)
        • Data Table on Middle East and Africa - Year-over-year growth 2023-2028 (%)
      • 11.8 US - Market size and forecast 2023-2028
        • Chart on US - Market size and forecast 2023-2028 ($ million)
        • Data Table on US - Market size and forecast 2023-2028 ($ million)
        • Chart on US - Year-over-year growth 2023-2028 (%)
        • Data Table on US - Year-over-year growth 2023-2028 (%)
      • 11.9 China - Market size and forecast 2023-2028
        • Chart on China - Market size and forecast 2023-2028 ($ million)
        • Data Table on China - Market size and forecast 2023-2028 ($ million)
        • Chart on China - Year-over-year growth 2023-2028 (%)
        • Data Table on China - Year-over-year growth 2023-2028 (%)
      • 11.10 Canada - Market size and forecast 2023-2028
        • Chart on Canada - Market size and forecast 2023-2028 ($ million)
        • Data Table on Canada - Market size and forecast 2023-2028 ($ million)
        • Chart on Canada - Year-over-year growth 2023-2028 (%)
        • Data Table on Canada - Year-over-year growth 2023-2028 (%)
      • 11.11 UK - Market size and forecast 2023-2028
        • Chart on UK - Market size and forecast 2023-2028 ($ million)
        • Data Table on UK - Market size and forecast 2023-2028 ($ million)
        • Chart on UK - Year-over-year growth 2023-2028 (%)
        • Data Table on UK - Year-over-year growth 2023-2028 (%)
      • 11.12 Australia - Market size and forecast 2023-2028
        • Chart on Australia - Market size and forecast 2023-2028 ($ million)
        • Data Table on Australia - Market size and forecast 2023-2028 ($ million)
        • Chart on Australia - Year-over-year growth 2023-2028 (%)
        • Data Table on Australia - Year-over-year growth 2023-2028 (%)
      • 11.13 Germany - Market size and forecast 2023-2028
        • Chart on Germany - Market size and forecast 2023-2028 ($ million)
        • Data Table on Germany - Market size and forecast 2023-2028 ($ million)
        • Chart on Germany - Year-over-year growth 2023-2028 (%)
        • Data Table on Germany - Year-over-year growth 2023-2028 (%)
      • 11.14 Japan - Market size and forecast 2023-2028
        • Chart on Japan - Market size and forecast 2023-2028 ($ million)
        • Data Table on Japan - Market size and forecast 2023-2028 ($ million)
        • Chart on Japan - Year-over-year growth 2023-2028 (%)
        • Data Table on Japan - Year-over-year growth 2023-2028 (%)
      • 11.15 France - Market size and forecast 2023-2028
        • Chart on France - Market size and forecast 2023-2028 ($ million)
        • Data Table on France - Market size and forecast 2023-2028 ($ million)
        • Chart on France - Year-over-year growth 2023-2028 (%)
        • Data Table on France - Year-over-year growth 2023-2028 (%)
      • 11.16 Italy - Market size and forecast 2023-2028
        • Chart on Italy - Market size and forecast 2023-2028 ($ million)
        • Data Table on Italy - Market size and forecast 2023-2028 ($ million)
        • Chart on Italy - Year-over-year growth 2023-2028 (%)
        • Data Table on Italy - Year-over-year growth 2023-2028 (%)
      • 11.17 India - Market size and forecast 2023-2028
        • Chart on India - Market size and forecast 2023-2028 ($ million)
        • Data Table on India - Market size and forecast 2023-2028 ($ million)
        • Chart on India - Year-over-year growth 2023-2028 (%)
        • Data Table on India - Year-over-year growth 2023-2028 (%)
      • 11.18 Market opportunity by geography
        • Market opportunity by geography ($ million)
        • Data Tables on Market opportunity by geography ($ million)

      12 Drivers, Challenges, and Opportunity/Restraints

      • 12.1 Market drivers
        • 12.2 Market challenges
          • 12.3 Impact of drivers and challenges
            • Impact of drivers and challenges in 2023 and 2028
          • 12.4 Market opportunities/restraints

            13 Competitive Landscape

            • 13.1 Overview
              • 13.2 Competitive Landscape
                • Overview on criticality of inputs and factors of differentiation
              • 13.3 Landscape disruption
                • Overview on factors of disruption
              • 13.4 Industry risks
                • Impact of key risks on business

              14 Competitive Analysis

              • 14.1 Companies profiled
                • Companies covered
              • 14.2 Company ranking index
                • Company ranking index
              • 14.3 Market positioning of companies
                • Matrix on companies position and classification
              • 14.4 Ariat International Inc.
                • Ariat International Inc. - Overview
                • Ariat International Inc. - Product / Service
                • Ariat International Inc. - Key offerings
                • SWOT
              • 14.5 Beval saddlery
                • Beval saddlery - Overview
                • Beval saddlery - Product / Service
                • Beval saddlery - Key offerings
                • SWOT
              • 14.6 Cavallo GmbH and Co. KG
                • Cavallo GmbH and Co. KG - Overview
                • Cavallo GmbH and Co. KG - Product / Service
                • Cavallo GmbH and Co. KG - Key offerings
                • SWOT
              • 14.7 Charles Owen
                • Charles Owen - Overview
                • Charles Owen - Product / Service
                • Charles Owen - Key offerings
                • SWOT
              • 14.8 Devoucoux
                • Devoucoux - Overview
                • Devoucoux - Product / Service
                • Devoucoux - Key offerings
                • SWOT
              • 14.9 GEMS International
                • GEMS International - Overview
                • GEMS International - Product / Service
                • GEMS International - Key offerings
                • SWOT
              • 14.10 Hermes International SA
                • Hermes International SA - Overview
                • Hermes International SA - Business segments
                • Hermes International SA - Key news
                • Hermes International SA - Key offerings
                • Hermes International SA - Segment focus
                • SWOT
              • 14.11 HKM Sports Equipment GmbH
                • HKM Sports Equipment GmbH - Overview
                • HKM Sports Equipment GmbH - Product / Service
                • HKM Sports Equipment GmbH - Key offerings
                • SWOT
              • 14.12 Horseware Products Ltd.
                • Horseware Products Ltd. - Overview
                • Horseware Products Ltd. - Product / Service
                • Horseware Products Ltd. - Key offerings
                • SWOT
              • 14.13 LeMieux Ltd
                • LeMieux Ltd - Overview
                • LeMieux Ltd - Product / Service
                • LeMieux Ltd - Key offerings
                • SWOT
              • 14.14 Mariam International
                • Mariam International - Overview
                • Mariam International - Product / Service
                • Mariam International - Key offerings
                • SWOT
              • 14.15 SALEHA INTERNATIONAL
                • SALEHA INTERNATIONAL - Overview
                • SALEHA INTERNATIONAL - Product / Service
                • SALEHA INTERNATIONAL - Key offerings
                • SWOT
              • 14.16 Sharie International
                • Sharie International - Overview
                • Sharie International - Product / Service
                • Sharie International - Key offerings
                • SWOT
              • 14.17 Weatherbeeta USA Inc.
                • Weatherbeeta USA Inc. - Overview
                • Weatherbeeta USA Inc. - Product / Service
                • Weatherbeeta USA Inc. - Key offerings
                • SWOT
              • 14.18 Weaver Equine
                • Weaver Equine - Overview
                • Weaver Equine - Product / Service
                • Weaver Equine - Key offerings
                • SWOT

              15 Appendix

              • 15.1 Scope of the report
                • 15.2 Inclusions and exclusions checklist
                  • Inclusions checklist
                  • Exclusions checklist
                • 15.3 Currency conversion rates for US$
                  • Currency conversion rates for US$
                • 15.4 Research methodology
                  • Research methodology
                • 15.5 Data procurement
                  • Information sources
                • 15.6 Data validation
                  • Data validation
                • 15.7 Validation techniques employed for market sizing
                  • Validation techniques employed for market sizing
                • 15.8 Data synthesis
                  • Data synthesis
                • 15.9 360 degree market analysis
                  • 360 degree market analysis
                • 15.10 List of abbreviations
                  • List of abbreviations

                Research Methodology

                Technavio presents a detailed picture of the market by way of study, synthesis, and summation of data from multiple sources. The analysts have presented the various facets of the market with a particular focus on identifying the key industry influencers. The data thus presented is comprehensive, reliable, and the result of extensive research, both primary and secondary.

                INFORMATION SOURCES

                Primary sources

                • Manufacturers and suppliers
                • Channel partners
                • Industry experts
                • Strategic decision makers

                Secondary sources

                • Industry journals and periodicals
                • Government data
                • Financial reports of key industry players
                • Historical data
                • Press releases

                DATA ANALYSIS

                Data Synthesis

                • Collation of data
                • Estimation of key figures
                • Analysis of derived insights

                Data Validation

                • Triangulation with data models
                • Reference against proprietary databases
                • Corroboration with industry experts

                REPORT WRITING

                Qualitative

                • Market drivers
                • Market challenges
                • Market trends
                • Five forces analysis

                Quantitative

                • Market size and forecast
                • Market segmentation
                • Geographical insights
                • Competitive landscape

                Interested in this report?

                Get your sample now to see our research methodology and insights!

                Download Now

                Frequently Asked Questions

                Equestrian Equipment market growth will increase by $ 3126.5 mn during 2024-2028.

                The Equestrian Equipment market is expected to grow at a CAGR of 4.8% during 2024-2028.

                Equestrian Equipment market is segmented by Type( Rider equipment, Equine equipment) Distribution Channel( Offline, Online)

                Alfa Jump, Ariat International Inc., Bates Saddles, Beval saddlery, Cavallo GmbH and Co. KG, Charles Owen, Devoucoux, GEMS International, Hermes International SA, HKM Sports Equipment GmbH, Horseware Products Ltd., LeMieux Ltd, Mariam International, Nunn Finer, SALEHA INTERNATIONAL, Sharie International, Weatherbeeta USA Inc., Weaver Equine are a few of the key vendors in the Equestrian Equipment market.

                APAC will register the highest growth rate of 35% among the other regions. Therefore, the Equestrian Equipment market in APAC is expected to garner significant business opportunities for the vendors during the forecast period.

                US, China, Canada, UK, Australia, Germany, Japan, France, Italy, India

                • Increasing participation in equestrian sportsThe global equestrian equipment market is significantly driven by the increasing participation in equestrian sports. According to data from the National Equestrian Survey by the British Equestrian Trade Association (BETA) is the driving factor this market.
                • approximately 1.82 million individuals in Great Britain engage in horse-riding regularly is the driving factor this market.
                • supported by a population of around 850 is the driving factor this market.
                • 000 horses. This substantial participation underscores the demand for a wide range of equestrian equipment is the driving factor this market.
                • from basic tack to specialized gear for both casual and competitive riders.In the United States is the driving factor this market.
                • the equestrian community has seen notable growth with a significant rise in both membership and fan engagement in 2023 is the driving factor this market.
                • with the total number of participants reaching 480 is the driving factor this market.
                • 000. This increase can be attributed to various initiatives aimed at promoting equestrian sports. Programs such as the Kids Club is the driving factor this market.
                • spring sweepstakes is the driving factor this market.
                • and strategic partnerships with institutions like the Kentucky Horse Park have played a crucial role in attracting new participants and retaining existing ones. These initiatives not only foster a love for equestrian activities among younger generations but also enhance the overall visibility and appeal of the sport.The surge in horse participation in competitions further highlights the growing interest in equestrian sports. In the United States is the driving factor this market.
                • the number of horses participating in competitions reached a new high is the driving factor this market.
                • with 83 is the driving factor this market.
                • 689 horses and 367 is the driving factor this market.
                • 000 competition entries recorded in 2023. This increase in competitive participation drives the demand for high-quality equestrian equipment is the driving factor this market.
                • as riders seek reliable and performance-enhancing gear to excel in their respective disciplines.Overall is the driving factor this market.
                • the rising participation in equestrian sports is a key driver for the global equestrian equipment market. The growing number of riders is the driving factor this market.
                • coupled with increased engagement in competitions and supportive initiatives is the driving factor this market.
                • fuels the demand for a diverse range of equestrian products. As more individuals take up horse-riding and participate in equestrian events is the driving factor this market.
                • the global equestrian equipment market is poised for sustained growth during the forecast period is the driving factor this market.
                • driven by the need for safety is the driving factor this market.
                • comfort is the driving factor this market.
                • and performance-enhancing gear. is the driving factor this market.

                The Equestrian Equipment market vendors should focus on grabbing business opportunities from the Rider equipment segment as it accounted for the largest market share in the base year.