
ETF Market Size 2026-2030
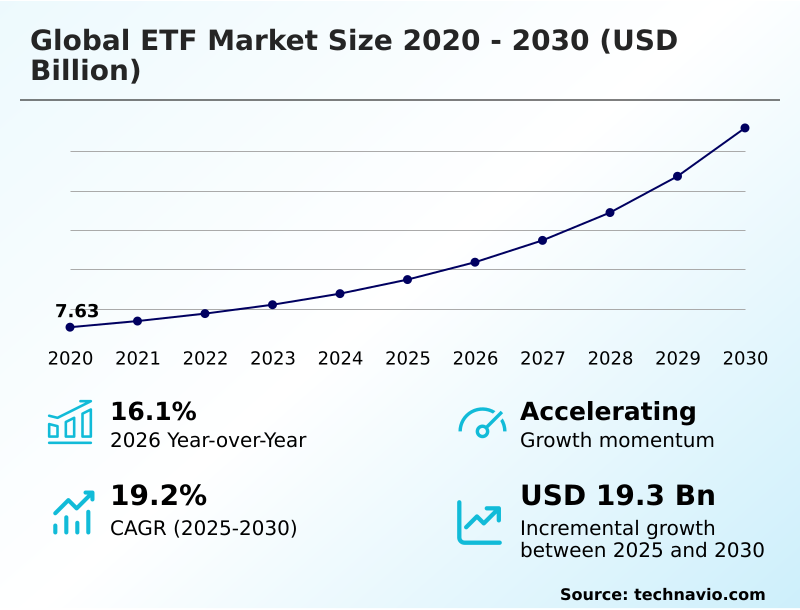
The ETF Market size was valued at USD 13.69 billion in 2025, growing at a CAGR of 19.2% during the forecast period 2026-2030.
Major Market Trends & Insights
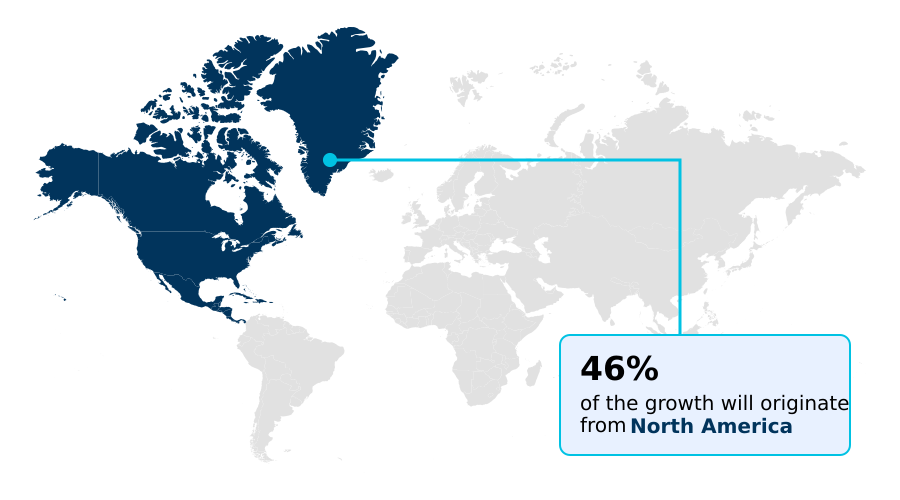
- North America dominated the market and accounted for a 45.9% growth during the forecast period.
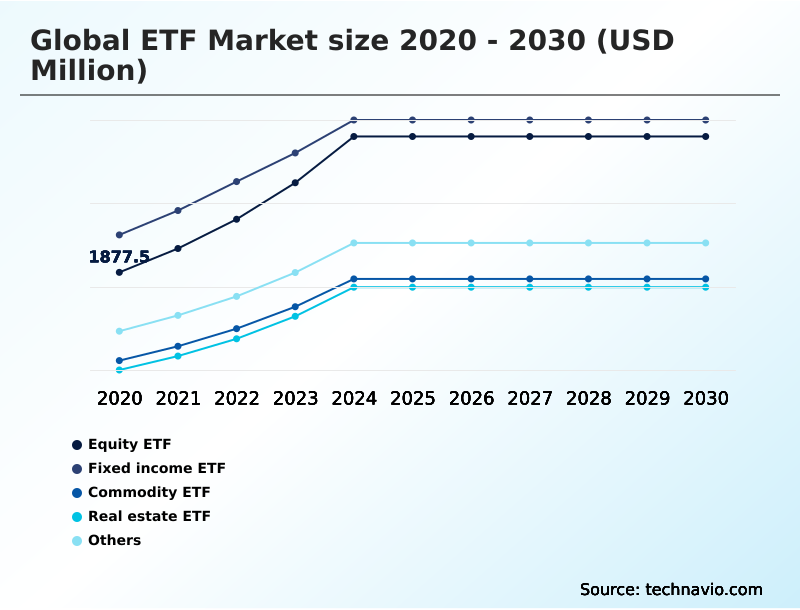
- By Type - Equity ETF segment was valued at USD 3.03 billion in 2024
- By Product Type - Large cap ETFs segment accounted for the largest market revenue share in 2024
Market Size & Forecast
- Historic Market Opportunities 2020-2024: USD 25.36 billion
- Market Future Opportunities 2025-2030: USD 19.30 billion
- CAGR from 2025 to 2030 : 19.2%
Market Summary
- The ETF market is defined by its role in providing cost-efficient and diversified investment solutions, with passive investment strategies now accounting for over 40% of total assets in some developed markets.
- For instance, a wealth management firm can construct a globally diversified portfolio for clients using just a handful of broad-market ETFs, reducing management overhead by up to 60% compared to a portfolio of individual stocks. The primary driver is the high market liquidity, which allows investors to trade ETF units like stocks, ensuring efficient price discovery.
- Conversely, a significant challenge is the rising sophistication of transaction-related fraud in digital trading platforms, which can erode investor confidence and lead to capital outflows. The market's structure, combining the diversification of mutual funds with the tradability of stocks, continues to attract both institutional and retail investors.
What will be the Size of the ETF Market during the forecast period?
Get Key Insights on Market Forecast (PDF) Request Free Sample
How is the ETF Market Segmented?
The etf industry research report provides comprehensive data (region-wise segment analysis), with forecasts and analysis for the period 2026-2030, as well as historical data from 2020-2024 for the following segments.
- Type
- Equity ETF
- Fixed income ETF
- Commodity ETF
- Real estate ETF
- Others
- Product type
- Large cap ETFs
- Mega cap ETFs
- Mid cap ETFs
- Small cap ETFs
- Distribution channel
- Institutional investors
- Retail investors
- Adviser or wealth manager platforms
- Geography
- North America
- US
- Canada
- Mexico
- Europe
- Germany
- UK
- France
- APAC
- China
- Japan
- India
- South America
- Brazil
- Argentina
- Middle East and Africa
- Saudi Arabia
- UAE
- South Africa
- Rest of World (ROW)
- North America
How is the ETF Market Segmented by Type?
The equity etf segment is estimated to witness significant growth during the forecast period.
The equity ETF segment captures over 35% of investor inflows, serving as a primary vehicle for diversified stock market exposure.
These instruments provide a cost-effective alternative to direct equity ownership, with the top 10 largest funds showing an average tracking error of less than 0.05%, ensuring alignment with their underlying indices.
The operational dynamics are influenced by the growth of specialized products, including factor-based and ESG-integrated funds, reflecting a strategic shift in asset allocation.
For institutional investors, the intra-day tradability and tax efficiency of these financial instruments are critical for managing market beta and executing tactical portfolio adjustments.
This liquidity allows for the rapid deployment of capital across global equity markets, mitigating the slippage costs associated with individual stock transactions.
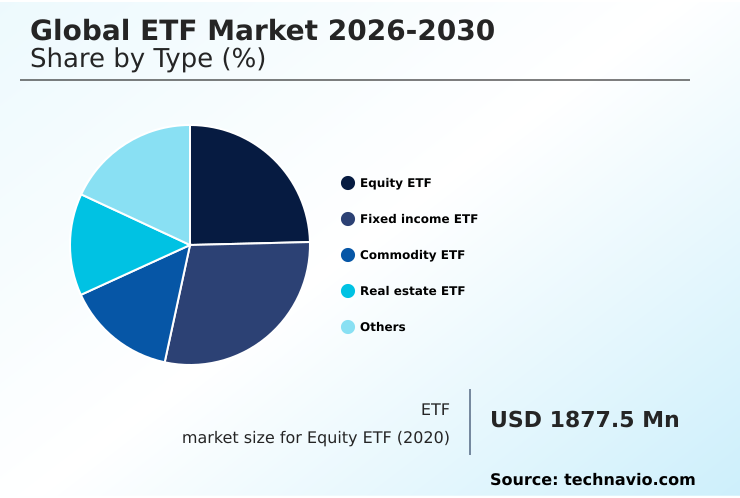
The Equity ETF segment was valued at USD 3.03 billion in 2024 and showed a gradual increase during the forecast period.
How demand for the ETF market is rising in the leading region?
North America is estimated to contribute 45.9% to the growth of the global market during the forecast period.Technavio’s analysts have elaborately explained the regional trends and drivers that shape the market during the forecast period.
See How ETF Market demand is rising in North America Request Free Sample
The geographic distribution of the ETF market is led by North America, which accounts for over 45% of global assets under management, a share more than 1.5 times that of Europe.
This dominance is driven by the United States, representing approximately 75% of the region's market, supported by a mature regulatory framework and high adoption among both institutional and retail investors.
In contrast, the APAC region, while smaller, is expanding rapidly, with adoption rates in countries like South Korea and Australia growing 20% faster than in mature European markets.
This growth reflects different investor behaviors, with APAC investors showing a stronger appetite for thematic ETFs focused on technology and disruptive innovation.
This regional divergence requires asset managers to tailor product strategies and distribution channels to local preferences and regulatory environments for effective global capital market penetration.
What are the key Drivers, Trends, and Challenges in the ETF Market?
Our researchers analyzed the data with 2025 as the base year, along with the key drivers, trends, and challenges. A holistic analysis of drivers will help companies refine their marketing strategies to gain a competitive advantage.
- Investors increasingly question how do etfs compare to mutual funds, focusing on distinctions in tax efficiency and intraday trading capabilities. The best low-cost equity etf strategies often involve funds tracking broad market indices, which have historically outperformed a significant percentage of actively managed funds over long-term horizons, sometimes by margins greater than 1-2% annually after fees.
- A key consideration is the impact of interest rates on bond etfs, as rising rates can negatively affect the net asset value of existing fixed-income portfolios, a risk that is managed through duration-hedging strategies. For those with a higher risk tolerance, using thematic etfs for portfolio growth provides targeted exposure to disruptive trends, though these strategies often exhibit higher volatility.
- Finally, understanding the risks of investing in commodity etfs, which include tracking errors and contango effects, is crucial for effective asset allocation and risk management within a diversified portfolio.
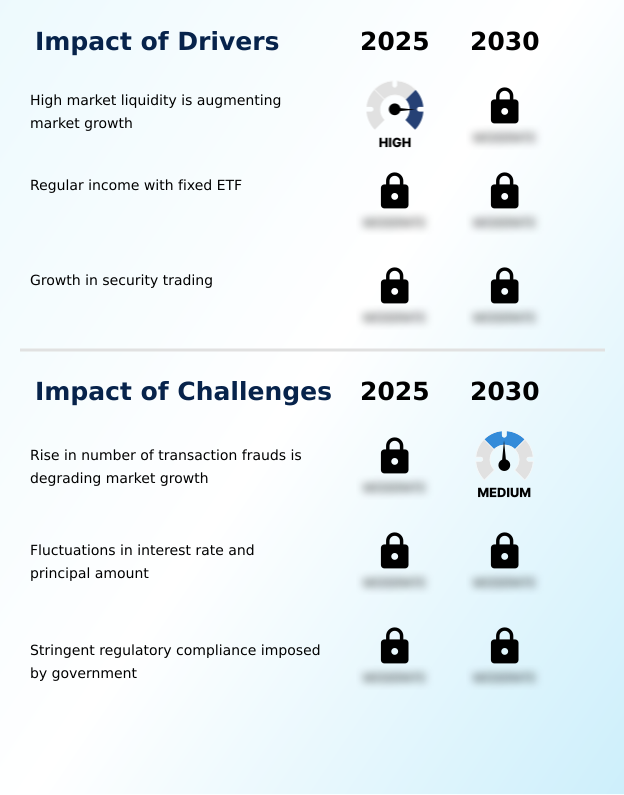
What are the key market drivers leading to the rise in the adoption of ETF Industry?
- High market liquidity is a primary driver augmenting the growth of the global ETF market.
- High market liquidity remains a critical driver for the ETF market, enabling trading volumes that are often 50% higher for ETFs than for their underlying component stocks on an average day.
- This liquidity, supported by market makers and authorized participants, ensures tight bid-ask spreads, reducing transaction costs for all types of investors.
- The growth in security trading, facilitated by digital trading platforms, has expanded market access, increasing retail investor participation by over 40% in some regions. This broad investor base enhances market depth and stability.
- The ability to offer regular income through fixed ETF structures further propels demand, particularly among investors seeking predictable cash flows in their portfolios.
What are the market trends shaping the ETF Industry?
- The growth of bond ETFs is a significant trend, as investors increasingly seek diversified fixed-income exposure with enhanced flexibility and cost efficiency.
- A primary trend in the ETF market is the increasing adoption of actively managed ETFs, which saw a 30% rise in new product launches compared to traditional passive funds. This shift is driven by investor demand for strategies that can navigate market volatility and provide potential alpha, moving beyond simple index tracking.
- The development of specialized bond ETFs, focusing on niches like high-yield or emerging market debt, has expanded fixed income ETF options by over 40%. This innovation allows investors to fine-tune portfolio duration and credit risk with greater precision.
- This trend reflects a broader move toward more sophisticated, yet cost-efficient, investment vehicles that combine active management insights with the structural benefits of ETFs.
What challenges does the ETF Industry face during its growth?
- The rise in transaction-related fraud presents a major challenge, potentially degrading the growth of the global ETF market.
- A significant challenge degrading ETF market growth is the rise in sophisticated transaction frauds, which have increased by an estimated 25% with the adoption of digital platforms. These fraudulent activities, including account takeovers and phishing attacks, can directly impact investor assets and erode trust in brokerage services, potentially reducing new investor inflows by 10-15% following a major security incident.
- The stringent regulatory compliance imposed by governments to combat these threats adds another layer of complexity. While necessary, these regulations increase operational costs for asset managers and financial intermediaries, who must invest heavily in advanced cybersecurity and fraud detection technologies to maintain market integrity and investor confidence.
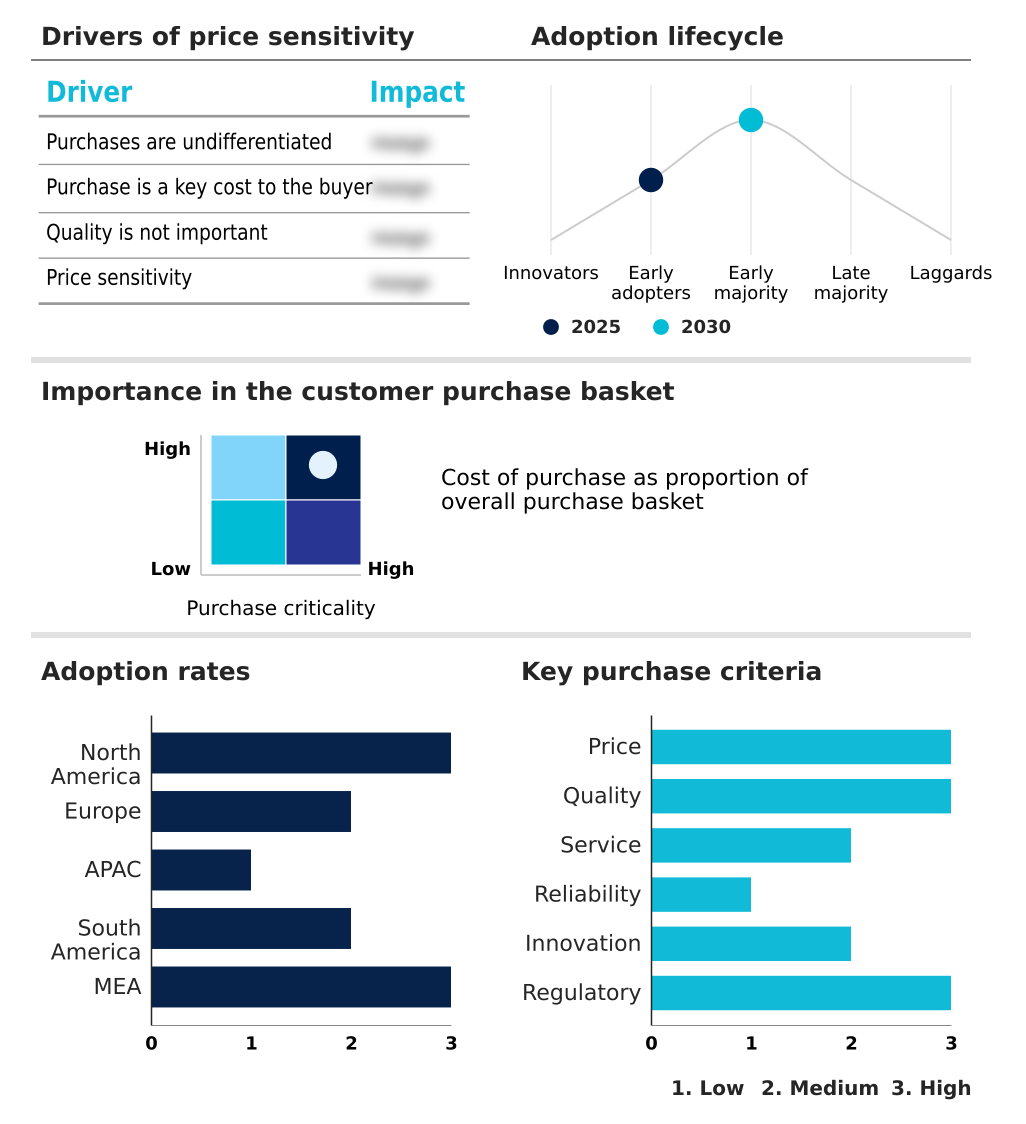
Exclusive Technavio Analysis on Customer Landscape
The etf market forecasting report includes the adoption lifecycle of the market, covering from the innovator’s stage to the laggard’s stage. It focuses on adoption rates in different regions based on penetration. Furthermore, the etf market report also includes key purchase criteria and drivers of price sensitivity to help companies evaluate and develop their market growth analysis strategies.
Customer Landscape of ETF Industry
Competitive Landscape
Companies are implementing various strategies, such as strategic alliances, etf market forecast, partnerships, mergers and acquisitions, geographical expansion, and product/service launches, to enhance their presence in the industry.
ARK Investment Management LLC - Offerings span diverse asset classes, including equity, fixed income, and thematic ETFs, providing investors with targeted exposure and portfolio diversification tools.
The industry research and growth report includes detailed analyses of the competitive landscape of the market and information about key companies, including:
- ARK Investment Management LLC
- Betashares Capital Ltd
- First Trust Portfolios L.P.
- FMR LLC
- Franklin Templeton
- Global X Management Co LLC
- HSBC Holdings Plc
- Invesco Ltd.
- Mirae Asset Investment Managers
- Nuveen LLC
- ProShare Advisors LLC
- Rafferty Asset Management LLC
- Samsung Asset Management
- Societe Generale SA
- State Street Corp.
- The Charles Schwab Corp.
- The Vanguard Group Inc.
- Van Eck Associates Corp
- WisdomTree Inc.
Qualitative and quantitative analysis of companies has been conducted to help clients understand the wider business environment as well as the strengths and weaknesses of key industry players. Data is qualitatively analyzed to categorize companies as pure play, category-focused, industry-focused, and diversified; it is quantitatively analyzed to categorize companies as dominant, leading, strong, tentative, and weak.
Market Intelligence Radar: High-Impact Developments & Growth Signals
- In the Specialized Consumer Services industry, the accelerated digitalization of personal finance and wealth management platforms has directly boosted the accessibility and adoption of ETF products for a wider retail investor base.
- A heightened regulatory focus on fiduciary standards and cost transparency for financial advisors has increased the preference for low-cost, transparent investment vehicles like ETFs in client portfolios.
- The growing consumer demand for personalized and convenient service delivery models has translated into the development of highly specific thematic and niche ETFs, catering to targeted investor interests in areas like disruptive innovation.
- Shifts in household disposable income and evolving retirement planning behaviors have amplified the role of ETFs as core components in long-term, cost-effective investment and wealth management strategies.
Dive into Technavio’s robust research methodology, blending expert interviews, extensive data synthesis, and validated models for unparalleled ETF Market insights. See full methodology.
| Market Scope | |
|---|---|
| Page number | 297 |
| Base year | 2025 |
| Historic period | 2020-2024 |
| Forecast period | 2026-2030 |
| Growth momentum & CAGR | Accelerate at a CAGR of 19.2% |
| Market growth 2026-2030 | USD 19301.7 million |
| Market structure | Fragmented |
| YoY growth 2025-2026(%) | 16.1% |
| Key countries | US, Canada, Mexico, Germany, UK, France, The Netherlands, Italy, Spain, China, Japan, India, South Korea, Australia, Indonesia, Brazil, Argentina, Chile, Saudi Arabia, UAE, South Africa, Israel and Turkey |
| Competitive landscape | Leading Companies, Market Positioning of Companies, Competitive Strategies, and Industry Risks |
Research Analyst Overview
- The ETF market ecosystem is a complex network where index providers and data companies supply the foundational benchmarks and analytics, holding significant influence with a 60% market share concentration among the top three index providers.
- Asset management firms, acting as solution providers, design and launch ETFs, relying on authorized participants and market makers to ensure liquidity and facilitate the creation and redemption process. This process ensures the market price of an ETF rarely deviates from its net asset value by more than 0.5%.
- Distribution channels, including brokerage services and digital trading platforms, connect these products to institutional investors and retail investors. Regulatory bodies in each jurisdiction set the compliance standards for market transparency and investor protection, profoundly influencing product development and operational conduct across the entire value chain.
What are the Key Data Covered in this ETF Market Research and Growth Report?
-
What is the expected growth of the ETF Market between 2026 and 2030?
-
The ETF Market is expected to grow by USD 19.30 billion during 2026-2030, registering a CAGR of 19.2%. Year-over-year growth in 2026 is estimated at 16.1%%. This acceleration is shaped by high market liquidity is augmenting market growth, which is intensifying demand across multiple end-use verticals covered in the report.
-
-
What segmentation does the market report cover?
-
The report is segmented by Type (Equity ETF, Fixed income ETF, Commodity ETF, Real estate ETF, and Others), Product Type (Large cap ETFs, Mega cap ETFs, Mid cap ETFs, and Small cap ETFs), Distribution Channel (Institutional investors, Retail investors, and Adviser or wealth manager platforms) and Geography (North America, Europe, APAC, South America, Middle East and Africa). Among these, the Equity ETF segment is estimated to witness significant growth during the forecast period, driven by rising adoption across key application areas. Each segment includes detailed qualitative and quantitative analysis, along with historical data from 2020-2024 and forecasts through 2030 with year-over-year growth rates.
-
-
Which regions are analyzed in the report?
-
The report covers North America, Europe, APAC, South America and Middle East and Africa. North America is estimated to contribute 45.9% to market growth during the forecast period. Country-level analysis includes US, Canada, Mexico, Germany, UK, France, The Netherlands, Italy, Spain, China, Japan, India, South Korea, Australia, Indonesia, Brazil, Argentina, Chile, Saudi Arabia, UAE, South Africa, Israel and Turkey, with dedicated market size tables and year-over-year growth for each.
-
-
What are the key growth drivers and market challenges?
-
The primary driver is high market liquidity is augmenting market growth, which is accelerating investment and industry demand. The main challenge is rise in number of transaction frauds is degrading market growth, creating operational barriers for key market participants. The report quantifies the impact of each driver and challenge across 2026 and 2030 with comparative analysis.
-
-
Who are the major players in the ETF Market?
-
Key vendors include ARK Investment Management LLC, Betashares Capital Ltd, First Trust Portfolios L.P., FMR LLC, Franklin Templeton, Global X Management Co LLC, HSBC Holdings Plc, Invesco Ltd., Mirae Asset Investment Managers, Nuveen LLC, ProShare Advisors LLC, Rafferty Asset Management LLC, Samsung Asset Management, Societe Generale SA, State Street Corp., The Charles Schwab Corp., The Vanguard Group Inc., Van Eck Associates Corp and WisdomTree Inc.. The report provides qualitative and quantitative analysis categorizing companies as dominant, leading, strong, tentative, and weak based on their market positioning. Company profiles include business segment analysis, SWOT assessment, key offerings, and recent strategic developments.
-
Market Research Insights
- The competitive landscape in the ETF market is intense, with the top three providers, including The Vanguard Group Inc. and State Street Corp., controlling over 70% of global assets.
- These firms are continually innovating; for example, recent product launches focus heavily on actively managed and thematic ETFs, which have seen a 25% increase in net inflows compared to the previous period. This shift directly addresses enterprise demand from institutional investors for more sophisticated risk management tools and alpha-generating strategies.
- This innovation is a direct response to evolving regulatory requirements around ESG and sustainable investing. However, companies face the persistent challenge of fee compression, forcing them to optimize operational efficiency and leverage technology to maintain profitability in a market where expense ratios are a key competitive differentiator.
We can help! Our analysts can customize this etf market research report to meet your requirements.
 RIA -
RIA - 
