Europe Cold Chain Market Size 2026-2030
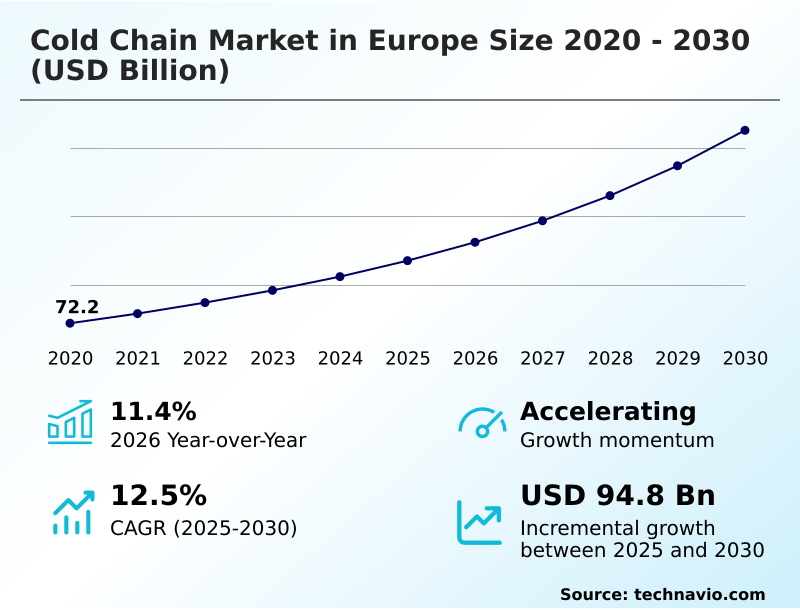
The europe cold chain market size is valued to increase by USD 94.8 billion, at a CAGR of 12.5% from 2025 to 2030. Proliferation of biopharmaceutical and healthcare sector will drive the europe cold chain market.
Major Market Trends & Insights
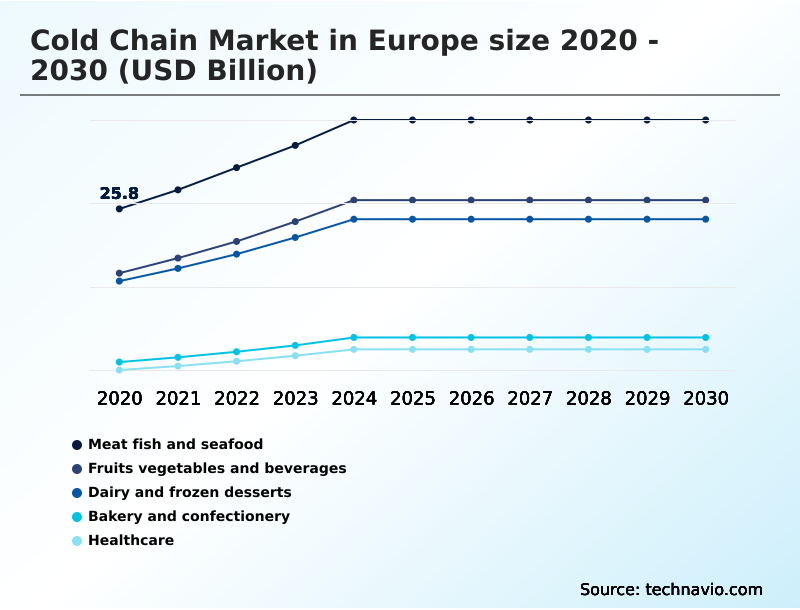
- By Application - Meat fish and seafood segment was valued at USD 37 billion in 2024
- By Type - Refrigerated warehouse segment accounted for the largest market revenue share in 2024
Market Size & Forecast
- Market Opportunities: USD 140.3 billion
- Market Future Opportunities: USD 94.8 billion
- CAGR from 2025 to 2030 : 12.5%
Market Summary
- The cold chain market in Europe is a critical infrastructure nexus, defined by its complex logistical frameworks designed to preserve temperature-sensitive commodities. This ecosystem operates through a sophisticated coordination of climate-controlled warehousing, specialized transport vehicles, and advanced thermal packaging solutions.
- Key market drivers include the expanding biopharmaceutical sector, where products like advanced therapy medicinal products and biologics demand ultra-low temperature storage and strict adherence to good distribution practice guidelines. Concurrently, evolving consumer expectations for fresh food quality and safety intensify the need for robust refrigerated transportation and end-to-end visibility.
- A central operational scenario involves a pharmaceutical distributor leveraging a warehouse management system integrated with real-time monitoring to track a shipment of vaccines across multiple countries, ensuring thermal integrity is maintained at every node of the supply chain to prevent spoilage and ensure patient safety.
- The industry is also navigating challenges from high energy costs and sustainability mandates, pushing operators toward investments in energy-efficient refrigeration and natural refrigerants to maintain competitiveness.
What will be the Size of the Europe Cold Chain Market during the forecast period?
Get Key Insights on Market Forecast (PDF) Get Free Sample
How is the Europe Cold Chain Market Segmented?
The europe cold chain industry research report provides comprehensive data (region-wise segment analysis), with forecasts and estimates in "USD billion" for the period 2026-2030, as well as historical data from 2020-2024 for the following segments.
- Application
- Meat fish and seafood
- Fruits vegetables and beverages
- Dairy and frozen desserts
- Bakery and confectionery
- Healthcare
- Type
- Refrigerated warehouse
- Refrigerated transportation
- Method
- Frozen
- Chilled
- Deep-frozen
- Geography
- Europe
- Germany
- France
- Italy
- Europe
By Application Insights
The meat fish and seafood segment is estimated to witness significant growth during the forecast period.
The meat, fish, and seafood segment is foundational to the european cold chain, demanding stringent protocols to ensure food supply chain integrity from processing to retail.
The sector relies on a combination of refrigerated transportation and advanced cold storage warehousing to maintain product quality. Adherence to Good Distribution Practice is non-negotiable for these highly perishable goods.
The integration of real-time monitoring within refrigerated container shipping allows for precise thermal deviation prevention, a critical factor for long-haul distribution. Innovations in automated picking systems have enhanced order accuracy by over 15%, reducing handling times in multi-temperature zones.
This focus on technology-driven end-to-end visibility ensures both safety and efficiency in perishable goods logistics.
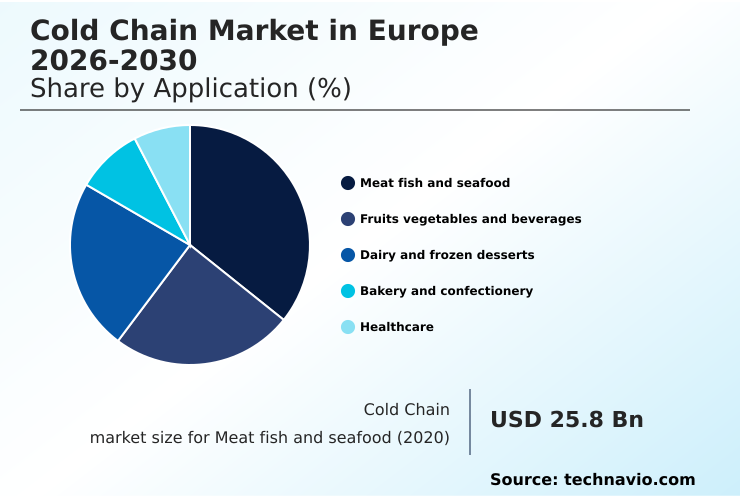
The Meat fish and seafood segment was valued at USD 37 billion in 2024 and showed a gradual increase during the forecast period.
Market Dynamics
Our researchers analyzed the data with 2025 as the base year, along with the key drivers, trends, and challenges. A holistic analysis of drivers will help companies refine their marketing strategies to gain a competitive advantage.
- Strategic planning in the modern cold chain requires a multifaceted approach to address complex operational demands. Ensuring cold chain compliance for biopharmaceuticals is a primary focus, necessitating robust infrastructure for advanced therapy logistics and strict temperature monitoring for perishable foods.
- A significant challenge is reducing energy costs in cold storage, which drives investment in sustainable refrigerants in commercial logistics and optimizing multi-temperature warehouse layouts. The energy consumption in refrigerated warehouses is being mitigated by predictive maintenance for refrigeration units. Firms that leverage data analytics for cold supply chains report spoilage rates less than half of those using outdated methods.
- The adoption of IoT integration in refrigerated transport, coupled with real-time tracking for pharmaceutical shipments, is critical for ensuring thermal integrity during transit. Improving last-mile cold chain efficiency is being addressed through automated systems for frozen food warehousing and advanced packaging for deep-frozen products.
- At the operational level, robotics in cold chain order fulfillment and AI-powered route optimization for reefers are becoming standard. However, the industry must also address the challenges in cross-border cold logistics, including regulatory compliance in food transportation and the growing threat of cybersecurity in smart cold chain networks.
- These elements together form the foundation of a resilient and efficient temperature-controlled supply chain.
What are the key market drivers leading to the rise in the adoption of Europe Cold Chain Industry?
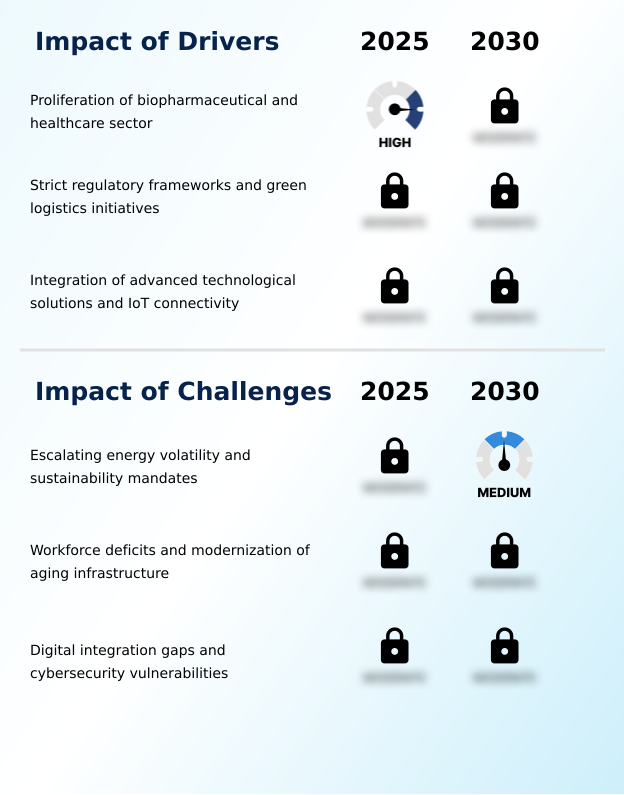
- The proliferation of the biopharmaceutical and healthcare sector, with its increasing demand for temperature-sensitive products, serves as a key driver for market expansion.
- The growth of the biopharmaceutical distribution network is a primary market driver, necessitating sophisticated pharmaceutical cold chain infrastructure.
- The requirement for good manufacturing practice and good distribution practice for advanced therapy medicinal products, many of which need ultra-low temperature storage, propels investment in specialized transport vehicles and cryogenic logistics solutions.
- Firms are implementing advanced monitoring systems, achieving over 99.8% compliance with temperature requirements during transit. This focus on thermal integrity is crucial for preventing spoilage of high-value biologics.
- The use of phase change materials in thermal packaging solutions further ensures temperature stability for sensitive shipments. The demand for deep-frozen storage and remote temperature sensing technologies is expanding to support the complex needs of modern medicine.
What are the market trends shaping the Europe Cold Chain Industry?
- The strategic integration of automation and AI-driven analytics is emerging as a defining market trend. This shift is reshaping operational efficiency and precision across the cold chain ecosystem.
- The strategic shift toward sustainable cold chain solutions is accelerating, driven by green logistics initiatives. Operators are integrating autonomous mobile robots and automated storage and retrieval systems, which can reduce energy consumption in climate-controlled warehousing by up to 20%. The use of machine learning algorithms for predictive maintenance analytics enables a 15% reduction in equipment downtime.
- Furthermore, intelligent routing algorithms enhance the efficiency of temperature-controlled transport, optimizing fuel use. Innovations like advanced insulation materials and advanced reefer technology are becoming standard. This evolution is geared toward achieving zero-emission logistics, with companies utilizing digital twins to model and refine autonomous warehouse operations using predictive analytics for maximum efficiency.
What challenges does the Europe Cold Chain Industry face during its growth?
- Escalating energy price volatility, combined with stringent sustainability mandates, presents a significant challenge to the operational viability and growth of the industry.
- Navigating high operational costs remains a central challenge, with energy-efficient refrigeration becoming a competitive necessity. The mandate to phase out older refrigerants is pushing firms toward natural refrigerants and carbon dioxide refrigeration systems, requiring significant capital. Maintaining supply chain visibility across fragmented networks is a hurdle addressed with multi-modal transport services, although this complicates temperature control.
- Integrating robotics process automation with legacy warehouse management systems can hinder cross-border logistics efficiency. The high cost of energy-efficient compressors and the need for hydrogen-powered backup systems for zero-emission resilience add financial pressure. This affects investment in integrated logistics solutions and thermal deviation prevention, which is critical for compliance.
Exclusive Technavio Analysis on Customer Landscape
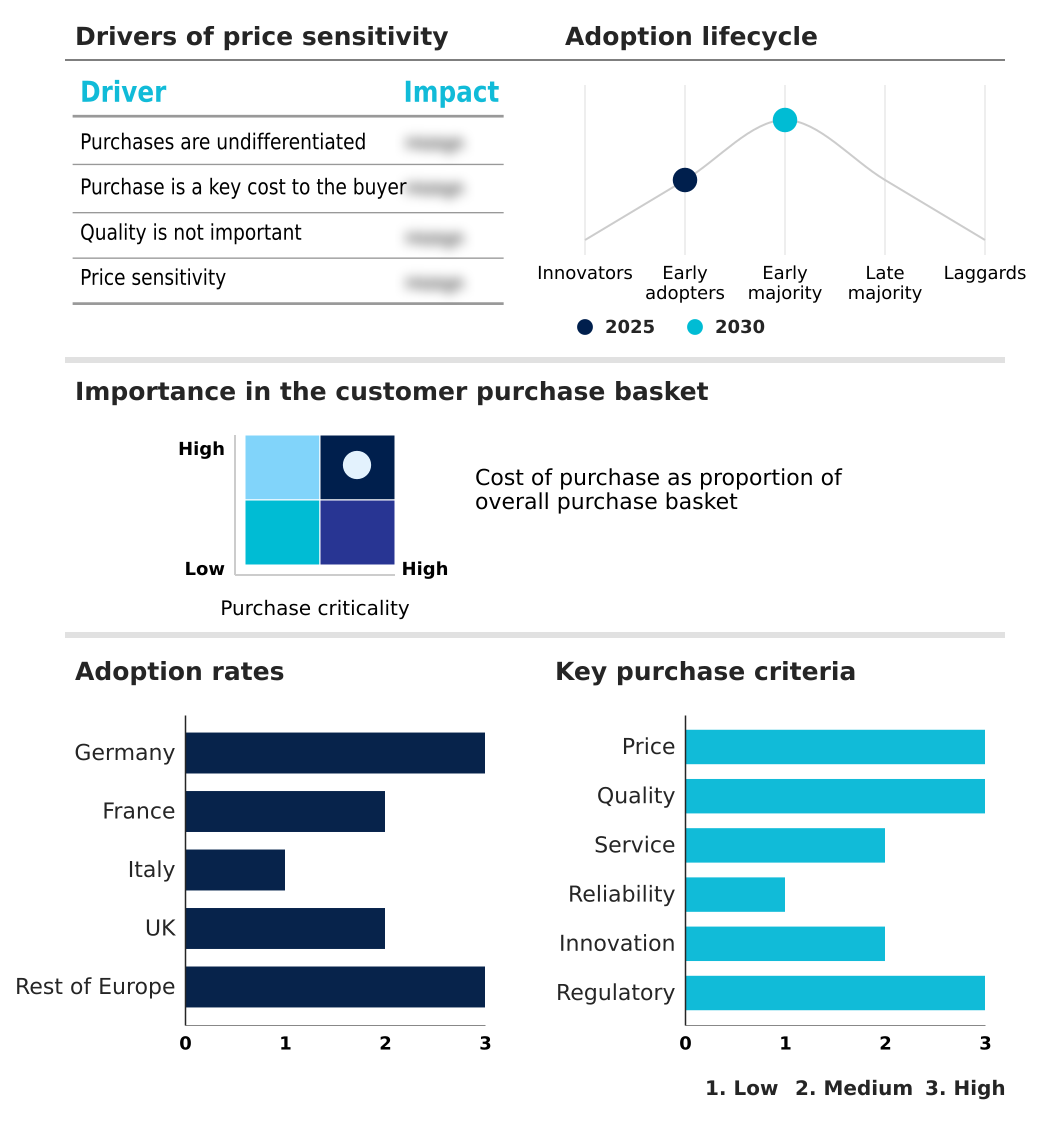
The europe cold chain market forecasting report includes the adoption lifecycle of the market, covering from the innovator’s stage to the laggard’s stage. It focuses on adoption rates in different regions based on penetration. Furthermore, the europe cold chain market report also includes key purchase criteria and drivers of price sensitivity to help companies evaluate and develop their market growth analysis strategies.
Customer Landscape of Europe Cold Chain Industry
Competitive Landscape
Companies are implementing various strategies, such as strategic alliances, europe cold chain market forecast, partnerships, mergers and acquisitions, geographical expansion, and product/service launches, to enhance their presence in the industry.
AP Moller Maersk AS - Analysis indicates a focus on integrated, end-to-end logistics, utilizing advanced reefer technology and refrigerated container shipping to ensure global reach and product integrity.
The industry research and growth report includes detailed analyses of the competitive landscape of the market and information about key companies, including:
- AP Moller Maersk AS
- Beno Trans GmbH
- Blue Water Shipping AS
- DHL International GmbH
- DSV AS
- FRIGO GmbH and Co. KG
- GEODIS
- Kraftverkehr SE and Co. KG
- Kuehne Nagel Management AG
- Lineage Inc.
- MSC Mediterranean Co. SA
- NewCold Cooperatief UA
- Noatum Holdings S.L.U.
- NORDFROST GmbH and Co. KG.
- Pacific Logistics Group.
- Pfenning Logistics
- WILMS Transport GmbH
Qualitative and quantitative analysis of companies has been conducted to help clients understand the wider business environment as well as the strengths and weaknesses of key industry players. Data is qualitatively analyzed to categorize companies as pure play, category-focused, industry-focused, and diversified; it is quantitatively analyzed to categorize companies as dominant, leading, strong, tentative, and weak.
Recent Development and News in Europe cold chain market
- In February 2025, Lineage Logistics completed the expansion of its automated facility in Aarhus, Denmark, to enhance the seafood export capabilities of the region.
- In March 2025, The European Commission introduced a revised framework accelerating the mandatory transition to natural refrigerants like ammonia and carbon dioxide for new industrial refrigeration installations.
- In April 2025, AP Moller Maersk AS inaugurated a state-of-the-art cold storage facility in the port of Rotterdam, which utilizes advanced carbon dioxide refrigeration systems to reduce environmental impact.
- In May 2025, Lineage completed construction of a next-generation automated cold storage hub in Northern Germany, featuring hydrogen-powered backup systems for zero-emission resilience.
Dive into Technavio’s robust research methodology, blending expert interviews, extensive data synthesis, and validated models for unparalleled Europe Cold Chain Market insights. See full methodology.
| Market Scope | |
|---|---|
| Page number | 196 |
| Base year | 2025 |
| Historic period | 2020-2024 |
| Forecast period | 2026-2030 |
| Growth momentum & CAGR | Accelerate at a CAGR of 12.5% |
| Market growth 2026-2030 | USD 94.8 billion |
| Market structure | Fragmented |
| YoY growth 2025-2026(%) | 11.4% |
| Key countries | Germany, France, Italy, UK and Rest of Europe |
| Competitive landscape | Leading Companies, Market Positioning of Companies, Competitive Strategies, and Industry Risks |
Research Analyst Overview
- The cold chain market is evolving into a sophisticated ecosystem where technology dictates competitive advantage. Boardroom decisions increasingly center on investments in carbon-neutral cold storage and hydrogen-powered backup systems to achieve zero-emission logistics, often leveraging thermal energy storage. This shift impacts all facets of temperature-controlled logistics.
- The integration of autonomous mobile robots and automated storage and retrieval systems within cold storage warehousing is critical for a 30% reduction in processing times. The entire network, from refrigerated transportation using advanced reefer technology in refrigerated container shipping to temperature-controlled warehousing with high-density storage, relies on data from warehouse management systems, real-time monitoring, and satellite-based tracking.
- Maintaining thermal integrity is paramount, supported by cryogenic cooling, phase change materials, and thermal packaging solutions. Adherence to good distribution practice for advanced therapy medicinal products necessitates ultra-low temperature storage and multi-temperature zones.
- Operators also deploy automated picking systems, energy-efficient compressors, natural refrigerants, and carbon dioxide refrigeration systems within multi-modal transport services to ensure end-to-end visibility from first mile to final last-mile delivery solutions. This process is optimized using digital twins, predictive analytics, and machine learning algorithms for temperature-controlled transport.
What are the Key Data Covered in this Europe Cold Chain Market Research and Growth Report?
-
What is the expected growth of the Europe Cold Chain Market between 2026 and 2030?
-
USD 94.8 billion, at a CAGR of 12.5%
-
-
What segmentation does the market report cover?
-
The report is segmented by Application (Meat fish and seafood, Fruits vegetables and beverages, Dairy and frozen desserts, Bakery and confectionery, and Healthcare), Type (Refrigerated warehouse, and Refrigerated transportation), Method (Frozen, Chilled, and Deep-frozen) and Geography (Europe)
-
-
Which regions are analyzed in the report?
-
Europe
-
-
What are the key growth drivers and market challenges?
-
Proliferation of biopharmaceutical and healthcare sector, Escalating energy volatility and sustainability mandates
-
-
Who are the major players in the Europe Cold Chain Market?
-
AP Moller Maersk AS, Beno Trans GmbH, Blue Water Shipping AS, DHL International GmbH, DSV AS, FRIGO GmbH and Co. KG, GEODIS, Kraftverkehr SE and Co. KG, Kuehne Nagel Management AG, Lineage Inc., MSC Mediterranean Co. SA, NewCold Cooperatief UA, Noatum Holdings S.L.U., NORDFROST GmbH and Co. KG., Pacific Logistics Group., Pfenning Logistics and WILMS Transport GmbH
-
Market Research Insights
- Market dynamics are shaped by technological innovation and regulatory pressures. The need for supply chain visibility drives adoption of advanced monitoring systems and IoT-enabled supply chains, improving compliance for temperature-sensitive shipments by 25%. Green logistics initiatives promote energy-efficient refrigeration and sustainable cold chain practices, with some operators cutting energy use by 15% via intelligent routing algorithms and dynamic route optimization.
- The pharmaceutical cold chain relies on cryogenic logistics solutions and specialized transport vehicles for biopharmaceutical distribution, ensuring cross-border logistics efficiency. Perishable goods logistics demands food supply chain integrity, using blockchain for traceability and remote temperature sensing. Integrated logistics solutions combine climate-controlled warehousing, urban micro-fulfillment, and advanced insulation materials.
- Firms explore robotics process automation and predictive maintenance analytics to enhance autonomous warehouse operations and ensure thermal deviation prevention, while biometric access control secures inventory. Good manufacturing practice, smart packaging solutions, and deep-frozen storage are becoming standard for all refrigerated logistics, with a focus on zero-emission resilience.
We can help! Our analysts can customize this europe cold chain market research report to meet your requirements.
 RIA -
RIA - 
