
Europe Facility Management Services Market Size 2025-2029
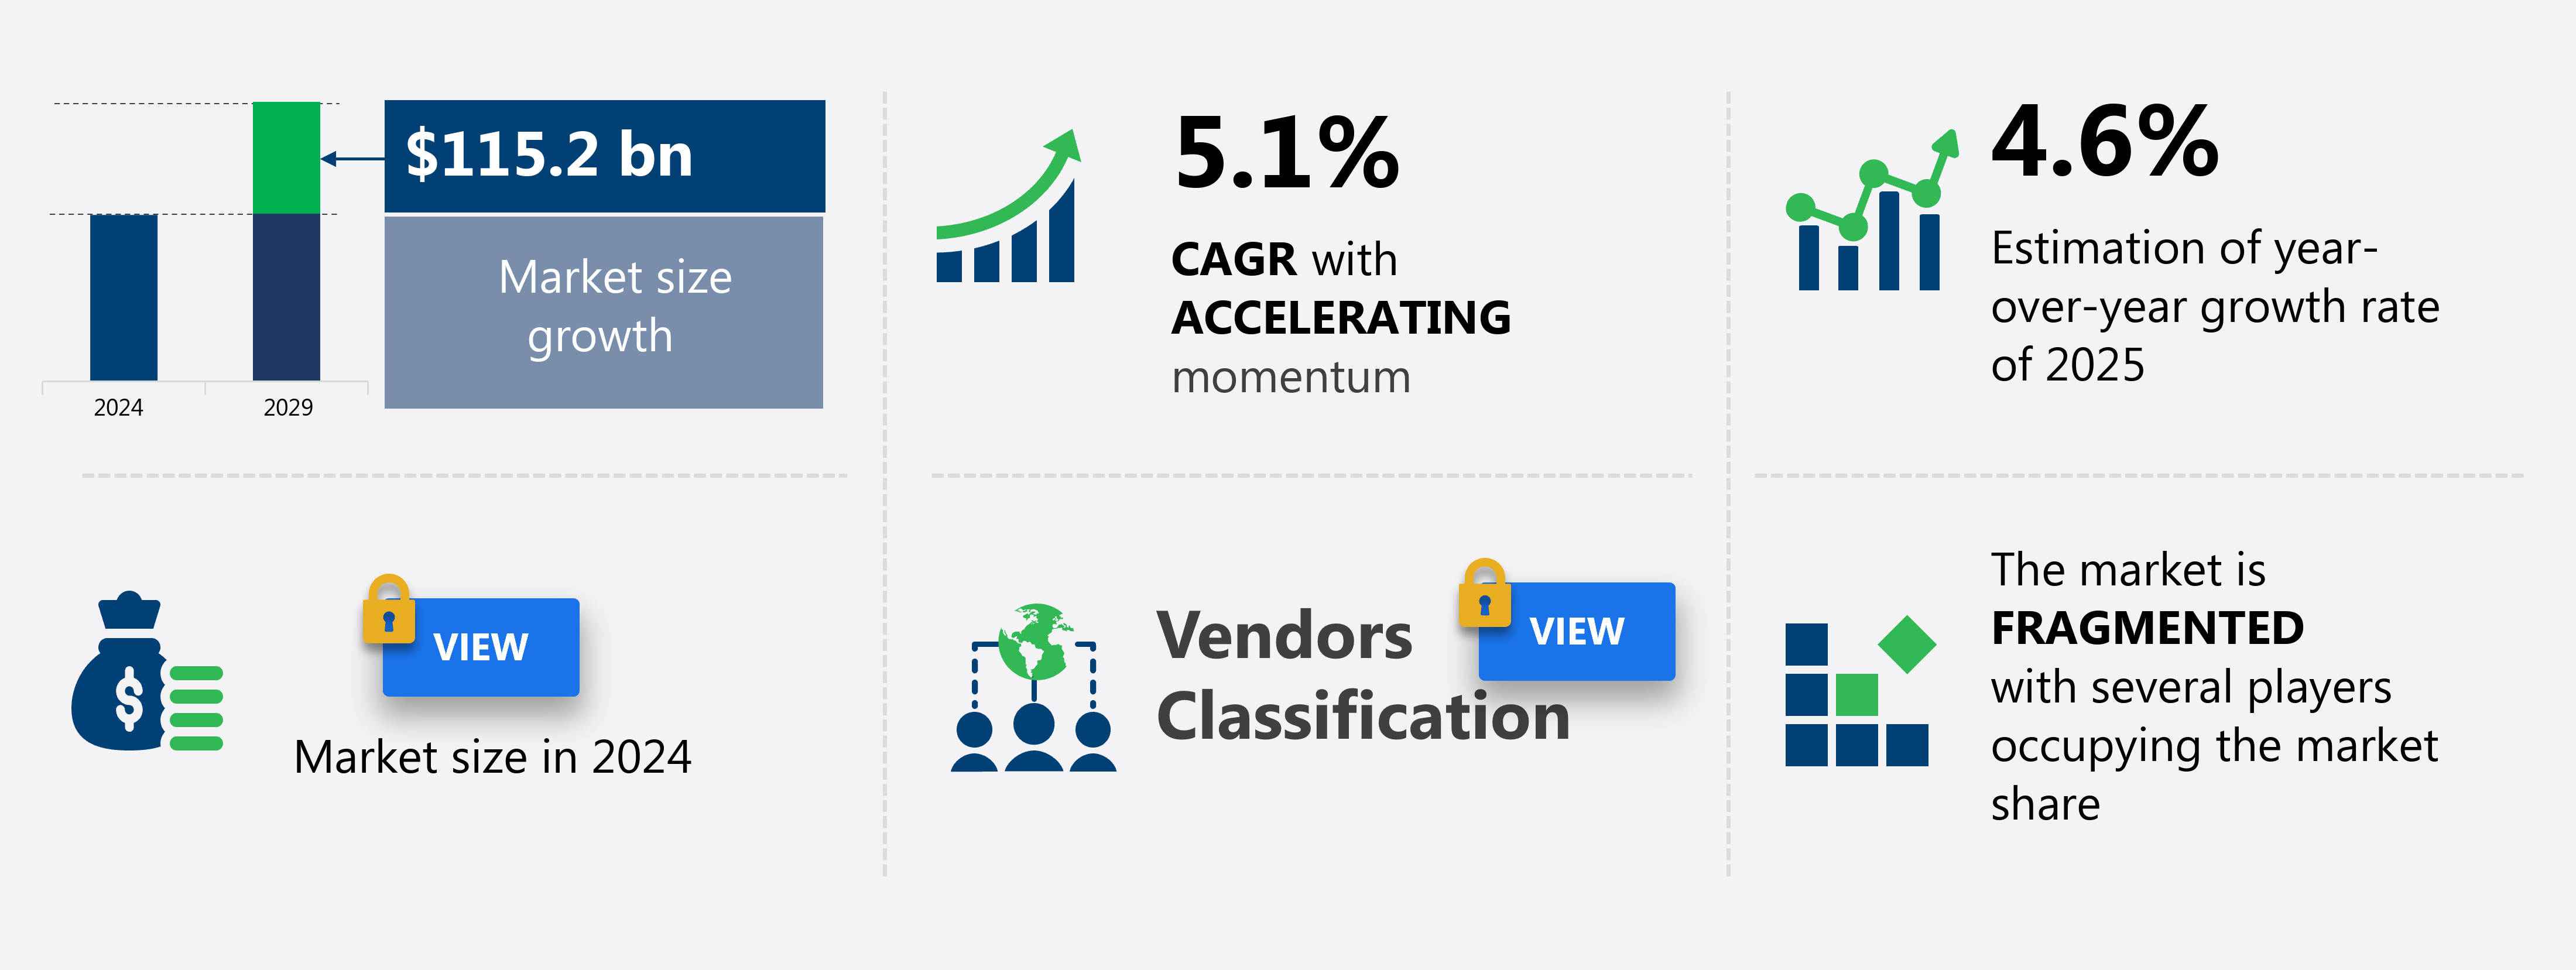
The Europe facility management (FM) services market size is forecast to increase by USD 115.2 billion at a CAGR of 5.1% between 2024 and 2029.
- The Facility Management (FM) Services Market is experiencing significant growth, driven by the increasing adoption of smart buildings and the utilization of technology platforms for workforce management. These trends enable more efficient and effective FM services, enhancing operational productivity and reducing costs for businesses. However, regulatory standards associated with FM services pose challenges. Compliance with these regulations can be complex and costly, particularly in sectors such as healthcare and education. Furthermore, supply chain inconsistencies can temper growth potential, as FM companies rely on a steady supply of materials and equipment to maintain client sites.
- To capitalize on market opportunities and navigate challenges effectively, companies must stay abreast of regulatory requirements and invest in robust supply chain management strategies. By doing so, they can differentiate themselves in a competitive market and deliver high-quality services that meet client needs. Another growth factor is the rising demand for eco-friendly cleaning products, as more organizations prioritize sustainability and environmental responsibility. Insurance companies also focuses on planned maintenance to prevent equipment failures and safety issues, which can lead to costly repairs, fines, legal action, and operational disruptions.
What will be the size of the Europe Facility Management (FM) Services Market during the forecast period?
- In the dynamic Facility Management (FM) services market, technology adoption is a key trend driving innovation. Artificial Intelligence (AI) and cloud-based solutions are transforming FM, enabling real-time building performance analytics and digital twin technology for predictive maintenance. Workplace culture is evolving, with a focus on health and wellness, employee engagement, and sustainable operations. Zero-energy buildings and carbon footprinting are priorities, requiring environmental impact assessments and compliance auditing. Mobile applications facilitate remote workforce management and disaster recovery. Business continuity plans are essential, as is social responsibility and human resources management. The market is experiencing significant growth due to the increasing construction activities in both residential and non-residential sectors.
- Smart metering and renewable energy are crucial for energy efficiency and reducing reliance on traditional energy sources. The circular economy is gaining traction, with an emphasis on data-driven decision making and building lifecycle management. Digital transformation is the new norm, enabling facility optimization and community engagement.
How is this market segmented?
The market research report provides comprehensive data (region-wise segment analysis), with forecasts and estimates in "USD billion" for the period 2025-2029, as well as historical data from 2019-2023 for the following segments.
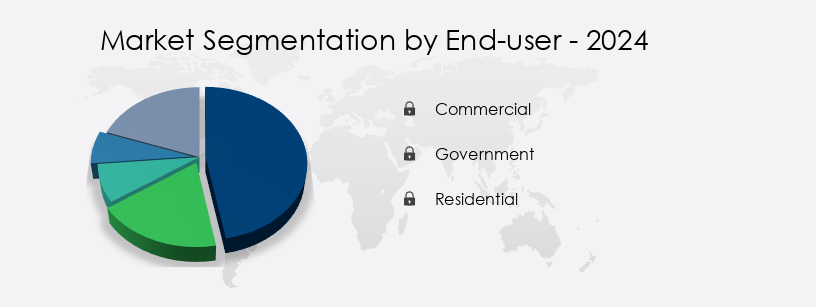
- End-user
- Commercial
- Government
- Residential
- Service
- Soft services
- Hard services
- Deployment
- Outsourced FM
- In-House FM
- Hybrid FM
- Geography
- Europe
- France
- Germany
- Italy
- UK
- Europe
By End-user Insights
The commercial segment is estimated to witness significant growth during the forecast period. The market experiences significant growth, particularly in the commercial segment. Major contributors to this segment include the business services, IT, industrial and manufacturing, real estate, and healthcare sectors. The increasing number of multinational corporations and small and medium businesses necessitates the demand for commercial office spaces in both developed and developing countries, driving the need for FM services. Office buildings dominate the commercial segment due to the growing preference for safe, secure, and convenient workplaces. Preventive maintenance, infrastructure management, and energy efficiency are essential components of FM services, ensuring building performance and reducing operational costs. Green building practices and sustainability initiatives are gaining popularity, leading to LEED certification and compliance with regulations. Facility management companies offer a range of services, including preventive maintenance checks, inspections, security, and emergency response plans. Environmental sustainability initiatives, such as waste management and recycling programs, and energy-efficient technologies, are also becoming essential components of facilities management.
The Commercial segment showed a gradual increase during the forecast period. Smart buildings, integrated facility management, and outsourcing services enhance workplace solutions and optimize space management. Real estate services, risk management, company management, and contract management are integral to FM services, ensuring safety standards and tenant relations. The integration of IoT, data analytics, and building automation enables remote monitoring, cost optimization, and effective work order management. Additionally, the education sector, hospitality industry, and retail stores benefit from FM services, with a focus on water conservation, HVAC systems, facility design, and corrective maintenance. In summary, the market is a critical component of the business world, providing essential services to various sectors, including manufacturing plants, commercial real estate, IT facilities, hospitality and tourism, banking and finance, healthcare, and more.
Market Dynamics
Our researchers analyzed the data with 2024 as the base year, along with the key drivers, trends, and challenges. A holistic analysis of drivers will help companies refine their marketing strategies to gain a competitive advantage.
What are the Europe Facility Management (FM) Services Market drivers leading to the rise in adoption of the Industry?
- The increasing implementation of smart building technology is the primary market catalyst. The European facility management (FM) services market is experiencing significant growth due to the increasing adoption of smart buildings. Smart buildings utilize innovative technologies, such as the Internet of Things (IoT), sensors, and automation systems, to optimize operations, enhance occupant comfort, and promote energy efficiency. European countries are prioritizing sustainability and energy conservation, making smart buildings a strategic solution to reduce carbon emissions, operational costs, and maximize resource utilization. This trend presents lucrative opportunities for FM service providers to offer specialized expertise in managing and maintaining these technologically advanced facilities. Integrated facility management, asset management, and compliance regulations, such as LEED certification, are essential components of smart building management.
- Remote monitoring, facility audits, and building automation are also critical services that FM providers offer to ensure optimal performance and adherence to green building practices. Outsourcing services for building maintenance and workplace solutions have become increasingly popular as organizations seek to focus on their core competencies. FM providers offer cost savings, improved operational efficiency, and expertise in the latest technologies and regulations. The future of FM services lies in the integration of advanced technologies, such as artificial intelligence and machine learning, to create efficient facilities. The European FM services market is poised for continued growth as the demand for smart buildings and sustainable facilities increases.
What are the Europe Facility Management (FM) Services Market trends shaping the Industry?
- The utilization of technology platforms for workforce management is an emerging market trend. Effective management of workforces through advanced technologies is a mandatory practice for modern businesses. The market is experiencing significant growth due to the adoption of advanced digital solutions for workforce management. With the increasing intricacy and magnitude of FM operations, organizations are embracing technology platforms to optimize their workforce management processes. These solutions offer features such as scheduling, task assignment, performance monitoring, and communication tools, empowering facilities managers to effectively allocate resources, oversee work progress, and adhere to service level agreements and regulatory requirements. By automating manual tasks and offering real-time insights into workforce activities, these platforms boost operational efficiency, lessen administrative burdens, and enhance overall service delivery, thereby fueling the demand for FM services in Europe.
- Moreover, sustainability initiatives, customer service, occupancy management, space management, property management, water conservation, and IoT integration are other crucial factors driving the FM services market in Europe. Sustainability initiatives, such as energy conservation and waste reduction, are increasingly becoming a priority for organizations, leading them to seek FM services that can help them meet their sustainability goals. Customer service, occupancy management, and space management are essential components of FM services that ensure a comfortable and productive work environment for employees. Property management involves maintaining the physical structure and infrastructure of buildings, while water conservation is a critical issue in Europe, making FM services that focus on water management in high demand. These factors are driving operational efficiency, reducing administrative burdens, and enhancing overall service delivery, making FM services an indispensable part of modern business operations in Europe.
How does Europe Facility Management (FM) Services Market faces challenges during its growth?
- The growth of the FM services industry is significantly influenced by the regulatory standards that govern its operations. These stringent regulations pose a significant challenge to industry expansion. The Facility Management (FM) services market is subject to various regulatory compliance requirements, particularly in Europe, which pose challenges for market growth. The regulatory landscape encompasses health and safety standards, environmental regulations, data protection laws, and labor regulations. Compliance with these regulations necessitates FM service providers to navigate a complex web of legal requirements, which may differ significantly from one country to another. For instance, the European Union's General Data Protection Regulation (GDPR) imposes stringent restrictions on personal data handling and processing, necessitating robust data protection measures and privacy safeguards in FM operations. Additionally, health and safety regulations like the EU's Framework Directive on Safety and Health at Work mandate comprehensive risk assessments, training programs, and safety protocols to ensure worker and occupant safety in managed facilities.
- In data centers, energy management and space optimization are crucial aspects of FM services. Janitorial services, landscaping, construction management, HVAC systems, facility design, corrective maintenance, and tenant relations are other essential FM services. Data analytics plays a vital role in optimizing facility operations and improving energy efficiency. Safety standards, energy management, and data analytics are key market drivers, while the complexity of regulatory compliance and labor costs are challenges.
Exclusive Europe Facility Management (FM) Services Market Customer Landscape
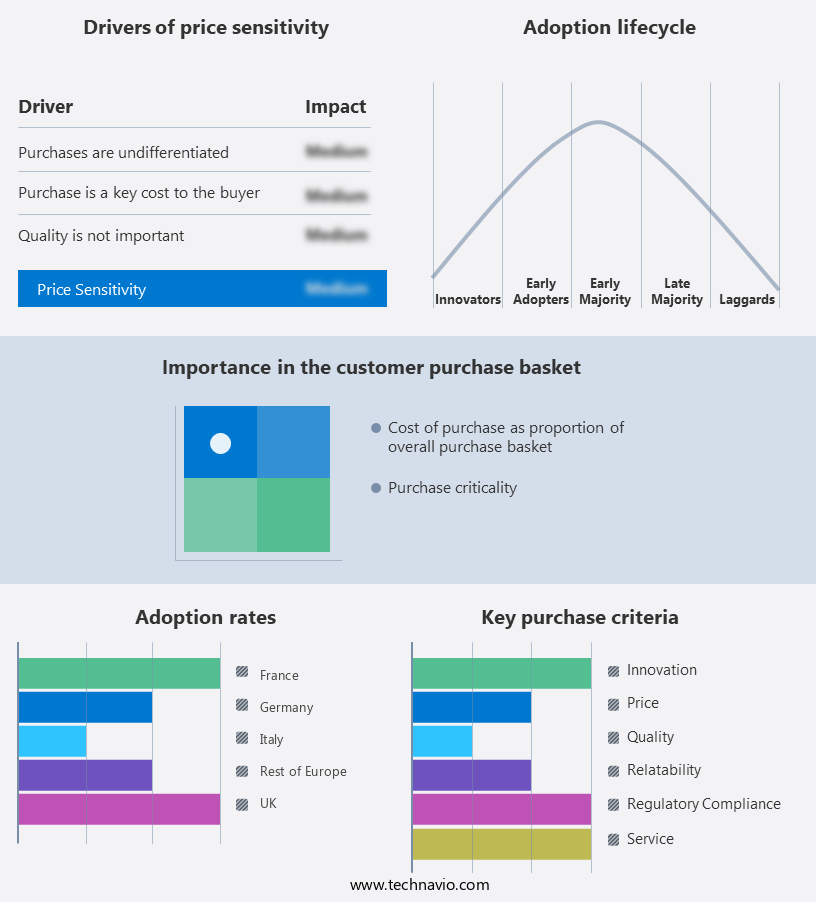
The market forecasting report includes the adoption lifecycle of the market, covering from the innovator's stage to the laggard's stage. It focuses on adoption rates in different regions based on penetration. Furthermore, the report also includes key purchase criteria and drivers of price sensitivity to help companies evaluate and develop their market growth analysis strategies.
Customer Landscape
Key Companies & Market Insights
Companies are implementing various strategies, such as strategic alliances, market forecast partnerships, mergers and acquisitions, geographical expansion, and product/service launches, to enhance their presence in the market.
The market research and growth report includes detailed analyses of the competitive landscape of the market and information about key companies, including:
- Andron Contract Services Ltd.
- Apleona GmbH
- Assured EU
- ASURA Group
- ATLAS IFM srl
- CBRE Group Inc.
- Compass Group Plc
- Cushman and Wakefield Plc
- Dussmann Group
- EMCOR Group Inc.
- Honeywell International Inc.
- Johnson Controls International Plc
- Leadec Holding BV and Co. KG
- Mitie Group plc
- Piepenbrock Service GmbH plus Co.
- Schneider Electric SE
- SGS SA
- Siemens AG
- Sodexo SA
Qualitative and quantitative analysis of companies has been conducted to help clients understand the wider business environment as well as the strengths and weaknesses of key market players. Data is qualitatively analyzed to categorize companies as pure play, category-focused, industry-focused, and diversified; it is quantitatively analyzed to categorize companies as dominant, leading, strong, tentative, and weak.
Recent Development and News in Facility Management (FM) Services Market In Europe
- In February 2024, Johnson Controls International, a leading global provider of facility management (FM) services, announced the launch of Metasys Eco Manager, an advanced energy management solution designed to optimize energy usage and reduce carbon emissions in buildings (Johnson Controls International Press Release, 2024). This new product offering represents a significant technological advancement in the FM services market, enabling clients to enhance their sustainability efforts and save on energy costs.
- In November 2024, ISS Facility Services, a global FM provider, acquired FM Matters, a UK-based FM company, marking a significant expansion into the European market (ISS Facility Services Press Release, 2024). This acquisition represents a key geographic development, as it enables ISS to strengthen its presence in Europe and expand its client base, while also gaining access to FM Matters' local expertise and resources.
- In March 2025, the European Union passed the new Energy Performance of Buildings Directive (EPBD), which mandates the implementation of minimum energy performance standards for all buildings in the EU (European Parliament Press Release, 2025). This regulatory development represents a significant opportunity for FM services providers, as they will be in high demand to help building owners and operators comply with the new regulations and optimize their energy usage.
Research Analyst Overview
The facility management (FM) services market continues to evolve, with dynamics shaping its applications across various sectors. In commercial real estate, infrastructure management plays a crucial role in maintaining building performance and ensuring compliance with regulations. Preventive maintenance schedules keep manufacturing plants running efficiently, while cleaning services enhance workplace solutions and contribute to indoor air quality. Waste management and energy efficiency are key concerns in both real estate services and the education sector. Risk management and company management are essential for ensuring safety standards in all facilities, from office buildings to data centers and hospitality industry establishments. Smart buildings and IoT integration facilitate cost optimization and remote monitoring, while facility audits and building automation help maintain sustainability initiatives. The facilities management market in North America is diverse, encompassing sectors such as manufacturing plants, commercial real estate, IT facilities, hospitality and tourism, banking and finance, healthcare, and residential real estate.
Contract management and customer service are vital components of integrated facility management, which encompasses green building practices and space management. Property management in retail stores requires a focus on occupancy management and security services, while water conservation remains a priority in all sectors. HVAC systems and facility design are continually evolving to meet energy efficiency standards and tenant relations are crucial for maintaining positive work environments. Corrective maintenance and tenant relations are integral parts of the FM services market, ensuring that facilities operate smoothly and efficiently. The ongoing integration of technology, such as data analytics and work order management, enhances the overall effectiveness of FM services. Facility management technology, including building automation systems, software, and maintenance connection platforms, streamlines operations and resource allocation.
Dive into Technavio's robust research methodology, blending expert interviews, extensive data synthesis, and validated models for unparalleled Facility Management (FM) Services Market in Europe insights. See full methodology.
|
Market Scope |
|
|
Report Coverage |
Details |
|
Page number |
194 |
|
Base year |
2024 |
|
Historic period |
2019-2023 |
|
Forecast period |
2025-2029 |
|
Growth momentum & CAGR |
Accelerate at a CAGR of 5.1% |
|
Market growth 2025-2029 |
USD 115.2 billion |
|
Market structure |
Fragmented |
|
YoY growth 2024-2025(%) |
4.6 |
|
Competitive landscape |
Leading Companies, Market Positioning of Companies, Competitive Strategies, and Industry Risks |
What are the Key Data Covered in this Market Research Report?
- CAGR of the market during the forecast period
- Detailed information on factors that will drive the market growth and forecasting between 2025 and 2029
- Precise estimation of the size of the market and its contribution of the market in focus to the parent market
- Accurate predictions about upcoming market growth and trends and changes in consumer behaviour
- Growth of the market across Europe
- Thorough analysis of the market's competitive landscape and detailed information about companies
- Comprehensive analysis of factors that will challenge the growth of market companies
We can help! Our analysts can customize this market research report to meet your requirements Get in touch
 RIA -
RIA - 
