Event Tourism Market Analysis, Size, and Forecast 2026-2030: Europe (UK, Germany, and France), North America (US, Canada, and Mexico), APAC (China, India, and Japan), South America (Brazil, Argentina, and Colombia), Middle East and Africa (UAE, Saudi Arabia, and South Africa), and Rest of World (ROW)

Event Tourism Market Analysis, Size, and Forecast 2026-2030:
Europe (UK, Germany, and France), North America (US, Canada, and Mexico), APAC (China, India, and Japan), South America (Brazil, Argentina, and Colombia), Middle East and Africa (UAE, Saudi Arabia, and South Africa), and Rest of World (ROW)

Published: Apr 2026 296 Pages SKU: IRTNTR81422

Market Overview at a Glance

$918.6 B
Market Opportunity
7.1%
CAGR 2025 - 2030
30.4%
Europe Growth
$874.3 B
Sports tourism segment 2024

Event Tourism Market Size 2026-2030

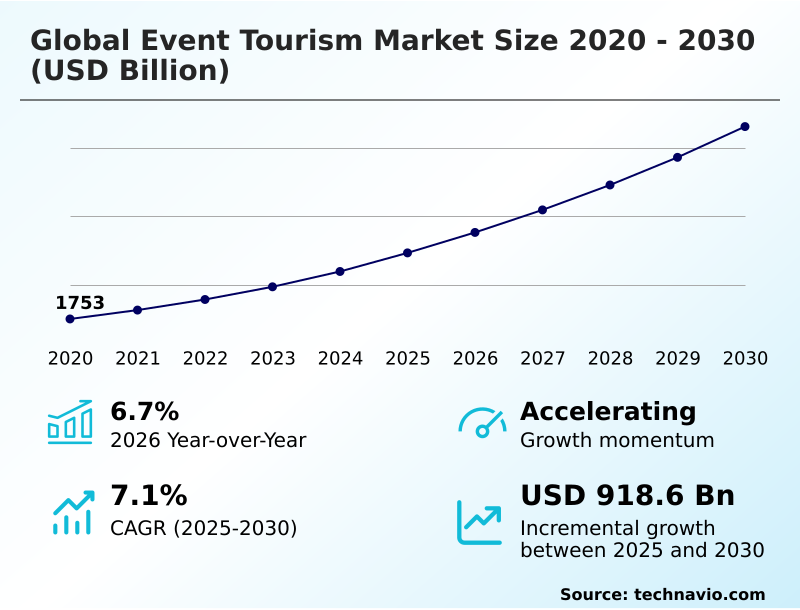
The event tourism market size is valued to increase by USD 918.6 billion, at a CAGR of 7.1% from 2025 to 2030. Increasing government investments in infrastructure and tourism promotion will drive the event tourism market.

Major Market Trends & Insights

  • Europe dominated the market and accounted for a 30.4% growth during the forecast period.
  • By Type - Sports tourism segment was valued at USD 874.3 billion in 2024
  • By Location - Domestic segment accounted for the largest market revenue share in 2024

Market Size & Forecast

  • Market Opportunities: USD 1399.2 billion
  • Market Future Opportunities: USD 918.6 billion
  • CAGR from 2025 to 2030 : 7.1%

Market Summary

  • The event tourism market is defined by organized travel to destinations for the primary purpose of attending scheduled gatherings. This sector integrates hospitality, transportation, and event management to create comprehensive experiences. The market's growth is fueled by a consumer shift toward experiential travel and the increasing globalization of business and culture.
  • A key driver is the proactive investment by municipal bodies in infrastructure to host mega-events, which stimulates local economies. Technology, including digital ticketing and virtual reality previews, enhances the attendee experience and streamlines logistics.
  • For instance, a city hosting an international cultural festival might use predictive analytics to manage crowd flow and optimize public transport schedules, improving safety and visitor satisfaction. However, the industry faces challenges from geopolitical instability and the high costs of infrastructure.
  • A significant trend is the move toward sustainable event management, with organizers adopting eco-friendly practices like waste reduction and carbon offsetting to meet the demands of environmentally conscious travelers. This convergence of technology, sustainability, and experience-driven demand shapes the competitive landscape of the MICE industry and beyond.

What will be the Size of the Event Tourism Market during the forecast period?

Get Key Insights on Market Forecast (PDF) Get Free Sample

How is the Event Tourism Market Segmented?

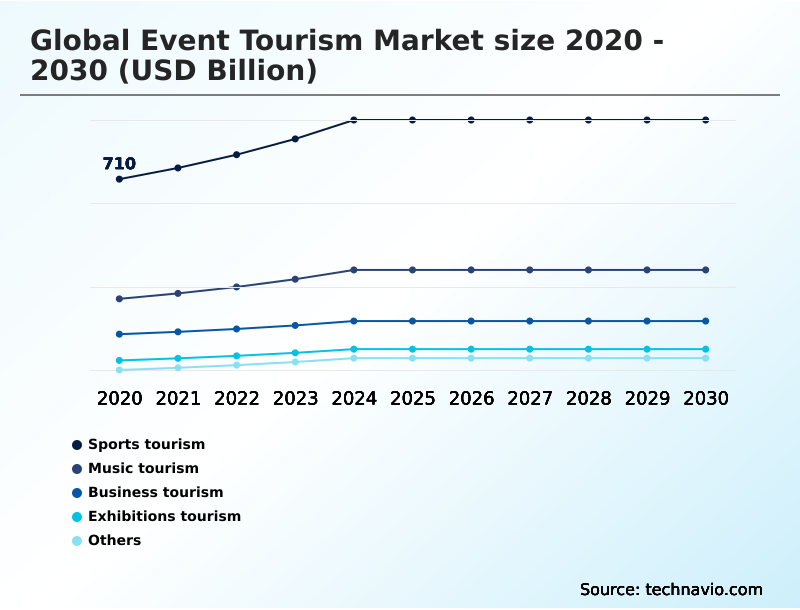
The event tourism industry research report provides comprehensive data (region-wise segment analysis), with forecasts and estimates in "USD billion" for the period 2026-2030, as well as historical data from 2020-2024 for the following segments.

  • Type
    • Sports tourism
    • Music tourism
    • Business tourism
    • Exhibitions tourism
    • Others
  • Location
    • Domestic
    • International
  • Channel
    • Physical
    • Virtual
  • Geography
    • Europe
      • UK
      • Germany
      • France
    • North America
      • US
      • Canada
      • Mexico
    • APAC
      • China
      • India
      • Japan
    • South America
      • Brazil
      • Argentina
      • Colombia
    • Middle East and Africa
      • UAE
      • Saudi Arabia
      • South Africa
    • Rest of World (ROW)

By Type Insights

The sports tourism segment is estimated to witness significant growth during the forecast period.

The sports tourism sub-segment is a foundational pillar of the event tourism market, driven by high-volume traveler flows and significant infrastructure investment.

This category relies on effective spectator sports logistics and meticulous venue capacity planning to accommodate major global tournaments and professional league competitions.

Successful destination marketing for these events now extends beyond the game itself, incorporating sports tourism packages that offer immersive experiential travel. Integrating data-driven fan engagement platforms has been shown to improve merchandise sales by up to 15%.

As cities compete for hosting rights, their focus shifts to legacy planning, ensuring that investments serve the local population long-term.

This requires close collaboration with firms specializing in meeting and event management and sophisticated travel management software to handle complex logistics.

Get Free Sample

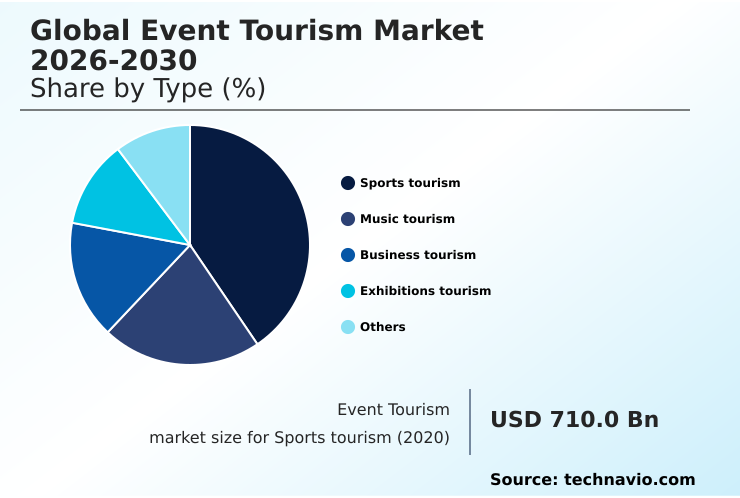
The Sports tourism segment was valued at USD 874.3 billion in 2024 and showed a gradual increase during the forecast period.

Get Free Sample

Regional Analysis

Europe is estimated to contribute 30.4% to the growth of the global market during the forecast period.Technavio’s analysts have elaborately explained the regional trends and drivers that shape the market during the forecast period.

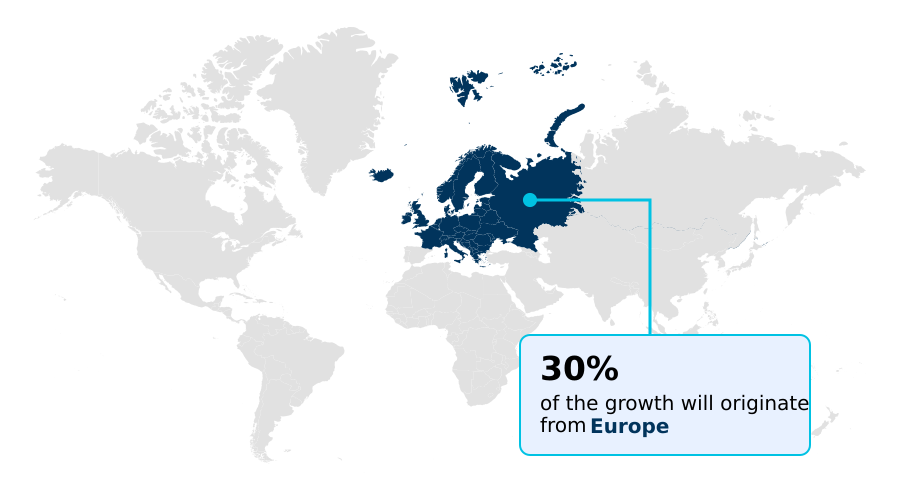
See How Event Tourism Market Demand is Rising in Europe Get Free Sample

The Asia-Pacific region is experiencing the most rapid acceleration in the market, fueled by economic development and massive government investment in modernization. The trend of gig-tripping is particularly prominent here, where fans travel internationally for music festival management showcases.

This region leads in leveraging technology, with digital ticketing and virtual reality previews becoming standard. The adoption of hybrid event platforms has expanded audience reach by an average of 200%, integrating virtual event production with physical attendance.

This tech-forward approach supports sophisticated trade show management and innovative brand activation strategy. Effective hospitality service integration is key to handling the influx of visitors.

This combination of technological superiority and a rapidly expanding consumer base ensures the region will continue to dictate global market trends. The use of digital ticketing has also reduced fraud-related losses by over 90%.

Market Dynamics

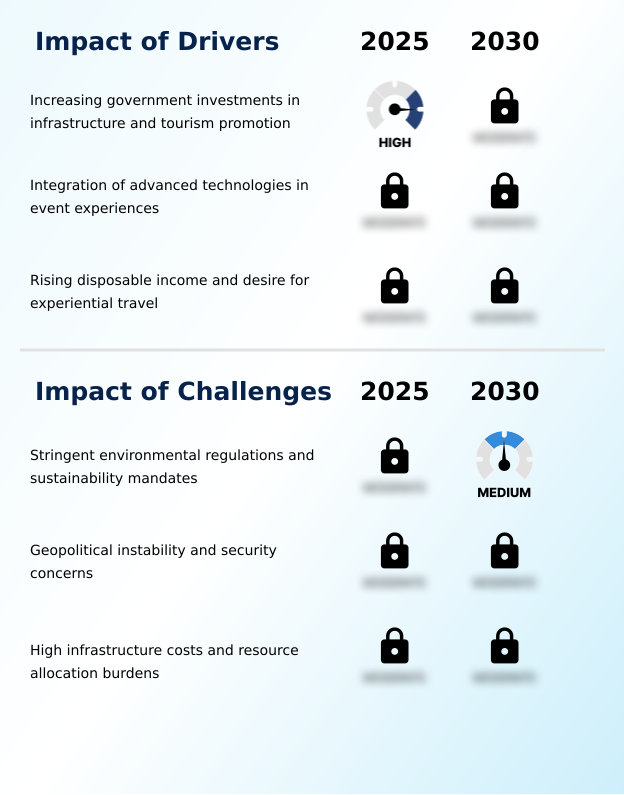
Our researchers analyzed the data with 2025 as the base year, along with the key drivers, trends, and challenges. A holistic analysis of drivers will help companies refine their marketing strategies to gain a competitive advantage.

  • The global event tourism market 2026-2030 navigates a complex landscape where strategic decisions are shaped by external and internal factors. The impact of geopolitical instability on event tourism forces organizers to develop agile contingency plans and robust security risk management for international conferences.
  • Destinations that implement advanced protocols report a 40% lower insurance premium compared to those with standard security measures. Concurrently, there is a clear shift toward unique, localized experiences, demanding new strategies for hyper-localized cultural immersion festivals. The ROI of wellness and health-centric event tourism is becoming a key metric for investors, as this segment demonstrates high per-capita spending.
  • A critical success factor is the technology integration in large-scale sporting events, where leveraging AR and VR for virtual site inspections is gaining traction. However, the industry faces significant challenges in eco-friendly mega-event production and must conduct thorough cost-benefit analysis of MICE infrastructure investment.
  • Effective supply chain logistics for destination weddings and precise methods for measuring economic impact of music tourism are essential for niche market profitability. Furthermore, the implementation of biometric solutions for event access control, best practices for bleisure travel programs, and clear sustainability reporting for corporate events are becoming industry standards.
  • Attendee engagement platforms for hybrid events and understanding the role of DMOs in attracting global conventions are pivotal for future growth.

What are the key market drivers leading to the rise in the adoption of Event Tourism Industry?

  • Increasing government investments in tourism-related infrastructure and promotional activities serve as a key driver for market expansion.

  • Technological innovation and strategic government investments are primary catalysts for market expansion. The integration of augmented reality applications and immersive digital experiences is transforming attendee engagement.
  • Cities investing in smart-city technology for event management report a 25% improvement in traffic flow and resource distribution. This tourism infrastructure development creates an environment where destination management companies can thrive.
  • Moreover, predictive analytics tools enable organizers to optimize operations, leading to an 18% increase in ancillary revenue through targeted offerings. For corporate event planning, personalized networking algorithms are becoming essential for delivering value.
  • This focus on technology, combined with aggressive live entertainment promotion, ensures destinations remain competitive and can offer sophisticated, seamless event experiences that drive both attendance and economic benefit.

What are the market trends shaping the Event Tourism Industry?

  • The rise of eco-tourism and the adoption of sustainable practices for mega-events are emerging as a significant trend. This shift is reshaping operational models across the event tourism market.

  • A profound shift toward sustainability and authenticity is reshaping the market. The adoption of sustainable event management is no longer optional, with a focus on comprehensive carbon offset programs and verifiable sustainable tourism practices. Events integrating these measures report a 15% higher attendee satisfaction rate.
  • This aligns with the growth of experiential travel and bleisure travel, where participants seek deeper connections. In response, cultural festival planning is becoming more localized, moving away from generic formats. Attendee journey mapping is now a critical tool used by experiential marketing agencies to design these personalized experiences.
  • The emphasis on tangible outcomes has also elevated the importance of event ROI measurement, compelling organizers to prove value beyond attendance numbers, especially as corporate sponsorship interest grows by over 20% for green-certified events.

What challenges does the Event Tourism Industry face during its growth?

  • Stringent environmental regulations and sustainability mandates present a key challenge, impacting the operational and financial aspects of industry growth.

  • The market grapples with significant operational and financial headwinds, primarily from security risks and high infrastructure costs. Implementing robust event security protocols is non-negotiable, with advanced solutions like biometric ticketing and contactless entry systems reducing entry processing times by 40%. However, these systems, combined with crowd management analytics, can represent up to 30% of an event's operational budget.
  • For the MICE industry, this pressure is acute, affecting everything from exhibition organization to activities led by a professional congress organization (pco). The complexities of global business travel are compounded by the need for stringent travel and expense management. These challenges require organizers to balance safety and efficiency with profitability, making risk mitigation a central theme in long-term strategic planning.

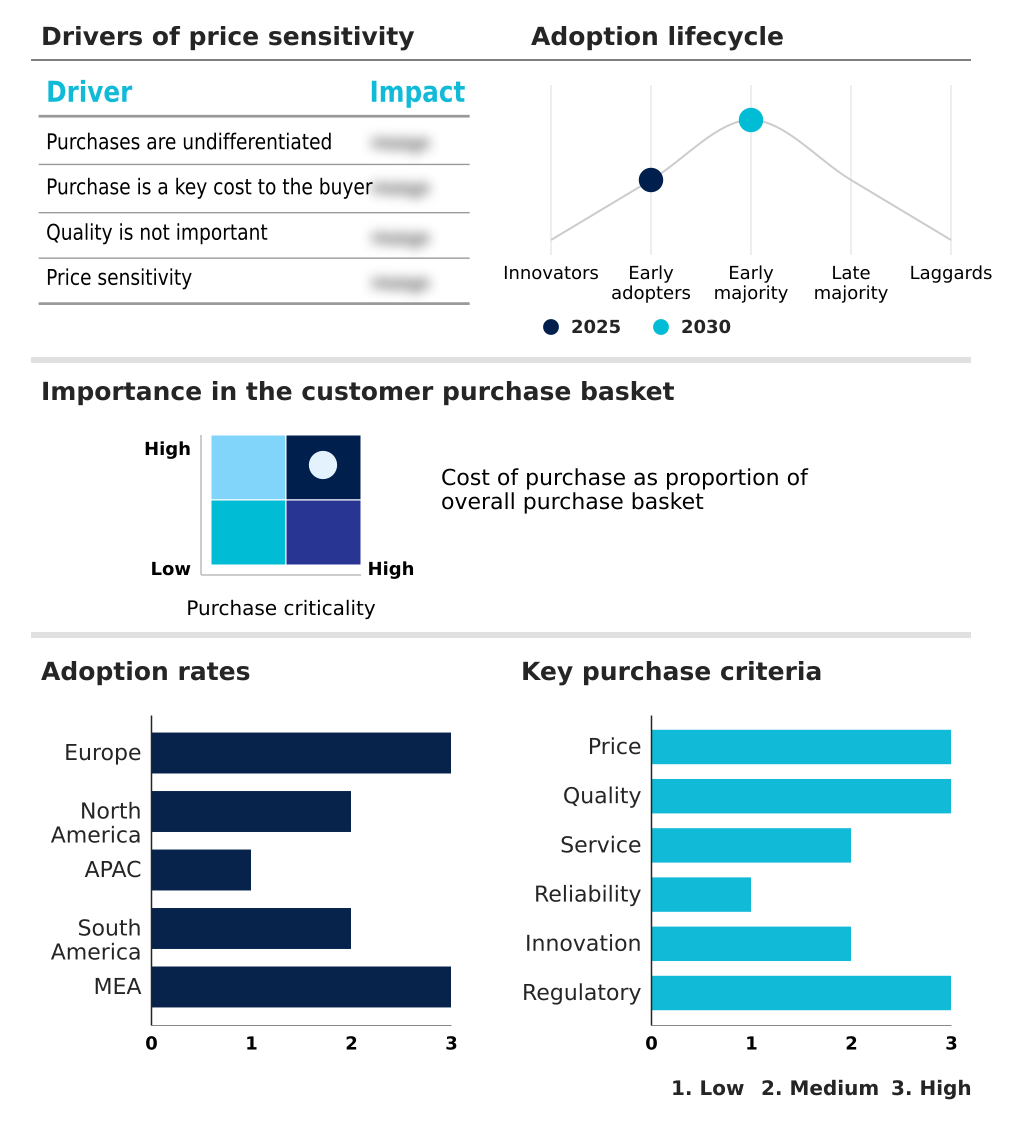
Exclusive Technavio Analysis on Customer Landscape

The event tourism market forecasting report includes the adoption lifecycle of the market, covering from the innovator’s stage to the laggard’s stage. It focuses on adoption rates in different regions based on penetration. Furthermore, the event tourism market report also includes key purchase criteria and drivers of price sensitivity to help companies evaluate and develop their market growth analysis strategies.

Customer Landscape of Event Tourism Industry

Competitive Landscape

Companies are implementing various strategies, such as strategic alliances, event tourism market forecast, partnerships, mergers and acquisitions, geographical expansion, and product/service launches, to enhance their presence in the industry.

AEG Worldwide - Offers a cloud-based enterprise platform for venue sourcing, event registration, and enhancing attendee engagement through integrated software solutions.

The industry research and growth report includes detailed analyses of the competitive landscape of the market and information about key companies, including:

  • AEG Worldwide
  • ATPI Group
  • BCD Meetings and Events
  • Clarion Events Ltd.
  • Creative Group Inc.
  • Cvent Inc
  • CWT
  • Emerald X LLC
  • Eventbrite Inc.
  • FCM Travel Solutions
  • George P. Johnson
  • Global Business Travel Group
  • Informa PLC
  • ITA Group
  • Live Nation Entertainment Inc.
  • Maritz Holdings Inc.
  • Messe Frankfurt GmbH
  • Reed Exhibitions Ltd.
  • StubHub Holdings Inc.

Qualitative and quantitative analysis of companies has been conducted to help clients understand the wider business environment as well as the strengths and weaknesses of key industry players. Data is qualitatively analyzed to categorize companies as pure play, category-focused, industry-focused, and diversified; it is quantitatively analyzed to categorize companies as dominant, leading, strong, tentative, and weak.

Recent Development and News in Event tourism market

  • In May 2025, the World Travel and Tourism Council announced that international visitor spending is projected to reach an unprecedented level, reflecting surging demand for cross-border event experiences.
  • In March 2025, India's Ministry of Tourism, in partnership with the Federation of Indian Chambers of Commerce & Industry (FICCI), launched India Energy Week, attracting over 75,000 delegates and positioning the nation as a credible host for large-scale industrial summits.
  • In February 2025, VisitBritain initiated a new campaign promoting regional centers like Birmingham and Manchester to decentralize corporate events and sporting competitions away from London.
  • In November 2024, the Saudi Tourism Authority reported record-high domestic tourism spending, fueled by a national strategy to develop large-scale entertainment and sporting events to boost the internal economy.

Dive into Technavio’s robust research methodology, blending expert interviews, extensive data synthesis, and validated models for unparalleled Event Tourism Market insights. See full methodology.

Market Scope
Page number 296
Base year 2025
Historic period 2020-2024
Forecast period 2026-2030
Growth momentum & CAGR Accelerate at a CAGR of 7.1%
Market growth 2026-2030 USD 918.6 billion
Market structure Fragmented
YoY growth 2025-2026(%) 6.7%
Key countries UK, Germany, France, Italy, Spain, The Netherlands, US, Canada, Mexico, China, India, Japan, South Korea, Australia, Indonesia, Brazil, Argentina, Colombia, UAE, Saudi Arabia, South Africa, Turkey and Israel
Competitive landscape Leading Companies, Market Positioning of Companies, Competitive Strategies, and Industry Risks

Request Free Sample

Research Analyst Overview

  • The event tourism market is characterized by its continuous evolution, driven by technological adoption and shifting consumer preferences toward high-value experiential travel. Core to this transformation is the integration of advanced digital tools. The use of predictive analytics tools, for example, has enabled organizers to improve resource allocation accuracy by over 25%.
  • Boardroom decisions are increasingly influenced by the need to balance high-impact experiential marketing with sustainable event management. Solutions range from venue sourcing solutions and brand activation services to comprehensive incentive travel programs. The rise of bleisure travel is compelling the MICE industry to innovate, blending professional obligations with leisure.
  • Technology such as virtual reality previews, augmented reality applications, and smart-city technology are no longer novelties but essential components for creating immersive digital experiences. The operational backbone relies on efficient digital ticketing, biometric ticketing, and contactless entry systems, all managed through sophisticated crowd management analytics.
  • For hybrid gatherings, personalized networking algorithms are key to delivering value, while a commitment to carbon offset programs addresses growing environmental concerns.

What are the Key Data Covered in this Event Tourism Market Research and Growth Report?

  • What is the expected growth of the Event Tourism Market between 2026 and 2030?

    • USD 918.6 billion, at a CAGR of 7.1%

  • What segmentation does the market report cover?

    • The report is segmented by Type (Sports tourism, Music tourism, Business tourism, Exhibitions tourism, and Others), Location (Domestic, and International), Channel (Physical, and Virtual) and Geography (Europe, North America, APAC, South America, Middle East and Africa)

  • Which regions are analyzed in the report?

    • Europe, North America, APAC, South America and Middle East and Africa

  • What are the key growth drivers and market challenges?

    • Increasing government investments in infrastructure and tourism promotion, Stringent environmental regulations and sustainability mandates

  • Who are the major players in the Event Tourism Market?

    • AEG Worldwide, ATPI Group, BCD Meetings and Events, Clarion Events Ltd., Creative Group Inc., Cvent Inc, CWT, Emerald X LLC, Eventbrite Inc., FCM Travel Solutions, George P. Johnson, Global Business Travel Group, Informa PLC, ITA Group, Live Nation Entertainment Inc., Maritz Holdings Inc., Messe Frankfurt GmbH, Reed Exhibitions Ltd. and StubHub Holdings Inc.

Market Research Insights

  • The market's momentum is sustained by a complex interplay of logistical precision and technological innovation. Organizations utilizing integrated travel and expense management systems report processing cost reductions of up to 20%. The strategic application of attendee journey mapping is shown to improve engagement rates by over 30% during corporate event planning.
  • Destination management companies are crucial in this ecosystem, ensuring seamless hospitality service integration. As global business travel recovers, the emphasis on event ROI measurement has intensified, compelling experiential marketing agencies to deliver quantifiable results.
  • This dynamic environment requires sophisticated travel management software and a clear brand activation strategy to capture audience attention and justify budgetary allocations, solidifying the importance of meticulous meeting and event management in achieving strategic objectives.

We can help! Our analysts can customize this event tourism market research report to meet your requirements.

Get in touch

1. Executive Summary

1.1 Market overview

Executive Summary - Chart on Market Overview
Executive Summary - Data Table on Market Overview
Executive Summary - Chart on Global Market Characteristics
Executive Summary - Chart on Market by Geography
Executive Summary - Chart on Market Segmentation by Type
Executive Summary - Chart on Market Segmentation by Location
Executive Summary - Chart on Market Segmentation by Channel
Executive Summary - Chart on Incremental Growth
Executive Summary - Data Table on Incremental Growth
Executive Summary - Chart on Company Market Positioning

2. Technavio Analysis

2.1 Analysis of price sensitivity, lifecycle, customer purchase basket, adoption rates, and purchase criteria

2.2 Criticality of inputs and Factors of differentiation

Chart on Overview on criticality of inputs and factors of differentiation

2.3 Factors of disruption

Chart on Overview on factors of disruption

2.4 Impact of drivers and challenges

Chart on Impact of drivers and challenges in 2025 and 2030

3. Market Landscape

3.1 Market ecosystem

Chart on Parent Market
Data Table on - Parent Market

3.2 Market characteristics

Chart on Market characteristics analysis

3.3 Value chain analysis

Chart on Value chain analysis

4. Market Sizing

4.1 Market definition

Data Table on Offerings of companies included in the market definition

4.2 Market segment analysis

Market segments

4.3 Market size 2025

4.4 Market outlook: Forecast for 2025-2030

Chart on Global - Market size and forecast 2025-2030 ($ billion)
Data Table on Global - Market size and forecast 2025-2030 ($ billion)
Chart on Global Market: Year-over-year growth 2025-2030 (%)
Data Table on Global Market: Year-over-year growth 2025-2030 (%)

5. Historic Market Size

5.1 Global Event Tourism Market 2020 - 2024

Historic Market Size - Data Table on Global Event Tourism Market 2020 - 2024 ($ billion)

5.2 Type segment analysis 2020 - 2024

Historic Market Size - Type Segment 2020 - 2024 ($ billion)

5.3 Location segment analysis 2020 - 2024

Historic Market Size - Location Segment 2020 - 2024 ($ billion)

5.4 Channel segment analysis 2020 - 2024

Historic Market Size - Channel Segment 2020 - 2024 ($ billion)

5.5 Geography segment analysis 2020 - 2024

Historic Market Size - Geography Segment 2020 - 2024 ($ billion)

5.6 Country segment analysis 2020 - 2024

Historic Market Size - Country Segment 2020 - 2024 ($ billion)

6. Qualitative Analysis

6.1 Impact of AI on Global Event Tourism Market

6.2 Impact of Geopolitical Conflicts on Global Event Tourism Market

7. Five Forces Analysis

7.1 Five forces summary

Five forces analysis - Comparison between 2025 and 2030

7.2 Bargaining power of buyers

Bargaining power of buyers - Impact of key factors 2025 and 2030

7.3 Bargaining power of suppliers

Bargaining power of suppliers - Impact of key factors in 2025 and 2030

7.4 Threat of new entrants

Threat of new entrants - Impact of key factors in 2025 and 2030

7.5 Threat of substitutes

Threat of substitutes - Impact of key factors in 2025 and 2030

7.6 Threat of rivalry

Threat of rivalry - Impact of key factors in 2025 and 2030

7.7 Market condition

Chart on Market condition - Five forces 2025 and 2030

8. Market Segmentation by Type

8.1 Market segments

Chart on Type - Market share 2025-2030 (%)
Data Table on Type - Market share 2025-2030 (%)

8.2 Comparison by Type

Chart on Comparison by Type
Data Table on Comparison by Type

8.3 Sports tourism - Market size and forecast 2025-2030

Chart on Sports tourism - Market size and forecast 2025-2030 ($ billion)
Data Table on Sports tourism - Market size and forecast 2025-2030 ($ billion)
Chart on Sports tourism - Year-over-year growth 2025-2030 (%)
Data Table on Sports tourism - Year-over-year growth 2025-2030 (%)

8.4 Music tourism - Market size and forecast 2025-2030

Chart on Music tourism - Market size and forecast 2025-2030 ($ billion)
Data Table on Music tourism - Market size and forecast 2025-2030 ($ billion)
Chart on Music tourism - Year-over-year growth 2025-2030 (%)
Data Table on Music tourism - Year-over-year growth 2025-2030 (%)

8.5 Business tourism - Market size and forecast 2025-2030

Chart on Business tourism - Market size and forecast 2025-2030 ($ billion)
Data Table on Business tourism - Market size and forecast 2025-2030 ($ billion)
Chart on Business tourism - Year-over-year growth 2025-2030 (%)
Data Table on Business tourism - Year-over-year growth 2025-2030 (%)

8.6 Exhibitions tourism - Market size and forecast 2025-2030

Chart on Exhibitions tourism - Market size and forecast 2025-2030 ($ billion)
Data Table on Exhibitions tourism - Market size and forecast 2025-2030 ($ billion)
Chart on Exhibitions tourism - Year-over-year growth 2025-2030 (%)
Data Table on Exhibitions tourism - Year-over-year growth 2025-2030 (%)

8.7 Others - Market size and forecast 2025-2030

Chart on Others - Market size and forecast 2025-2030 ($ billion)
Data Table on Others - Market size and forecast 2025-2030 ($ billion)
Chart on Others - Year-over-year growth 2025-2030 (%)
Data Table on Others - Year-over-year growth 2025-2030 (%)

8.8 Market opportunity by Type

Market opportunity by Type ($ billion)
Data Table on Market opportunity by Type ($ billion)

9. Market Segmentation by Location

9.1 Market segments

Chart on Location - Market share 2025-2030 (%)
Data Table on Location - Market share 2025-2030 (%)

9.2 Comparison by Location

Chart on Comparison by Location
Data Table on Comparison by Location

9.3 Domestic - Market size and forecast 2025-2030

Chart on Domestic - Market size and forecast 2025-2030 ($ billion)
Data Table on Domestic - Market size and forecast 2025-2030 ($ billion)
Chart on Domestic - Year-over-year growth 2025-2030 (%)
Data Table on Domestic - Year-over-year growth 2025-2030 (%)

9.4 International - Market size and forecast 2025-2030

Chart on International - Market size and forecast 2025-2030 ($ billion)
Data Table on International - Market size and forecast 2025-2030 ($ billion)
Chart on International - Year-over-year growth 2025-2030 (%)
Data Table on International - Year-over-year growth 2025-2030 (%)

9.5 Market opportunity by Location

Market opportunity by Location ($ billion)
Data Table on Market opportunity by Location ($ billion)

10. Market Segmentation by Channel

10.1 Market segments

Chart on Channel - Market share 2025-2030 (%)
Data Table on Channel - Market share 2025-2030 (%)

10.2 Comparison by Channel

Chart on Comparison by Channel
Data Table on Comparison by Channel

10.3 Physical - Market size and forecast 2025-2030

Chart on Physical - Market size and forecast 2025-2030 ($ billion)
Data Table on Physical - Market size and forecast 2025-2030 ($ billion)
Chart on Physical - Year-over-year growth 2025-2030 (%)
Data Table on Physical - Year-over-year growth 2025-2030 (%)

10.4 Virtual - Market size and forecast 2025-2030

Chart on Virtual - Market size and forecast 2025-2030 ($ billion)
Data Table on Virtual - Market size and forecast 2025-2030 ($ billion)
Chart on Virtual - Year-over-year growth 2025-2030 (%)
Data Table on Virtual - Year-over-year growth 2025-2030 (%)

10.5 Market opportunity by Channel

Market opportunity by Channel ($ billion)
Data Table on Market opportunity by Channel ($ billion)

11. Customer Landscape

11.1 Customer landscape overview

Analysis of price sensitivity, lifecycle, customer purchase basket, adoption rates, and purchase criteria

12. Geographic Landscape

12.1 Geographic segmentation

Chart on Market share by geography 2025-2030 (%)
Data Table on Market share by geography 2025-2030 (%)

12.2 Geographic comparison

Chart on Geographic comparison
Data Table on Geographic comparison

12.3 Europe - Market size and forecast 2025-2030

Chart on Europe - Market size and forecast 2025-2030 ($ billion)
Data Table on Europe - Market size and forecast 2025-2030 ($ billion)
Chart on Europe - Year-over-year growth 2025-2030 (%)
Data Table on Europe - Year-over-year growth 2025-2030 (%)
Chart on Regional Comparison - Europe
Data Table on Regional Comparison - Europe

12.3.1 UK - Market size and forecast 2025-2030

Chart on UK - Market size and forecast 2025-2030 ($ billion)
Data Table on UK - Market size and forecast 2025-2030 ($ billion)
Chart on UK - Year-over-year growth 2025-2030 (%)
Data Table on UK - Year-over-year growth 2025-2030 (%)

12.3.2 Germany - Market size and forecast 2025-2030

Chart on Germany - Market size and forecast 2025-2030 ($ billion)
Data Table on Germany - Market size and forecast 2025-2030 ($ billion)
Chart on Germany - Year-over-year growth 2025-2030 (%)
Data Table on Germany - Year-over-year growth 2025-2030 (%)

12.3.3 France - Market size and forecast 2025-2030

Chart on France - Market size and forecast 2025-2030 ($ billion)
Data Table on France - Market size and forecast 2025-2030 ($ billion)
Chart on France - Year-over-year growth 2025-2030 (%)
Data Table on France - Year-over-year growth 2025-2030 (%)

12.3.4 Italy - Market size and forecast 2025-2030

Chart on Italy - Market size and forecast 2025-2030 ($ billion)
Data Table on Italy - Market size and forecast 2025-2030 ($ billion)
Chart on Italy - Year-over-year growth 2025-2030 (%)
Data Table on Italy - Year-over-year growth 2025-2030 (%)

12.3.5 Spain - Market size and forecast 2025-2030

Chart on Spain - Market size and forecast 2025-2030 ($ billion)
Data Table on Spain - Market size and forecast 2025-2030 ($ billion)
Chart on Spain - Year-over-year growth 2025-2030 (%)
Data Table on Spain - Year-over-year growth 2025-2030 (%)

12.3.6 The Netherlands - Market size and forecast 2025-2030

Chart on The Netherlands - Market size and forecast 2025-2030 ($ billion)
Data Table on The Netherlands - Market size and forecast 2025-2030 ($ billion)
Chart on The Netherlands - Year-over-year growth 2025-2030 (%)
Data Table on The Netherlands - Year-over-year growth 2025-2030 (%)

12.4 North America - Market size and forecast 2025-2030

Chart on North America - Market size and forecast 2025-2030 ($ billion)
Data Table on North America - Market size and forecast 2025-2030 ($ billion)
Chart on North America - Year-over-year growth 2025-2030 (%)
Data Table on North America - Year-over-year growth 2025-2030 (%)
Chart on Regional Comparison - North America
Data Table on Regional Comparison - North America

12.4.1 US - Market size and forecast 2025-2030

Chart on US - Market size and forecast 2025-2030 ($ billion)
Data Table on US - Market size and forecast 2025-2030 ($ billion)
Chart on US - Year-over-year growth 2025-2030 (%)
Data Table on US - Year-over-year growth 2025-2030 (%)

12.4.2 Canada - Market size and forecast 2025-2030

Chart on Canada - Market size and forecast 2025-2030 ($ billion)
Data Table on Canada - Market size and forecast 2025-2030 ($ billion)
Chart on Canada - Year-over-year growth 2025-2030 (%)
Data Table on Canada - Year-over-year growth 2025-2030 (%)

12.4.3 Mexico - Market size and forecast 2025-2030

Chart on Mexico - Market size and forecast 2025-2030 ($ billion)
Data Table on Mexico - Market size and forecast 2025-2030 ($ billion)
Chart on Mexico - Year-over-year growth 2025-2030 (%)
Data Table on Mexico - Year-over-year growth 2025-2030 (%)

12.5 APAC - Market size and forecast 2025-2030

Chart on APAC - Market size and forecast 2025-2030 ($ billion)
Data Table on APAC - Market size and forecast 2025-2030 ($ billion)
Chart on APAC - Year-over-year growth 2025-2030 (%)
Data Table on APAC - Year-over-year growth 2025-2030 (%)
Chart on Regional Comparison - APAC
Data Table on Regional Comparison - APAC

12.5.1 China - Market size and forecast 2025-2030

Chart on China - Market size and forecast 2025-2030 ($ billion)
Data Table on China - Market size and forecast 2025-2030 ($ billion)
Chart on China - Year-over-year growth 2025-2030 (%)
Data Table on China - Year-over-year growth 2025-2030 (%)

12.5.2 India - Market size and forecast 2025-2030

Chart on India - Market size and forecast 2025-2030 ($ billion)
Data Table on India - Market size and forecast 2025-2030 ($ billion)
Chart on India - Year-over-year growth 2025-2030 (%)
Data Table on India - Year-over-year growth 2025-2030 (%)

12.5.3 Japan - Market size and forecast 2025-2030

Chart on Japan - Market size and forecast 2025-2030 ($ billion)
Data Table on Japan - Market size and forecast 2025-2030 ($ billion)
Chart on Japan - Year-over-year growth 2025-2030 (%)
Data Table on Japan - Year-over-year growth 2025-2030 (%)

12.5.4 South Korea - Market size and forecast 2025-2030

Chart on South Korea - Market size and forecast 2025-2030 ($ billion)
Data Table on South Korea - Market size and forecast 2025-2030 ($ billion)
Chart on South Korea - Year-over-year growth 2025-2030 (%)
Data Table on South Korea - Year-over-year growth 2025-2030 (%)

12.5.5 Australia - Market size and forecast 2025-2030

Chart on Australia - Market size and forecast 2025-2030 ($ billion)
Data Table on Australia - Market size and forecast 2025-2030 ($ billion)
Chart on Australia - Year-over-year growth 2025-2030 (%)
Data Table on Australia - Year-over-year growth 2025-2030 (%)

12.5.6 Indonesia - Market size and forecast 2025-2030

Chart on Indonesia - Market size and forecast 2025-2030 ($ billion)
Data Table on Indonesia - Market size and forecast 2025-2030 ($ billion)
Chart on Indonesia - Year-over-year growth 2025-2030 (%)
Data Table on Indonesia - Year-over-year growth 2025-2030 (%)

12.6 South America - Market size and forecast 2025-2030

Chart on South America - Market size and forecast 2025-2030 ($ billion)
Data Table on South America - Market size and forecast 2025-2030 ($ billion)
Chart on South America - Year-over-year growth 2025-2030 (%)
Data Table on South America - Year-over-year growth 2025-2030 (%)
Chart on Regional Comparison - South America
Data Table on Regional Comparison - South America

12.6.1 Brazil - Market size and forecast 2025-2030

Chart on Brazil - Market size and forecast 2025-2030 ($ billion)
Data Table on Brazil - Market size and forecast 2025-2030 ($ billion)
Chart on Brazil - Year-over-year growth 2025-2030 (%)
Data Table on Brazil - Year-over-year growth 2025-2030 (%)

12.6.2 Argentina - Market size and forecast 2025-2030

Chart on Argentina - Market size and forecast 2025-2030 ($ billion)
Data Table on Argentina - Market size and forecast 2025-2030 ($ billion)
Chart on Argentina - Year-over-year growth 2025-2030 (%)
Data Table on Argentina - Year-over-year growth 2025-2030 (%)

12.6.3 Colombia - Market size and forecast 2025-2030

Chart on Colombia - Market size and forecast 2025-2030 ($ billion)
Data Table on Colombia - Market size and forecast 2025-2030 ($ billion)
Chart on Colombia - Year-over-year growth 2025-2030 (%)
Data Table on Colombia - Year-over-year growth 2025-2030 (%)

12.7 Middle East and Africa - Market size and forecast 2025-2030

Chart on Middle East and Africa - Market size and forecast 2025-2030 ($ billion)
Data Table on Middle East and Africa - Market size and forecast 2025-2030 ($ billion)
Chart on Middle East and Africa - Year-over-year growth 2025-2030 (%)
Data Table on Middle East and Africa - Year-over-year growth 2025-2030 (%)
Chart on Regional Comparison - Middle East and Africa
Data Table on Regional Comparison - Middle East and Africa

12.7.1 UAE - Market size and forecast 2025-2030

Chart on UAE - Market size and forecast 2025-2030 ($ billion)
Data Table on UAE - Market size and forecast 2025-2030 ($ billion)
Chart on UAE - Year-over-year growth 2025-2030 (%)
Data Table on UAE - Year-over-year growth 2025-2030 (%)

12.7.2 Saudi Arabia - Market size and forecast 2025-2030

Chart on Saudi Arabia - Market size and forecast 2025-2030 ($ billion)
Data Table on Saudi Arabia - Market size and forecast 2025-2030 ($ billion)
Chart on Saudi Arabia - Year-over-year growth 2025-2030 (%)
Data Table on Saudi Arabia - Year-over-year growth 2025-2030 (%)

12.7.3 South Africa - Market size and forecast 2025-2030

Chart on South Africa - Market size and forecast 2025-2030 ($ billion)
Data Table on South Africa - Market size and forecast 2025-2030 ($ billion)
Chart on South Africa - Year-over-year growth 2025-2030 (%)
Data Table on South Africa - Year-over-year growth 2025-2030 (%)

12.7.4 Turkey - Market size and forecast 2025-2030

Chart on Turkey - Market size and forecast 2025-2030 ($ billion)
Data Table on Turkey - Market size and forecast 2025-2030 ($ billion)
Chart on Turkey - Year-over-year growth 2025-2030 (%)
Data Table on Turkey - Year-over-year growth 2025-2030 (%)

12.7.5 Israel - Market size and forecast 2025-2030

Chart on Israel - Market size and forecast 2025-2030 ($ billion)
Data Table on Israel - Market size and forecast 2025-2030 ($ billion)
Chart on Israel - Year-over-year growth 2025-2030 (%)
Data Table on Israel - Year-over-year growth 2025-2030 (%)

12.8 Market opportunity by geography

Market opportunity by geography ($ billion)
Data Tables on Market opportunity by geography ($ billion)

13. Drivers, Challenges, and Opportunity

13.1 Market drivers

Increasing government investments in infrastructure and tourism promotion
Integration of advanced technologies in event experiences
Rising disposable income and desire for experiential travel

13.2 Market challenges

Stringent environmental regulations and sustainability mandates
Geopolitical instability and security concerns
High infrastructure costs and resource allocation burdens

13.3 Impact of drivers and challenges

Impact of drivers and challenges in 2025 and 2030

13.4 Market opportunities

Rise of eco-tourism and sustainable mega-events
Emergence of hyper-localized and cultural immersion festivals
Expansion of wellness and health-centric event tourism

14. Competitive Landscape

14.1 Overview

14.2

Overview on criticality of inputs and factors of differentiation

14.3 Landscape disruption

Overview on factors of disruption

14.4 Industry risks

Impact of key risks on business

15. Competitive Analysis

15.1 Companies profiled

Companies covered

15.2 Company ranking index

15.3 Market positioning of companies

Matrix on companies position and classification

15.4 AEG Worldwide

AEG Worldwide - Overview
AEG Worldwide - Product / Service
AEG Worldwide - Key offerings
SWOT

15.5 ATPI Group

ATPI Group - Overview
ATPI Group - Product / Service
ATPI Group - Key offerings
SWOT

15.6 BCD Meetings and Events

BCD Meetings and Events - Overview
BCD Meetings and Events - Product / Service
BCD Meetings and Events - Key offerings
SWOT

15.7 Cvent Inc

Cvent Inc - Overview
Cvent Inc - Product / Service
Cvent Inc - Key offerings
SWOT

15.8 CWT

CWT - Overview
CWT - Product / Service
CWT - Key offerings
SWOT

15.9 Emerald X LLC

Emerald X LLC - Overview
Emerald X LLC - Business segments
Emerald X LLC - Key offerings
Emerald X LLC - Segment focus
SWOT

15.10 Eventbrite Inc.

Eventbrite Inc. - Overview
Eventbrite Inc. - Product / Service
Eventbrite Inc. - Key offerings
SWOT

15.11 FCM Travel Solutions

FCM Travel Solutions - Overview
FCM Travel Solutions - Product / Service
FCM Travel Solutions - Key offerings
SWOT

15.12 George P. Johnson

George P. Johnson - Overview
George P. Johnson - Product / Service
George P. Johnson - Key offerings
SWOT

15.13 Global Business Travel Group

Global Business Travel Group - Overview
Global Business Travel Group - Business segments
Global Business Travel Group - Key offerings
Global Business Travel Group - Segment focus
SWOT

15.14 Informa PLC

Informa PLC - Overview
Informa PLC - Business segments
Informa PLC - Key offerings
Informa PLC - Segment focus
SWOT

15.15 Live Nation Entertainment Inc.

Live Nation Entertainment Inc. - Overview
Live Nation Entertainment Inc. - Business segments
Live Nation Entertainment Inc. - Key offerings
Live Nation Entertainment Inc. - Segment focus
SWOT

15.16 Maritz Holdings Inc.

Maritz Holdings Inc. - Overview
Maritz Holdings Inc. - Product / Service
Maritz Holdings Inc. - Key offerings
SWOT

15.17 Messe Frankfurt GmbH

Messe Frankfurt GmbH - Overview
Messe Frankfurt GmbH - Product / Service
Messe Frankfurt GmbH - Key offerings
SWOT

15.18 Reed Exhibitions Ltd.

Reed Exhibitions Ltd. - Overview
Reed Exhibitions Ltd. - Product / Service
Reed Exhibitions Ltd. - Key offerings
SWOT

16. Appendix

16.1 Scope of the report

Market definition
Objectives
Notes and caveats

16.2 Inclusions and exclusions checklist

Inclusions checklist
Exclusions checklist

16.3 Currency conversion rates for US$

16.4 Research methodology

16.5 Data procurement

Information sources

16.6 Data validation

16.7 Validation techniques employed for market sizing

16.8 Data synthesis

16.9 360 degree market analysis

16.10 List of abbreviations

Research Methodology

Technavio presents a detailed picture of the market by way of study, synthesis, and summation of data from multiple sources. The analysts have presented the various facets of the market with a particular focus on identifying the key industry influencers. The data thus presented is comprehensive, reliable, and the result of extensive research, both primary and secondary.

INFORMATION SOURCES

Primary sources

  • Manufacturers and suppliers
  • Channel partners
  • Industry experts
  • Strategic decision makers

Secondary sources

  • Industry journals and periodicals
  • Government data
  • Financial reports of key industry players
  • Historical data
  • Press releases

DATA ANALYSIS

Data Synthesis

  • Collation of data
  • Estimation of key figures
  • Analysis of derived insights

Data Validation

  • Triangulation with data models
  • Reference against proprietary databases
  • Corroboration with industry experts

REPORT WRITING

Qualitative

  • Market drivers
  • Market challenges
  • Market trends
  • Five forces analysis

Quantitative

  • Market size and forecast
  • Market segmentation
  • Geographical insights
  • Competitive landscape

Interested in this report?

Get your sample now to see our research methodology and insights!

Download Now

Frequently Asked Questions

Event Tourism market growth will increase by USD 918.6 billion during 2026-2030.

The Event Tourism market is expected to grow at a CAGR of 7.1% during 2026-2030.

Event Tourism market is segmented by Type (Sports tourism, Music tourism, Business tourism, Exhibitions tourism, Others) Location (Domestic, International) Channel (Physical, Virtual)

AEG Worldwide, ATPI Group, BCD Meetings and Events, Clarion Events Ltd., Creative Group Inc., Cvent Inc, CWT, Emerald X LLC, Eventbrite Inc., FCM Travel Solutions, George P. Johnson, Global Business Travel Group, Informa PLC, ITA Group, Live Nation Entertainment Inc., Maritz Holdings Inc., Messe Frankfurt GmbH, Reed Exhibitions Ltd., StubHub Holdings Inc. are a few of the key vendors in the Event Tourism market.

Europe will register the highest growth rate of 30.4% among the other regions. Therefore, the Event Tourism market in Europe is expected to garner significant business opportunities for the vendors during the forecast period.

UK, Germany, France, Italy, Spain, The Netherlands, US, Canada, Mexico, China, India, Japan, South Korea, Australia, Indonesia, Brazil, Argentina, Colombia, UAE, Saudi Arabia, South Africa, Turkey, Israel

  • Increasing government investments in infrastructure and tourism promotion is the driving factor this market.

The Event Tourism market vendors should focus on grabbing business opportunities from the Type segment as it accounted for the largest market share in the base year.
RIA - Research AI Assistant
Ask RIA