Face Masks And Peels Market Analysis APAC, North America, Europe, Middle East and Africa, South America - China, Japan, South Korea, India, Taiwan, US, Canada, France, UK, Germany - Size and Forecast 2024-2028

Face Masks And Peels Market Analysis APAC, North America, Europe, Middle East and Africa, South America - China, Japan, South Korea, India, Taiwan, US, Canada, France, UK, Germany - Size and Forecast 2024-2028

Published: Dec 2024 187 Pages SKU: IRTNTR72968

Market Overview at a Glance

$6.60 B
Market Opportunity
5.9%
CAGR
5.8
YoY growth 2023-2024(%)

Face Masks And Peels Market Size and Trends

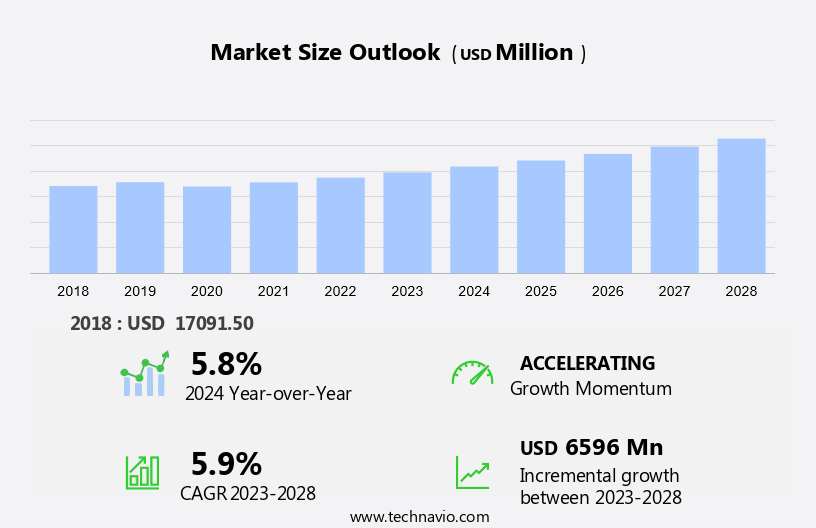
The face masks and peels market size is forecast to increase by USD 6.6 billion, at a CAGR of 5.9% between 2023 and 2028. The market is experiencing significant growth due to the increasing awareness of personal care and skincare. Consumers are seeking cosmetic benefits from these products, including moisturizing, anti-aging, treating acne, and blemishes. Product innovation and line extensions have led to premiumization in the market. Additionally, there is a rising demand for natural and organic options, as consumers prefer functional ingredients that align with their health-conscious lifestyles. Retail chains and e-commerce platforms are capitalizing on this trend, making it easier for consumers to access these products. The popularity of at-home treatments, such as homemade solutions, is also driving demand at lower costs.

Face Masks And Peels Market Size

 Request Free Sample

The market is witnessing significant growth due to the increasing demand for health-conscious and natural self-care products. This market encompasses a wide range of offerings, including peel-off masks, sheet masks, and other forms of facial treatments. Consumer preferences are shifting towards natural and organic claims in their skincare products. This trend is driving the market, as many offerings now include natural ingredients such as activated charcoal and fruit serums. Fast-moving consumer goods (FMCG) companies are responding to this demand by launching new product lines and marketing campaigns that focuses on the natural and organic aspects of their face masks and peels. Anti-aging formulas are also a significant driver of growth in the market. Consumers are seeking effective solutions to address skin imperfections, such as blackheads, excess oil, and fine lines. These products offer a convenient and affordable way for individuals to incorporate anti-aging treatments into their daily skincare routine. Social media promotion plays a crucial role in the marketing of face masks and peels. Influencers and celebrities often endorse these products, reaching large audiences and generating buzz around new releases.

Brands are also utilizing social media platforms to engage with consumers, providing educational content and tips for using their products effectively. The market caters to various skin types and skincare issues. Sheet masks, for example, are often tailored to specific concerns, such as hydration, unclogging pores, or reducing excess oil. Consumers can choose from a wide range of offerings to address their unique skincare needs. In conclusion, the market is experiencing steady growth due to the increasing demand for health-conscious and natural self-care products. Consumers are seeking effective solutions for addressing various skincare concerns, and companies are responding with innovative offerings and marketing campaigns. This trend is expected to continue as consumers prioritize their self-care routines and seek convenient and affordable solutions for maintaining healthy, beautiful skin.

Market Segmentation

The market research report provides comprehensive data (region-wise segment analysis), with forecasts and estimates in "USD billion" for the period 2024-2028, as well as historical data from 2018 - 2022 for the following segments.

  • Product
    • Face masks
    • Peels
  • Distribution Channel
    • Offline
    • Online
  • Geography
    • APAC
      • China
      • India
      • Japan
      • South Korea
    • North America
      • Canada
      • US
    • Europe
      • Germany
      • UK
      • France
    • Middle East and Africa
    • South America

By Product Insights

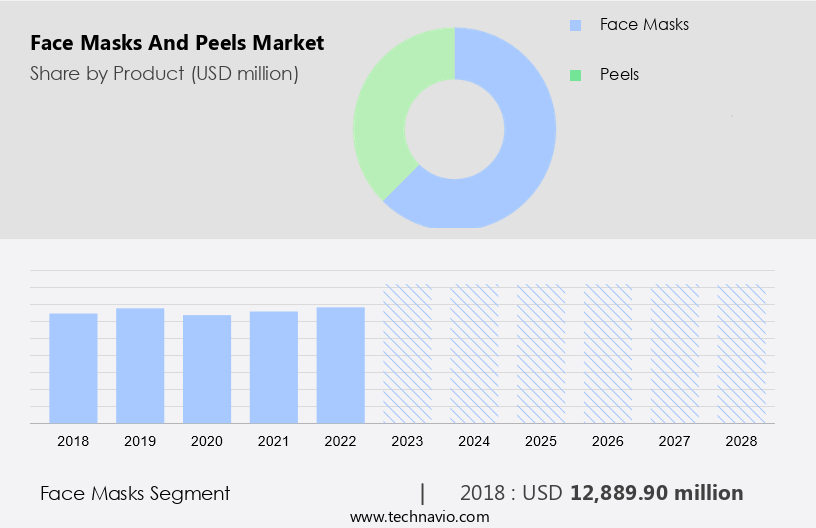
The face masks segment is estimated to witness significant growth during the forecast period. Face masks have gained significant popularity in the skincare and facial care industry due to their ability to address various skin concerns. For example, individuals with dehydrated or dry skin can benefit from hydrating masks, while those experiencing redness on their facial skin can find relief with calming masks. These masks are typically left on the skin for 10 to 15 minutes and incorporate ingredients such as black moor mud, clay, aloe vera, seaweed, algae, massage oils, herbs, essential oils, and vitamins. As consumers become more conscious of organic and natural skincare products, there is a growing trend towards face masks with natural ingredients.

Face Masks And Peels Market Size

Get a glance at the market share of various segments Download the PDF Sample

The face masks segment was valued at USD 12.89 billion in 2018. Chemical peel-off masks, a subcategory of face masks, have also gained traction due to their active compounds that exfoliate and brighten the skin. Fruit serums are another emerging trend in the market, offering a natural and gentle alternative to traditional face masks. Social media promotion plays a crucial role in driving sales, with influencers and beauty bloggers showcasing their favorite masks and sharing their experiences. In conclusion, the market continues to evolve, with a focus on natural ingredients, innovative formulations, and effective delivery systems. Brands are investing in research and development to cater to diverse skin concerns and preferences, ensuring that consumers have access to a wide range of options to enhance their facial care routine.

Regional Analysis

Face Masks And Peels Market Share by Geography

For more insights on the market share of various regions Download PDF Sample now!

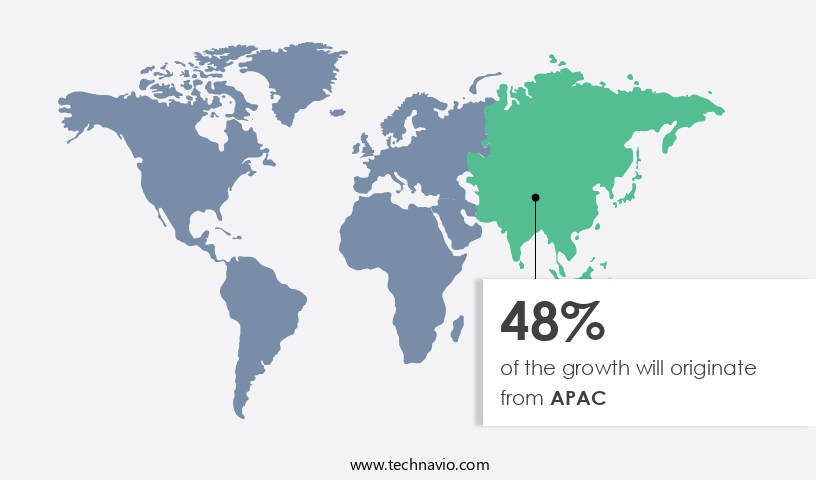
APAC is estimated to contribute 48% to the growth of the global market during the forecast period. Technavio's analysts have elaborately explained the regional trends and drivers that shape the market during the forecast period. The market in APAC is experiencing significant growth due to the increasing demand for skin care products. The region's high demand for skin whitening masks and peels, as well as anti-aging facial skincare, is driving market expansion. Personal hygiene and wellness concerns are fueling the demand for facial skincare products, including masks and peels, in APAC. Additionally, the rise in the number of beauty salons in the region has boosted the demand for professional face masks and peels. Another significant factor is the expanding middle-income population base, with many consumers seeking multifunctional facial skincare solutions. Organic and sustainable products, such as those containing Aloe Vera, Honey, and Plant Extracts, are gaining popularity in the market. However, the use of non-biodegradable packaging for single-use masks poses recycling challenges. To address this issue, there is a growing trend towards the use of Biodegradable and Sustainable Packaging. Cosmetic facial masks and peels manufacturers are responding to consumer concerns by adopting eco-friendly practices.

Our researchers analyzed the data with 2023 as the base year, along with the key drivers, trends, and challenges. A holistic analysis of drivers will help companies refine their marketing strategies to gain a competitive advantage.

Face Masks And Peels Market Driver

Product innovation and product line extension leading to product premiumization is notably driving market growth. In today's consumer-driven market, there is a growing consciousness towards skincare routines and the desire for effective solutions to address various skin concerns. The significance of the internet in disseminating cosmetology knowledge has led to an increase in demand for innovative facial skincare products. As a result, manufacturers are focusing on introducing new offerings, such as face masks and peels, to cater to this demand.

The importance of natural, instant skincare solutions is increasingly evident, with active plant components, creams, clays, and peel-offs gaining popularity. The impact of pollution levels on skin health has further fueled the demand for these products. With a rise in disposable income and the preference for premium skincare products, the market for face masks and peels is poised for growth. Manufacturers are responding to these trends by expanding their product lines to meet evolving customer needs. Thus, such factors are driving the growth of the market during the forecast period.

Face Masks And Peels Market Trends

Increase in demand for organic and natural masks and peels is the key trend in the market. The market for hydrating sheet masks and LED skincare wands has experienced significant growth due to the increasing preference for organic and natural skincare solutions. Consumers are increasingly conscious of their health and seek products to address various skin concerns, such as irritations, allergies, dark marks, pigmentation, and acne.

Natural masks and peels, free from petrochemicals, sulfates, and parabens, have gained popularity. These products derive their ingredients from plant extracts, natural oils, and other organic sources. Key ingredients, such as sunflower oil, jojoba oil, aloe vera, turmeric, and olive oil, are commonly used. Thus, such trends will shape the growth of the market during the forecast period.

Face Masks And Peels Market Challenge

Homemade solutions at lower cost is the major challenge that affects the growth of the market. The market is witnessing significant growth due to the increasing trend of natural skincare and the cosmetic benefits they offer. Homemade face mask solutions have gained popularity among price-conscious consumers, as they can be easily prepared using functional ingredients readily available at retail chains and ecommerce platforms. The rise of the digital era has fueled the spread of knowledge and awareness about DIY face masks, making them a preferred choice for many. Moreover, the anti-aging properties and ability to treat acne and blemishes add to the appeal of face masks and peels. The DIY trend among millennials, who are always on the lookout for innovative skincare methods, has further boosted the market.

The safety and convenience of using these treatments at home have also contributed to their increasing usage. The US personal care industry continues to evolve, with an increasing focus on natural and organic products. The use of face masks and peels as part of a skincare routine is a testament to this trend. With the availability of various DIY recipes and tutorials online, consumers can experiment with different ingredients and find what works best for their skin type. The future of the market looks promising, as more and more consumers turn to natural and cost-effective solutions for their skincare needs. Hence, the above factors will impede the growth of the market during the forecast period.

Exclusive Customer Landscape

The market forecasting report includes the adoption lifecycle of the market, covering from the innovator's stage to the laggard's stage. It focuses on adoption rates in different regions based on penetration. Furthermore, the report also includes key purchase criteria and drivers of price sensitivity to help companies evaluate and develop their market growth analysis strategies.

Face Masks And Peels Market Share by Geography

 Customer Landscape

Key Companies & Market Insights

Companies are implementing various strategies, such as strategic alliances, partnerships, mergers and acquisitions, geographical expansion, and product/service launches, to enhance their presence in the market.

Amerimark Direct LLC - The company offers face masks and peels that is specially formulated to visibly firm, moisturize and reduce the look of wrinkles and signs of aging, under the brand name of Beauty Boutique

The market research and growth report also includes detailed analyses of the competitive landscape of the market and information about key companies, including:

  • Beiersdorf AG
  • Boots UK Ltd.
  • Clarins Pte Ltd.
  • Eminence Organic Skin Care
  • Himalaya Global Holdings Ltd.
  • LOreal SA
  • Marico Ltd.
  • Natura and Co Holding SA
  • O3plus
  • Shiseido Co. Ltd.
  • The Estee Lauder Companies
  • Unilever PLC
  • Zed Lifestyle Pvt. Ltd.
  • Zydus Wellness Ltd.

Qualitative and quantitative analysis of companies has been conducted to help clients understand the wider business environment as well as the strengths and weaknesses of key market players. Data is qualitatively analyzed to categorize companies as pure play, category-focused, industry-focused, and diversified; it is quantitatively analyzed to categorize companies as dominant, leading, strong, tentative, and weak.

The market has witnessed a significant rise in the demand for peel-off face masks as part of health-conscious consumers' self-care routines. These masks, often made from natural and organic claims, are popular fast-moving consumer goods (FMCG) in the skincare and facial care market. Anti-aging formulas, activated charcoal, and chemical peel-off masks are among the active compounds that impact the skin positively. Skincare brands have employed marketing campaigns, celebrity endorsements, and social media promotion to reach consumers. Self-hygiene products like face masks cater to various skincare issues, including unclogging pores, reducing excess oil, and treating skin imperfections.

Skin type and skincare issues influence the choice of masks, with options ranging from clay masks to hydrating sheet masks and K-beauty's single-use plastic-free alternatives. Consumer consciousness regarding sustainable products and packaging has led to the emergence of biodegradable and recyclable options, addressing challenges related to non-biodegradable packaging and recycling. Overall, the market for cosmetic facial masks continues to evolve, with functional ingredients, LED skincare wands, and e-commerce platforms playing essential roles in the industry's growth.

Market Scope

Report Coverage

Details

Page number

187

Base year

2023

Historic period

2018 - 2022

Forecast period

2024-2028

Growth momentum & CAGR

Accelerate at a CAGR of 5.9%

Market Growth 2024-2028

USD 6.6 bllion

Market structure

Fragmented

YoY growth 2023-2024(%)

5.8

Regional analysis

APAC, North America, Europe, Middle East and Africa, and South America

Performing market contribution

APAC at 48%

Key countries

China, Japan, South Korea, India, Taiwan, US, Canada, France, UK, and Germany

Competitive landscape

Leading Companies, Market Positioning of Companies, Competitive Strategies, and Industry Risks

Key companies profiled

Amerimark Direct LLC, Beiersdorf AG, Boots UK Ltd., Clarins Pte Ltd., Eminence Organic Skin Care, Himalaya Global Holdings Ltd., LOreal SA, Marico Ltd., Natura and Co Holding SA, O3plus, Shiseido Co. Ltd., The Estee Lauder Companies, Unilever PLC, Zed Lifestyle Pvt. Ltd., and Zydus Wellness Ltd.

Market dynamics

Parent market analysis, Market growth inducers and obstacles, Fast-growing and slow-growing segment analysis, Market growth and Forecasting, COVID-19 impact and recovery analysis and future consumer dynamics, Market condition analysis for market forecast period.

Customization purview

If our market report has not included the data that you are looking for, you can reach out to our analysts and get segments customized.

Download PDF Sample

What are the Key Data Covered in this Market Research Report?

  • CAGR of the market during the forecast period
  • Detailed information on factors that will drive the market growth and forecasting between 2024 and 2028
  • Precise estimation of the size of the market  and its contribution of the market in focus to the parent market
  • Accurate predictions about upcoming market growth and trends and changes in consumer behaviour
  • Growth of the market across APAC, North America, Europe, Middle East and Africa, and South America
  • Thorough analysis of the market's competitive landscape and detailed information about companies
  • Comprehensive analysis of factors that will challenge the growth of market companies

We can help! Our analysts can customize this market research report to meet your requirements. Get in touch

1 Executive Summary

  • 1.1 Market overview
    • Executive Summary - Chart on Market Overview
    • Executive Summary - Data Table on Market Overview
    • Executive Summary - Chart on Global Market Characteristics
    • Executive Summary - Chart on Market by Geography
    • Executive Summary - Chart on Market Segmentation by Product
    • Executive Summary - Chart on Market Segmentation by Distribution Channel
    • Executive Summary - Chart on Incremental Growth
    • Executive Summary - Data Table on Incremental Growth
    • Executive Summary - Chart on Company Market Positioning

2 Technavio Analysis

  • 2.1 Analysis of price sensitivity, lifecycle, customer purchase basket, adoption rates, and purchase criteria
    • Analysis of price sensitivity, lifecycle, customer purchase basket, adoption rates, and purchase criteria
  • 2.2 Criticality of inputs and Factors of differentiation
    • Overview on criticality of inputs and factors of differentiation
  • 2.3 Factors of disruption
    • Overview on factors of disruption
  • 2.4 Impact of drivers and challenges
    • Impact of drivers and challenges in 2023 and 2028

3 Market Landscape

  • 3.1 Market ecosystem
    • Parent Market
    • Data Table on - Parent Market
  • 3.2 Market characteristics
    • Market characteristics analysis
  • 3.3 Value chain analysis
    • Value chain analysis

4 Market Sizing

  • 4.1 Market definition
    • Offerings of companies included in the market definition
  • 4.2 Market segment analysis
    • Market segments
  • 4.3 Market size 2023
    • 4.4 Market outlook: Forecast for 2023-2028
      • Chart on Global - Market size and forecast 2023-2028 ($ million)
      • Data Table on Global - Market size and forecast 2023-2028 ($ million)
      • Chart on Global Market: Year-over-year growth 2023-2028 (%)
      • Data Table on Global Market: Year-over-year growth 2023-2028 (%)

    5 Historic Market Size

    • 5.1 Global Face Masks And Peels Market 2018 - 2022
      • Historic Market Size - Data Table on Global Face Masks And Peels Market 2018 - 2022 ($ million)
    • 5.2 Product segment analysis 2018 - 2022
      • Historic Market Size - Product Segment 2018 - 2022 ($ million)
    • 5.3 Distribution Channel segment analysis 2018 - 2022
      • Historic Market Size - Distribution Channel Segment 2018 - 2022 ($ million)
    • 5.4 Geography segment analysis 2018 - 2022
      • Historic Market Size - Geography Segment 2018 - 2022 ($ million)
    • 5.5 Country segment analysis 2018 - 2022
      • Historic Market Size - Country Segment 2018 - 2022 ($ million)

    6 Qualitative Analysis

    • 6.1 Impact of AI in the Global Face Masks and Peels Market

      7 Five Forces Analysis

      • 7.1 Five forces summary
        • Five forces analysis - Comparison between 2023 and 2028
      • 7.2 Bargaining power of buyers
        • Bargaining power of buyers - Impact of key factors 2023 and 2028
      • 7.3 Bargaining power of suppliers
        • Bargaining power of suppliers - Impact of key factors in 2023 and 2028
      • 7.4 Threat of new entrants
        • Threat of new entrants - Impact of key factors in 2023 and 2028
      • 7.5 Threat of substitutes
        • Threat of substitutes - Impact of key factors in 2023 and 2028
      • 7.6 Threat of rivalry
        • Threat of rivalry - Impact of key factors in 2023 and 2028
      • 7.7 Market condition
        • Chart on Market condition - Five forces 2023 and 2028

      8 Market Segmentation by Product

      • 8.1 Market segments
        • Chart on Product - Market share 2023-2028 (%)
        • Data Table on Product - Market share 2023-2028 (%)
      • 8.2 Comparison by Product
        • Chart on Comparison by Product
        • Data Table on Comparison by Product
      • 8.3 Face masks - Market size and forecast 2023-2028
        • Chart on Face masks - Market size and forecast 2023-2028 ($ million)
        • Data Table on Face masks - Market size and forecast 2023-2028 ($ million)
        • Chart on Face masks - Year-over-year growth 2023-2028 (%)
        • Data Table on Face masks - Year-over-year growth 2023-2028 (%)
      • 8.4 Peels - Market size and forecast 2023-2028
        • Chart on Peels - Market size and forecast 2023-2028 ($ million)
        • Data Table on Peels - Market size and forecast 2023-2028 ($ million)
        • Chart on Peels - Year-over-year growth 2023-2028 (%)
        • Data Table on Peels - Year-over-year growth 2023-2028 (%)
      • 8.5 Market opportunity by Product
        • Market opportunity by Product ($ million)
        • Data Table on Market opportunity by Product ($ million)

      9 Market Segmentation by Distribution Channel

      • 9.1 Market segments
        • Chart on Distribution Channel - Market share 2023-2028 (%)
        • Data Table on Distribution Channel - Market share 2023-2028 (%)
      • 9.2 Comparison by Distribution Channel
        • Chart on Comparison by Distribution Channel
        • Data Table on Comparison by Distribution Channel
      • 9.3 Offline - Market size and forecast 2023-2028
        • Chart on Offline - Market size and forecast 2023-2028 ($ million)
        • Data Table on Offline - Market size and forecast 2023-2028 ($ million)
        • Chart on Offline - Year-over-year growth 2023-2028 (%)
        • Data Table on Offline - Year-over-year growth 2023-2028 (%)
      • 9.4 Online - Market size and forecast 2023-2028
        • Chart on Online - Market size and forecast 2023-2028 ($ million)
        • Data Table on Online - Market size and forecast 2023-2028 ($ million)
        • Chart on Online - Year-over-year growth 2023-2028 (%)
        • Data Table on Online - Year-over-year growth 2023-2028 (%)
      • 9.5 Market opportunity by Distribution Channel
        • Market opportunity by Distribution Channel ($ million)
        • Data Table on Market opportunity by Distribution Channel ($ million)

      10 Customer Landscape

      • 10.1 Customer landscape overview
        • Analysis of price sensitivity, lifecycle, customer purchase basket, adoption rates, and purchase criteria

      11 Geographic Landscape

      • 11.1 Geographic segmentation
        • Chart on Market share by geography 2023-2028 (%)
        • Data Table on Market share by geography 2023-2028 (%)
      • 11.2 Geographic comparison
        • Chart on Geographic comparison
        • Data Table on Geographic comparison
      • 11.3 APAC - Market size and forecast 2023-2028
        • Chart on APAC - Market size and forecast 2023-2028 ($ million)
        • Data Table on APAC - Market size and forecast 2023-2028 ($ million)
        • Chart on APAC - Year-over-year growth 2023-2028 (%)
        • Data Table on APAC - Year-over-year growth 2023-2028 (%)
      • 11.4 North America - Market size and forecast 2023-2028
        • Chart on North America - Market size and forecast 2023-2028 ($ million)
        • Data Table on North America - Market size and forecast 2023-2028 ($ million)
        • Chart on North America - Year-over-year growth 2023-2028 (%)
        • Data Table on North America - Year-over-year growth 2023-2028 (%)
      • 11.5 Europe - Market size and forecast 2023-2028
        • Chart on Europe - Market size and forecast 2023-2028 ($ million)
        • Data Table on Europe - Market size and forecast 2023-2028 ($ million)
        • Chart on Europe - Year-over-year growth 2023-2028 (%)
        • Data Table on Europe - Year-over-year growth 2023-2028 (%)
      • 11.6 Middle East and Africa - Market size and forecast 2023-2028
        • Chart on Middle East and Africa - Market size and forecast 2023-2028 ($ million)
        • Data Table on Middle East and Africa - Market size and forecast 2023-2028 ($ million)
        • Chart on Middle East and Africa - Year-over-year growth 2023-2028 (%)
        • Data Table on Middle East and Africa - Year-over-year growth 2023-2028 (%)
      • 11.7 South America - Market size and forecast 2023-2028
        • Chart on South America - Market size and forecast 2023-2028 ($ million)
        • Data Table on South America - Market size and forecast 2023-2028 ($ million)
        • Chart on South America - Year-over-year growth 2023-2028 (%)
        • Data Table on South America - Year-over-year growth 2023-2028 (%)
      • 11.8 China - Market size and forecast 2023-2028
        • Chart on China - Market size and forecast 2023-2028 ($ million)
        • Data Table on China - Market size and forecast 2023-2028 ($ million)
        • Chart on China - Year-over-year growth 2023-2028 (%)
        • Data Table on China - Year-over-year growth 2023-2028 (%)
      • 11.9 Japan - Market size and forecast 2023-2028
        • Chart on Japan - Market size and forecast 2023-2028 ($ million)
        • Data Table on Japan - Market size and forecast 2023-2028 ($ million)
        • Chart on Japan - Year-over-year growth 2023-2028 (%)
        • Data Table on Japan - Year-over-year growth 2023-2028 (%)
      • 11.10 South Korea - Market size and forecast 2023-2028
        • Chart on South Korea - Market size and forecast 2023-2028 ($ million)
        • Data Table on South Korea - Market size and forecast 2023-2028 ($ million)
        • Chart on South Korea - Year-over-year growth 2023-2028 (%)
        • Data Table on South Korea - Year-over-year growth 2023-2028 (%)
      • 11.11 India - Market size and forecast 2023-2028
        • Chart on India - Market size and forecast 2023-2028 ($ million)
        • Data Table on India - Market size and forecast 2023-2028 ($ million)
        • Chart on India - Year-over-year growth 2023-2028 (%)
        • Data Table on India - Year-over-year growth 2023-2028 (%)
      • 11.12 Taiwan - Market size and forecast 2023-2028
        • Chart on Taiwan - Market size and forecast 2023-2028 ($ million)
        • Data Table on Taiwan - Market size and forecast 2023-2028 ($ million)
        • Chart on Taiwan - Year-over-year growth 2023-2028 (%)
        • Data Table on Taiwan - Year-over-year growth 2023-2028 (%)
      • 11.13 US - Market size and forecast 2023-2028
        • Chart on US - Market size and forecast 2023-2028 ($ million)
        • Data Table on US - Market size and forecast 2023-2028 ($ million)
        • Chart on US - Year-over-year growth 2023-2028 (%)
        • Data Table on US - Year-over-year growth 2023-2028 (%)
      • 11.14 Canada - Market size and forecast 2023-2028
        • Chart on Canada - Market size and forecast 2023-2028 ($ million)
        • Data Table on Canada - Market size and forecast 2023-2028 ($ million)
        • Chart on Canada - Year-over-year growth 2023-2028 (%)
        • Data Table on Canada - Year-over-year growth 2023-2028 (%)
      • 11.15 France - Market size and forecast 2023-2028
        • Chart on France - Market size and forecast 2023-2028 ($ million)
        • Data Table on France - Market size and forecast 2023-2028 ($ million)
        • Chart on France - Year-over-year growth 2023-2028 (%)
        • Data Table on France - Year-over-year growth 2023-2028 (%)
      • 11.16 UK - Market size and forecast 2023-2028
        • Chart on UK - Market size and forecast 2023-2028 ($ million)
        • Data Table on UK - Market size and forecast 2023-2028 ($ million)
        • Chart on UK - Year-over-year growth 2023-2028 (%)
        • Data Table on UK - Year-over-year growth 2023-2028 (%)
      • 11.17 Germany - Market size and forecast 2023-2028
        • Chart on Germany - Market size and forecast 2023-2028 ($ million)
        • Data Table on Germany - Market size and forecast 2023-2028 ($ million)
        • Chart on Germany - Year-over-year growth 2023-2028 (%)
        • Data Table on Germany - Year-over-year growth 2023-2028 (%)
      • 11.18 Market opportunity by geography
        • Market opportunity by geography ($ million)
        • Data Tables on Market opportunity by geography ($ million)

      12 Drivers, Challenges, and Opportunity/Restraints

      • 12.1 Market drivers
        • 12.2 Market challenges
          • 12.3 Impact of drivers and challenges
            • Impact of drivers and challenges in 2023 and 2028
          • 12.4 Market opportunities/restraints

            13 Competitive Landscape

            • 13.1 Overview
              • 13.2 Competitive Landscape
                • Overview on criticality of inputs and factors of differentiation
              • 13.3 Landscape disruption
                • Overview on factors of disruption
              • 13.4 Industry risks
                • Impact of key risks on business

              14 Competitive Analysis

              • 14.1 Companies profiled
                • Companies covered
              • 14.2 Company ranking index
                • Company ranking index
              • 14.3 Market positioning of companies
                • Matrix on companies position and classification
              • 14.4 Amerimark Direct LLC
                • Amerimark Direct LLC - Overview
                • Amerimark Direct LLC - Product / Service
                • Amerimark Direct LLC - Key offerings
                • SWOT
              • 14.5 Beiersdorf AG
                • Beiersdorf AG - Overview
                • Beiersdorf AG - Business segments
                • Beiersdorf AG - Key news
                • Beiersdorf AG - Key offerings
                • Beiersdorf AG - Segment focus
                • SWOT
              • 14.6 Boots UK Ltd.
                • Boots UK Ltd. - Overview
                • Boots UK Ltd. - Product / Service
                • Boots UK Ltd. - Key offerings
                • SWOT
              • 14.7 Clarins Pte Ltd.
                • Clarins Pte Ltd. - Overview
                • Clarins Pte Ltd. - Product / Service
                • Clarins Pte Ltd. - Key offerings
                • SWOT
              • 14.8 LOreal SA
                • LOreal SA - Overview
                • LOreal SA - Business segments
                • LOreal SA - Key news
                • LOreal SA - Key offerings
                • LOreal SA - Segment focus
                • SWOT
              • 14.9 O3plus
                • O3plus - Overview
                • O3plus - Product / Service
                • O3plus - Key offerings
                • SWOT
              • 14.10 Shiseido Co. Ltd.
                • Shiseido Co. Ltd. - Overview
                • Shiseido Co. Ltd. - Product / Service
                • Shiseido Co. Ltd. - Key news
                • Shiseido Co. Ltd. - Key offerings
                • SWOT
              • 14.11 The Estee Lauder Companies
                • The Estee Lauder Companies - Overview
                • The Estee Lauder Companies - Product / Service
                • The Estee Lauder Companies - Key offerings
                • SWOT
              • 14.12 Unilever PLC
                • Unilever PLC - Overview
                • Unilever PLC - Business segments
                • Unilever PLC - Key offerings
                • Unilever PLC - Segment focus
                • SWOT
              • 14.13 Zed Lifestyle Pvt. Ltd.
                • Zed Lifestyle Pvt. Ltd. - Overview
                • Zed Lifestyle Pvt. Ltd. - Product / Service
                • Zed Lifestyle Pvt. Ltd. - Key offerings
                • SWOT

              15 Appendix

              • 15.1 Scope of the report
                • 15.2 Inclusions and exclusions checklist
                  • Inclusions checklist
                  • Exclusions checklist
                • 15.3 Currency conversion rates for US$
                  • Currency conversion rates for US$
                • 15.4 Research methodology
                  • Research methodology
                • 15.5 Data procurement
                  • Information sources
                • 15.6 Data validation
                  • Data validation
                • 15.7 Validation techniques employed for market sizing
                  • Validation techniques employed for market sizing
                • 15.8 Data synthesis
                  • Data synthesis
                • 15.9 360 degree market analysis
                  • 360 degree market analysis
                • 15.10 List of abbreviations
                  • List of abbreviations

                Research Methodology

                Technavio presents a detailed picture of the market by way of study, synthesis, and summation of data from multiple sources. The analysts have presented the various facets of the market with a particular focus on identifying the key industry influencers. The data thus presented is comprehensive, reliable, and the result of extensive research, both primary and secondary.

                INFORMATION SOURCES

                Primary sources

                • Manufacturers and suppliers
                • Channel partners
                • Industry experts
                • Strategic decision makers

                Secondary sources

                • Industry journals and periodicals
                • Government data
                • Financial reports of key industry players
                • Historical data
                • Press releases

                DATA ANALYSIS

                Data Synthesis

                • Collation of data
                • Estimation of key figures
                • Analysis of derived insights

                Data Validation

                • Triangulation with data models
                • Reference against proprietary databases
                • Corroboration with industry experts

                REPORT WRITING

                Qualitative

                • Market drivers
                • Market challenges
                • Market trends
                • Five forces analysis

                Quantitative

                • Market size and forecast
                • Market segmentation
                • Geographical insights
                • Competitive landscape

                Interested in this report?

                Get your sample now to see our research methodology and insights!

                Download Now

                Frequently Asked Questions

                Face Masks And Peels market growth will increase by $ 6596 mn during 2024-2028.

                The Face Masks And Peels market is expected to grow at a CAGR of 5.9% during 2024-2028.

                Face Masks And Peels market is segmented by Product( Face masks, Peels) Distribution Channel( Offline, Online)

                Amerimark Direct LLC, Beiersdorf AG, Boots UK Ltd., Clarins Pte Ltd., Eminence Organic Skin Care, Himalaya Global Holdings Ltd., LOreal SA, Marico Ltd., Natura and Co Holding SA, O3plus, Shiseido Co. Ltd., The Estee Lauder Companies, Unilever PLC, Zed Lifestyle Pvt. Ltd., Zydus Wellness Ltd. are a few of the key vendors in the Face Masks And Peels market.

                APAC will register the highest growth rate of 48% among the other regions. Therefore, the Face Masks And Peels market in APAC is expected to garner significant business opportunities for the vendors during the forecast period.

                China, Japan, South Korea, India, Taiwan, US, Canada, France, UK, Germany

                • Product innovation and product line extension leading to product premiumizationThe global BPC products market demands regular innovations as customers are on the lookout for innovative and effective products that can serve their requirements. The preference for facial skincare products that treat multiple skin concerns in a brief time span and the demand for natural is the driving factor this market.
                • instant ways to treat and heal facial skin is high. To meet the evolving requirements of beauty-conscious customers is the driving factor this market.
                • manufacturers focus on introducing innovative products. Moreover is the driving factor this market.
                • they also focus on adding new skincare products to extend their existing product lines based on customer requirements. A rise in the spending power of customers on facial skincare products and growing demand for premium skin care products will drive the growth of the global face mask and peel products market over the years. Skincare brands focus on differentiating themselves from pharmaceutical companies. Hence is the driving factor this market.
                • manufacturers of skincare products invest in innovative ingredients that positively impact the health and appearance of facial skin. Moreover is the driving factor this market.
                • manufacturers of selected professional facial skincare products offer innovative is the driving factor this market.
                • professional facial skin treatments and products is the driving factor this market.
                • which are costlier than regular facial skincare products. Major facial skincare concerns include anti-aging is the driving factor this market.
                • acne is the driving factor this market.
                • dark circles is the driving factor this market.
                • dullness is the driving factor this market.
                • skin brightening is the driving factor this market.
                • and pigmentation. Innovative facial skincare products is the driving factor this market.
                • including facial masks and peels is the driving factor this market.
                • are required to have an appropriate combination of superior-quality ingredients is the driving factor this market.
                • a factor that leads to product premiumization. Therefore is the driving factor this market.
                • product premiumization serves as a price driver for the global facial masks and peels market as it boosts the revenue of the vendors. is the driving factor this market.

                The Face Masks And Peels market vendors should focus on grabbing business opportunities from the Face masks segment as it accounted for the largest market share in the base year.