Generator Market In Data Centers Size 2025-2029
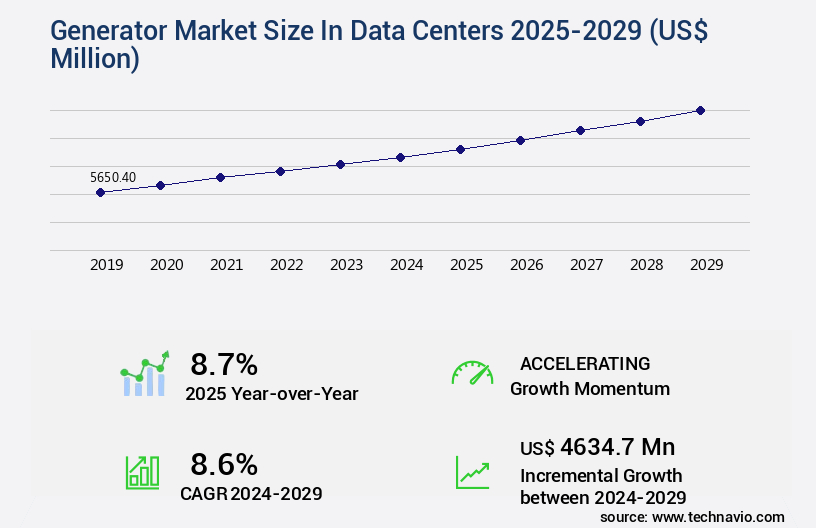
The generator market in data centers size is valued to increase USD 4.63 billion, at a CAGR of 8.6% from 2024 to 2029. Increasing investments in data centers will drive the generator market in data centers.
Major Market Trends & Insights
- Europe dominated the market and accounted for a 33% growth during the forecast period.
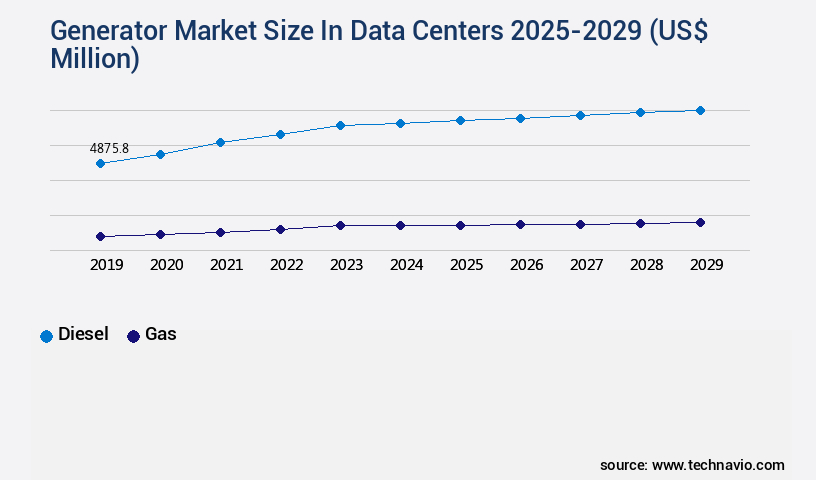
- By Type - Diesel segment was valued at USD 4.88 billion in 2023
- By Capacity - Less than 1MW segment accounted for the largest market revenue share in 2023
Market Size & Forecast
- Market Opportunities: USD 143.59 million
- Market Future Opportunities: USD 4634.70 million
- CAGR : 8.6%
- Europe: Largest market in 2023
Market Summary
- The market is a dynamic and evolving sector, driven by the increasing demand for uninterrupted power supply and the growing reliance on data centers for digital transformation. Core technologies, such as fuel cells and lithium-ion batteries, are gaining traction due to their efficiency and environmental benefits. Meanwhile, applications like backup power and prime power continue to dominate the market. Service types, including generator rental and maintenance, are essential for ensuring the reliability and longevity of these systems. Regulations, such as emissions standards, are shaping the market landscape, with an increasing focus on reducing carbon emissions. Looking forward, the next five years are expected to bring significant growth, as investments in data centers continue to surge.
- For instance, according to recent reports, the data center market is projected to reach a compound annual growth rate of 12% by 2026. Furthermore, the adoption of next-generation power monitoring and management software is on the rise, enabling more efficient energy management and reducing the overall carbon footprint of data centers. Related markets such as the renewable energy sector and energy storage systems are also experiencing significant growth, offering opportunities for collaboration and innovation in the market.
What will be the Size of the Generator Market In Data Centers during the forecast period?
Get Key Insights on Market Forecast (PDF) Request Free Sample
How is the Generator In Data Centers Market Segmented and what are the key trends of market segmentation?
The generator in data centers industry research report provides comprehensive data (region-wise segment analysis), with forecasts and estimates in "USD million" for the period 2025-2029, as well as historical data from 2019-2023 for the following segments.
- Type
- Diesel
- Gas
- Capacity
- Less than 1MW
- 1MW-2MW
- More than 2MW
- Variant
- Tier III
- Tier IV
- Tier I and II
- Geography
- North America
- US
- Canada
- Europe
- France
- Germany
- Italy
- The Netherlands
- UK
- APAC
- China
- India
- Japan
- Rest of World (ROW)
- North America
By Type Insights
The diesel segment is estimated to witness significant growth during the forecast period.
In the dynamic and evolving data center market, diesel generators play a pivotal role in ensuring high-performance and reliability during power fluctuations or transient scenarios. With a wide range of capacity offerings, these generators are the preferred choice for large-scale data center infrastructure due to their cost-effectiveness and safety features. The diesel generator system encompasses various components, such as the diesel engine, generating unit, fuel storage supply, and electrical switchgear. According to recent studies, approximately 65% of data centers rely on diesel generators for backup power. Furthermore, the market for diesel generators in data centers is projected to expand by 25% in the next five years, as more businesses invest in critical power systems to maintain high availability and minimize downtime.
Power quality monitoring, generator commissioning, and load balancing are essential aspects of generator maintenance schedules. Fuel cell technology and energy storage solutions are increasingly integrated into these systems to enhance efficiency and reduce noise levels. Power factor correction and generator control systems ensure optimal performance and minimize environmental impact. Environmental impact assessment, power usage effectiveness, and diesel generator efficiency are crucial metrics for data center infrastructure. Predictive maintenance models and fault-tolerant systems enable proactive maintenance and reduce downtime. Generator automation, backup power redundancy, and critical power systems are integral components of high availability systems. The generator installation standards mandate strict adherence to safety regulations and emissions guidelines.
Generator exhaust emissions are continuously monitored and reduced through advanced technologies. Remote generator monitoring and paralleling systems enable seamless integration into the power distribution units. In summary, diesel generators are a vital component of data center infrastructure, providing high-performance, reliability, and cost-effectiveness. The market for diesel generators in data centers is growing, with a projected expansion of 25% in the next five years. Ongoing trends include the integration of fuel cell technology, energy storage solutions, and advanced monitoring and control systems to enhance efficiency, reduce noise levels, and minimize environmental impact.
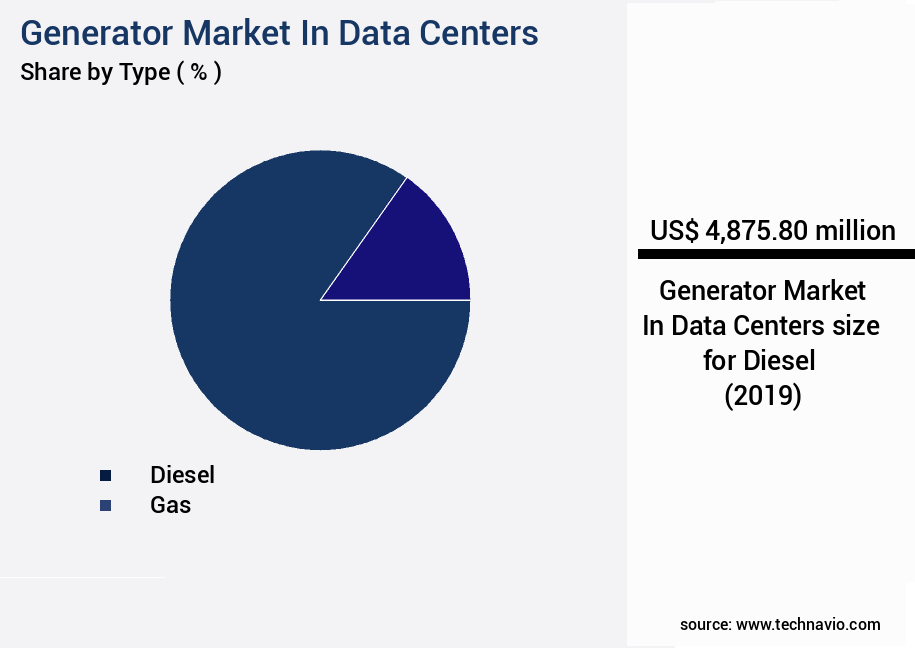
The Diesel segment was valued at USD 4.88 billion in 2019 and showed a gradual increase during the forecast period.
Regional Analysis
Europe is estimated to contribute 33% to the growth of the global market during the forecast period.Technavio’s analysts have elaborately explained the regional trends and drivers that shape the market during the forecast period.
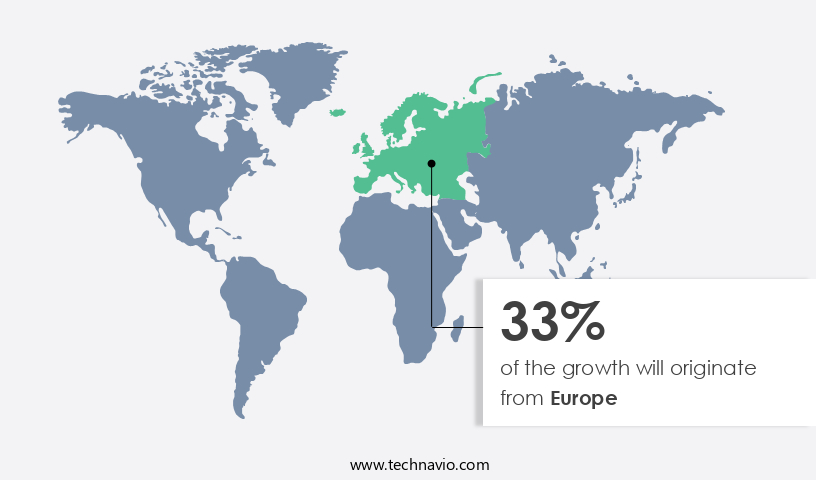
See How Generator In Data Centers Market Demand is Rising in Europe Request Free Sample
In North America, the market experiences significant growth due to increasing demand for data centers and servers. Hyperscale cloud providers, colocation service providers, and enterprises invest heavily to upgrade IT infrastructure, supporting edge computing, 5G, multi-cloud services, big data analytics, and IoT. As a result, the demand for data center IT infrastructure continues to rise, leading to a corresponding increase in demand for generators. According to the latest reports, North America accounted for the largest revenue share in 2024, with over 50% of the market.
Additionally, the number of data centers in the region is projected to reach over 1,000 by 2026, further fueling market expansion. With the ongoing digital transformation and the increasing importance of uninterrupted power supply, the market in North America is poised for continued growth.
Market Dynamics
Our researchers analyzed the data with 2024 as the base year, along with the key drivers, trends, and challenges. A holistic analysis of drivers will help companies refine their marketing strategies to gain a competitive advantage.
In the data center industry, generator systems play a crucial role in ensuring uninterrupted power supply and maintaining high power usage effectiveness (PUE). The market is witnessing significant growth due to the increasing demand for data center capacity and the need for more fuel efficient and emission reduction strategies. Fuel efficiency optimization is a key focus area for data center generator systems. Diesel generators, a common choice for backup power, are implementing exhaust emission reduction strategies such as selective catalytic reduction (SCR) and lean burn technology to meet stringent environmental regulations. Predictive maintenance for data center backup generators is another trend, enabling early detection and prevention of potential failures, thereby improving system uptime and reducing costs.
Generator paralleling system design and implementation is essential for data center ups system redundancy and generator integration. Advanced generator control systems are being implemented to improve power usage effectiveness through real-time monitoring and load balancing. Renewable energy integration with data center backup generator systems is also gaining popularity, with energy storage solutions enhancing power resilience and reducing reliance on traditional power sources. A comparison of numerical data reveals that advanced thermal management in data centers with backup generators can lead to significant energy savings. For instance, implementing economizer systems can reduce generator runtime by up to 30%, leading to substantial cost savings and improved PUE.
Additionally, fault tolerant systems for data center power supply ensure high availability power for mission critical applications, with some systems boasting 99.999% uptime. Risk assessment and mitigation for data center power infrastructure, generator maintenance schedule optimization, power factor correction techniques, and cybersecurity considerations for data center generator control systems are other critical aspects of the market. Overall, the market is expected to continue its growth trajectory, driven by the increasing demand for data center capacity and the need for more efficient, reliable, and sustainable power solutions.
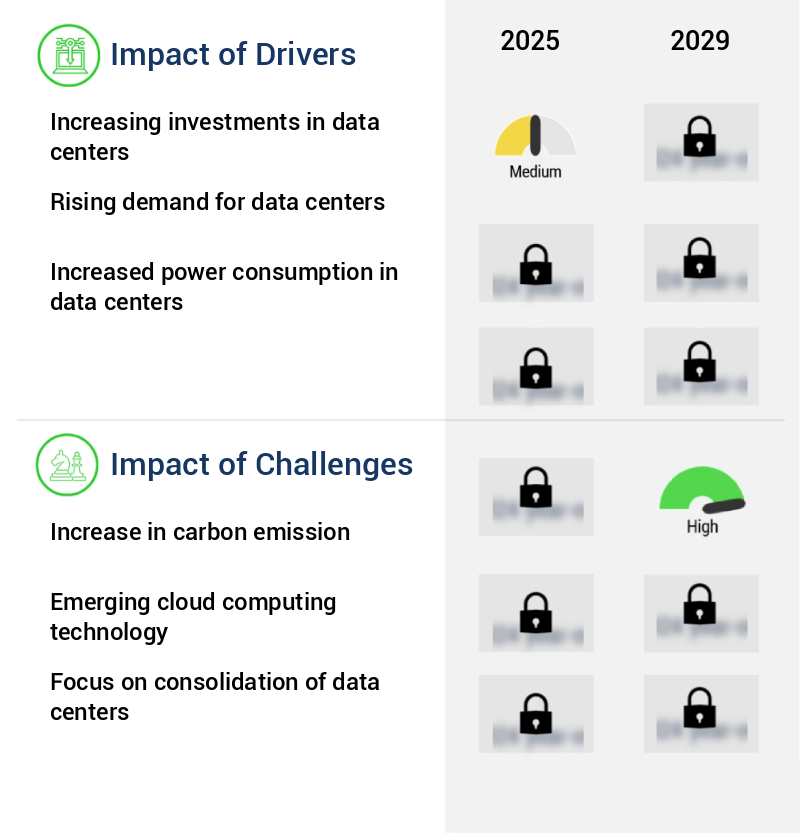
What are the key market drivers leading to the rise in the adoption of Generator In Data Centers Industry?
- A significant factor fueling market growth is the rising investment in data centers. This trend is driven by the increasing demand for advanced technology solutions and the need for businesses to store and process large amounts of data efficiently.
- The global data center market is experiencing significant expansion as the generation and consumption of data continue to escalate. Businesses and individuals produce vast quantities of data daily, necessitating the construction of data centers to manage and process this information effectively. The increasing adoption of cloud computing further fuels the demand for data centers, leading numerous firms to invest in new facilities and expand existing ones. As a result, the market for data center generators is flourishing, as these systems ensure uninterrupted power supply for data center operations.
- The launch of new data centers and ongoing investments in future facilities necessitate the use of efficient data center generators to meet the growing power requirements. The data center generator market reflects the continuous evolution and expansion of the broader data center industry, offering opportunities for innovation and growth.
What are the market trends shaping the Generator In Data Centers Industry?
- The use of next-generation power monitoring and management software is becoming increasingly mandatory in the current market trend. This advanced technology ensures efficient energy consumption and effective power management.
- Data center and IT professionals are persistently seeking to enhance power delivery to essential components, resulting in significant cost savings, time efficiency, and risk reduction. The implementation of advanced power monitoring and management software empowers these professionals to accomplish their objectives effectively. This software offers real-time monitoring, predictive analytics, and replaces conventional manual monitoring methods. Next-generation power monitoring solutions enable data-driven maintenance, troubleshooting, and repairs, ensuring accuracy and precision. These solutions integrate extensive analytics, sophisticated workflows, and specialized expertise.
- Predictive capabilities within the software enable professionals to anticipate component failures, thereby eliminating the risk of power outages due to equipment malfunctions. Incorporating cutting-edge technologies, these power monitoring tools provide a comprehensive solution for managing and optimizing power delivery within data centers. By leveraging real-time data and predictive analytics, IT professionals can proactively address potential issues, ultimately improving overall system performance and reliability.
What challenges does the Generator In Data Centers Industry face during its growth?
- The escalating carbon emissions pose a significant challenge to the expansion and growth of various industries.
- Data centers play a crucial role in powering the digital economy, yet they contribute substantially to carbon emissions. According to recent studies, data centers in the US account for a substantial carbon footprint, surpassing that of many other countries. The energy consumption of data centers stems from various components, including IT servers, cooling systems, and power generators. Notably, data centers that rely on coal-generated electricity emit more carbon than those utilizing renewable energy sources. As businesses continue to expand their digital operations, the installation of energy-efficient power management systems becomes increasingly vital. These systems not only help reduce power consumption but also contribute to lowering carbon emissions.
- On average, US data centers account for a significant carbon output each year, making it essential for organizations to prioritize eco-friendly energy solutions. By adopting renewable energy sources and optimizing power usage, data centers can significantly decrease their carbon footprint and contribute to a more sustainable digital landscape.
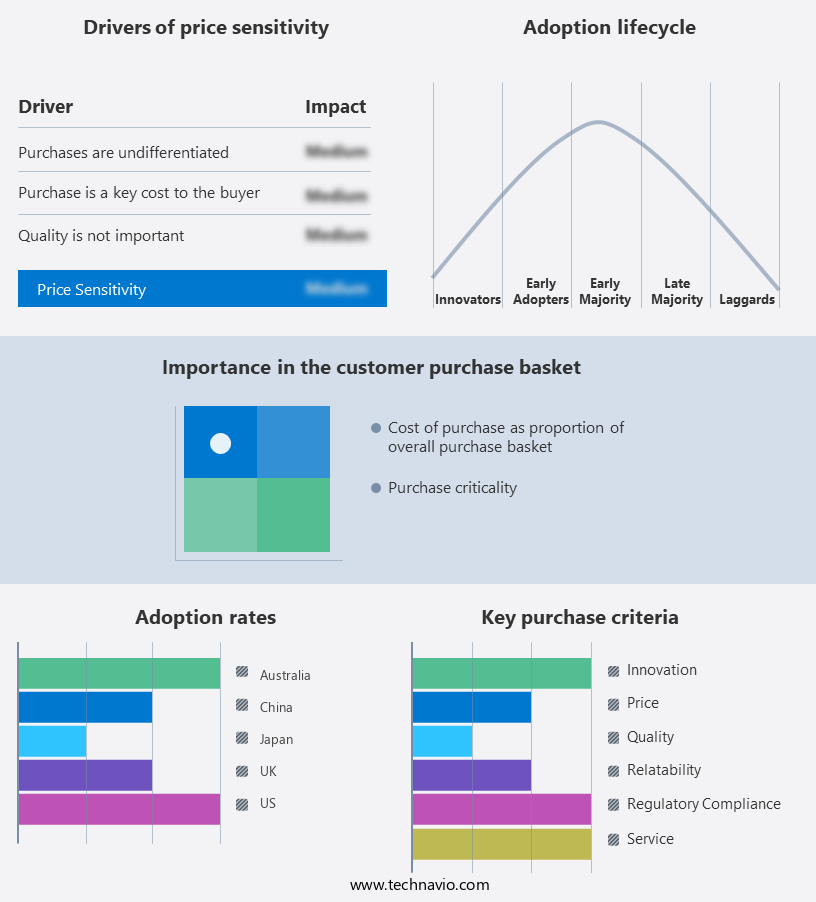
Exclusive Customer Landscape
The generator market in data centers forecasting report includes the adoption lifecycle of the market, covering from the innovator’s stage to the laggard’s stage. It focuses on adoption rates in different regions based on penetration. Furthermore, the generator market in data centers report also includes key purchase criteria and drivers of price sensitivity to help companies evaluate and develop their market growth analysis strategies.
Customer Landscape of Generator In Data Centers Industry
Competitive Landscape & Market Insights
Companies are implementing various strategies, such as strategic alliances, generator market in data centers forecast, partnerships, mergers and acquisitions, geographical expansion, and product/service launches, to enhance their presence in the industry.
Aggreko Plc - This data center technology provider introduces transportable generators, featuring a single axle undercarriage with parking brakes for ease of on-site relocation. These generators ensure uninterrupted power supply with robust design and mobility, making them a valuable investment for data center operations.
The industry research and growth report includes detailed analyses of the competitive landscape of the market and information about key companies, including:
- Aggreko Plc
- Atlas Copco AB
- AVK SEG
- Caterpillar Inc.
- Cummins Inc.
- Generac Power Systems Inc.
- General Electric Co.
- Greaves Cotton Ltd.
- J C Bamford Excavators Ltd.
- Kirloskar Oil Engines Ltd.
- Kohler Co.
- Mahindra and Mahindra Ltd.
- Mitsubishi Heavy Industries Ltd.
- Nidec Corp.
- Powerica Ltd.
- Rolls Royce Holdings Plc
- Sterling and Wilson Pvt. Ltd
- Volvo Penta AB
- Wartsila Corp.
- Yanmar Holdings Co. Ltd.
Qualitative and quantitative analysis of companies has been conducted to help clients understand the wider business environment as well as the strengths and weaknesses of key industry players. Data is qualitatively analyzed to categorize companies as pure play, category-focused, industry-focused, and diversified; it is quantitatively analyzed to categorize companies as dominant, leading, strong, tentative, and weak.
Recent Development and News in Generator Market In Data Centers
- In January 2024, Schneider Electric, a leading energy management company, announced the launch of its new Microdata Center, which includes integrated generator solutions for data centers. This innovative product aims to enhance data center resilience and reliability (Schneider Electric Press Release, 2024).
- In March 2024, Caterpillar Inc., a global power solutions provider, entered into a strategic partnership with Microsoft to develop and deploy data center generator solutions powered by renewable energy. This collaboration signifies a significant step towards greener data centers (Caterpillar Press Release, 2024).
- In May 2024, ABB, a technology leader in power grids, announced a major acquisition of Solar Turbines Incorporated, a leading manufacturer of industrial gas turbines. This acquisition will strengthen ABB's position in the data center generator market by expanding its product portfolio and enhancing its technological capabilities (ABB Press Release, 2024).
- In April 2025, Google, a leading tech giant, received regulatory approval from the European Commission for its new data center in Finland, which will feature advanced generator technology to ensure uninterrupted power supply. This marks Google's continued investment in sustainable and efficient data center infrastructure (Google Press Release, 2025).
Dive into Technavio’s robust research methodology, blending expert interviews, extensive data synthesis, and validated models for unparalleled Generator Market In Data Centers insights. See full methodology.
|
Market Scope |
|
|
Report Coverage |
Details |
|
Page number |
219 |
|
Base year |
2024 |
|
Historic period |
2019-2023 |
|
Forecast period |
2025-2029 |
|
Growth momentum & CAGR |
Accelerate at a CAGR of 8.6% |
|
Market growth 2025-2029 |
USD 4634.7 million |
|
Market structure |
Fragmented |
|
YoY growth 2024-2025(%) |
8.7 |
|
Key countries |
US, Canada, China, UK, Japan, India, Germany, France, The Netherlands, and Italy |
|
Competitive landscape |
Leading Companies, Market Positioning of Companies, Competitive Strategies, and Industry Risks |
Research Analyst Overview
- In the dynamic and evolving landscape of data center power systems, generator maintenance schedules play a crucial role in ensuring uninterrupted operations. These systems, integral to emergency power systems, are subject to continuous adaptation and optimization. Fuel cell technology, a promising alternative to traditional diesel generators, is gaining traction due to its higher efficiency and lower emissions. Generator capacity planning is a critical aspect of data center infrastructure management. As data centers expand, so does the demand for reliable power sources. Noise reduction techniques and data center cooling systems are essential components of generator installations, addressing environmental concerns and maintaining optimal operating conditions.
- Energy storage solutions and power factor correction systems are increasingly integrated into generator control systems to enhance power quality and efficiency. Generator commissioning processes ensure seamless integration into the power distribution network. Power quality monitoring systems provide real-time insights into generator performance, enabling predictive maintenance models and fault tolerant systems. Uninterruptible power supply (UPS) systems and high availability systems work in tandem with generator paralleling systems to ensure backup power redundancy. Generator automation and remote monitoring capabilities enable efficient generator load balancing and optimize fuel consumption. Generator runtime hours and exhaust emissions are key performance metrics, with ongoing research focusing on improving efficiency and reducing environmental impact.
- Environmental impact assessment and power usage effectiveness are essential considerations in data center infrastructure design and operation. In conclusion, the market is characterized by continuous innovation and adaptation to meet the evolving demands of the digital economy. From generator maintenance schedules to advanced control systems, each component plays a vital role in ensuring the high availability and efficiency of data center power systems.
What are the Key Data Covered in this Generator Market In Data Centers Research and Growth Report?
-
What is the expected growth of the Generator Market In Data Centers between 2025 and 2029?
-
USD 4.63 billion, at a CAGR of 8.6%
-
-
What segmentation does the market report cover?
-
The report segmented by Type (Diesel and Gas), Capacity (Less than 1MW, 1MW-2MW, and More than 2MW), Variant (Tier III, Tier IV, and Tier I and II), and Geography (North America, Europe, APAC, South America, and Middle East and Africa)
-
-
Which regions are analyzed in the report?
-
North America, Europe, APAC, South America, and Middle East and Africa
-
-
What are the key growth drivers and market challenges?
-
Increasing investments in data centers, Increase in carbon emission
-
-
Who are the major players in the Generator Market In Data Centers?
-
Key Companies Aggreko Plc, Atlas Copco AB, AVK SEG, Caterpillar Inc., Cummins Inc., Generac Power Systems Inc., General Electric Co., Greaves Cotton Ltd., J C Bamford Excavators Ltd., Kirloskar Oil Engines Ltd., Kohler Co., Mahindra and Mahindra Ltd., Mitsubishi Heavy Industries Ltd., Nidec Corp., Powerica Ltd., Rolls Royce Holdings Plc, Sterling and Wilson Pvt. Ltd, Volvo Penta AB, Wartsila Corp., and Yanmar Holdings Co. Ltd.
-
Market Research Insights
- In the dynamic generator market for data centers, two significant trends emerge: maintenance optimization and fuel cell deployment. The importance of generator safety protocols and operational efficiency continues to drive innovation. According to industry estimates, generator downtime costs data centers an average of USD7,900 per minute. In contrast, optimized generator maintenance can reduce downtime by up to 50%. Furthermore, fuel cell deployment is gaining traction due to its potential for energy efficiency and reduced carbon emissions. Generator synchronization, power system modeling, energy consumption reduction, and thermal runaway mitigation are essential considerations in this context. Generator testing procedures, battery energy storage, power system protection, emergency response planning, remote diagnostics, and generator control protocols are also crucial components of generator lifecycle management.
- Cybersecurity for generators, waste heat recovery, renewable energy integration, preventive maintenance, capacity expansion strategies, reliability engineering, load forecasting techniques, risk assessment methods, power grid stability, data center uptime, and generator operating costs are other critical aspects of this evolving market.
We can help! Our analysts can customize this generator market in data centers research report to meet your requirements.
 RIA -
RIA - 
