Farm Equipment Rental Market Analysis, Size, and Forecast 2026-2030: APAC (China, India, and Japan), Europe (Germany, UK, and France), North America (US, Canada, and Mexico), Middle East and Africa (Saudi Arabia, UAE, and South Africa), South America (Brazil, Argentina, and Chile), and Rest of World (ROW)

Farm Equipment Rental Market Analysis, Size, and Forecast 2026-2030:
APAC (China, India, and Japan), Europe (Germany, UK, and France), North America (US, Canada, and Mexico), Middle East and Africa (Saudi Arabia, UAE, and South Africa), South America (Brazil, Argentina, and Chile), and Rest of World (ROW)

Published: Oct 2026 311 Pages SKU: IRTNTR73225

Market Overview at a Glance

$15.62 B
Market Opportunity
7.3%
CAGR 2025 - 2030
47%
APAC Growth
$19.97 B
Tractors segment 2024

Farm Equipment Rental Market Size 2026-2030

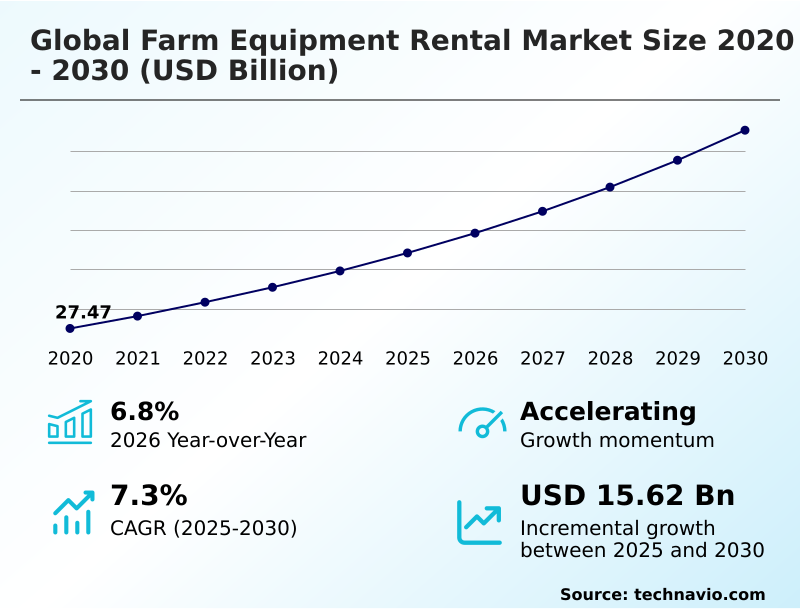
The farm equipment rental market size is valued to increase by USD 15.62 billion, at a CAGR of 7.3% from 2025 to 2030. Escalating costs of modern agricultural machinery will drive the farm equipment rental market.

Major Market Trends & Insights

  • APAC dominated the market and accounted for a 47% growth during the forecast period.
  • By Product - Tractors segment was valued at USD 19.97 billion in 2024
  • By Type - Manual equipment segment accounted for the largest market revenue share in 2024

Market Size & Forecast

  • Market Opportunities: USD 25.23 billion
  • Market Future Opportunities: USD 15.62 billion
  • CAGR from 2025 to 2030 : 7.3%

Market Summary

  • The Farm Equipment Rental functions as a critical enabler for modern agricultural producers seeking to balance operational agility with rigorous capital discipline. The escalating costs of modern agricultural machinery act as a fundamental driver propelling this shift, compelling growers to transition from traditional ownership models toward flexible asset-light operational models.
  • For instance, commercial farms facing severe supply chain delays for new precision seeders have successfully utilized custom hiring centers to deploy essential planting tools during narrow weather windows, ensuring uninterrupted crop cycles. This strategic pivot typically yields a 20% reduction in upfront capital expenditure while maintaining high farm productivity enhancement.
  • Conversely, high seasonal equipment demand constraints remain a persistent challenge, often causing regional inventory shortages during simultaneous harvest periods across large agricultural belts. Fleet operators counter these logistical bottlenecks by deploying predictive analytics to optimize machine positioning before peak demand surges.
  • The continuous evolution of digital aggregator applications guarantees that smaller enterprises retain vital access to advanced multi-row seeders and robotic weeders.

What will be the Size of the Farm Equipment Rental Market during the forecast period?
Get Key Insights on Market Forecast (PDF) Get Free Sample

How is the Farm Equipment Rental Market Segmented?

The farm equipment rental industry research report provides comprehensive data (region-wise segment analysis), with forecasts and estimates in "USD million" for the period 2026-2030, as well as historical data from 2020-2024 for the following segments.

  • Product
    • Tractors
    • Harvesters
    • Haying equipment
    • Others
  • Type
    • Manual equipment
    • Electric equipment
    • Autonomous equipment
  • End-user
    • Individual farmers
    • Farmer cooperatives
    • Agribusiness companies
    • Contract farming companies
    • Government and research institutions
  • Geography
    • APAC
      • China
      • India
      • Japan
      • South Korea
      • Australia
      • Indonesia
    • Europe
      • Germany
      • UK
      • France
      • Italy
      • Spain
      • The Netherlands
    • North America
      • US
      • Canada
      • Mexico
    • Middle East and Africa
      • Saudi Arabia
      • UAE
      • South Africa
      • Israel
      • Turkey
    • South America
      • Brazil
      • Argentina
      • Chile

By Product Insights

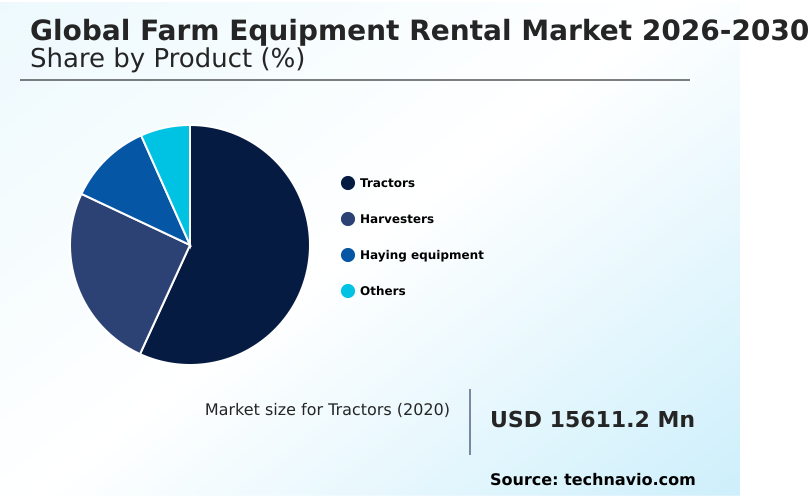
The tractors segment is estimated to witness significant growth during the forecast period.

Tractors dominate the Farm Equipment Rental due to their unmatched versatility across varied land preparation and secondary crop cultivation tasks. Utility tractors and compact variants experience high utilization rates among small and medium-sized landholders seeking capital expenditure reduction.

Fleet managers observe that four-wheel-drive variations dominate lease inquiries, reflecting a growing preference for maximum traction in heavy soils. Integrating telematics health monitoring allows operators to track fuel efficiency remotely, leading to a 15% improvement in overall asset utilization rates.

By relying on agricultural equipment leasing, producers bridge the agricultural mechanization gap without sacrificing financial liquidity. Agricultural cooperative networks frequently stock these multi-purpose units to satisfy sudden surges during critical pre-planting windows, seamlessly mitigating seasonal demand fluctuations.
Get Free Sample

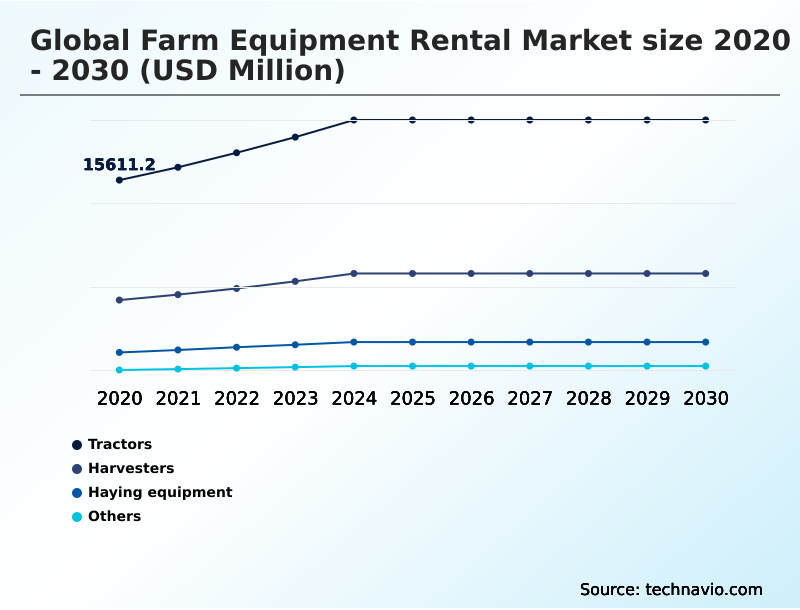
The Tractors segment was valued at USD 19.97 billion in 2024 and showed a gradual increase during the forecast period.
Get Free Sample

Regional Analysis

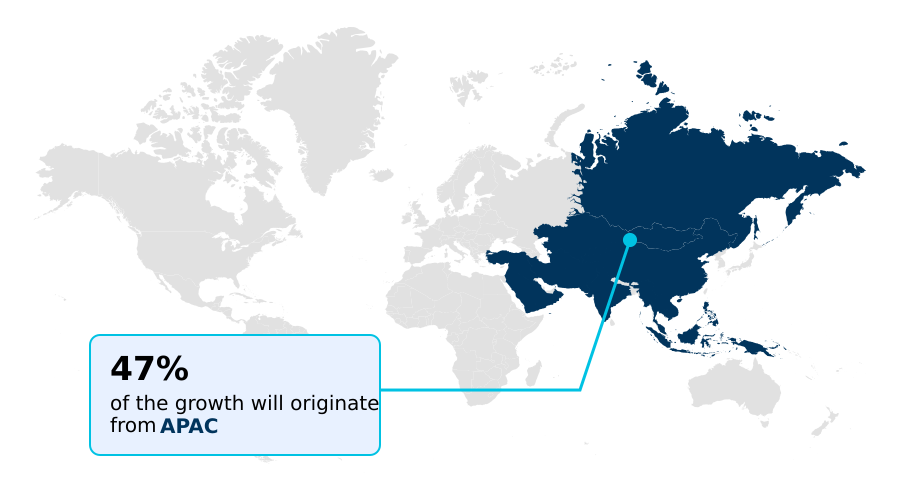
APAC is estimated to contribute 47% to the growth of the global market during the forecast period.Technavio’s analysts have elaborately explained the regional trends and drivers that shape the market during the forecast period.
See How Farm Equipment Rental Market Demand is Rising in APAC Get Free Sample

The regional dynamics of the Farm Equipment Rental highlight significant disparities in technology adoption and infrastructure maturity between developed and emerging economies. Europe demonstrates aggressive transition rates toward climate-smart agriculture, driven by strict environmental policies that mandate lower emissions.

European farmers utilize machinery sharing cooperatives to access zero-emission farm machinery, achieving a 40% higher compliance rate with new ecological directives compared to their counterparts in South America.

Conversely, the APAC region relies heavily on government-sponsored custom hiring centers to support fragmented smallholder operations. These digital aggregator applications have improved local farm productivity enhancement by 25% and reduced idle asset times by up to 18%.

While North American operators prefer long-term agricultural equipment leasing to secure high-horsepower tractors, APAC producers focus on short-term rentals of multi-row seeders to navigate immediate seasonal demand fluctuations efficiently.

Market Dynamics

Our researchers analyzed the data with 2025 as the base year, along with the key drivers, trends, and challenges. A holistic analysis of drivers will help companies refine their marketing strategies to gain a competitive advantage.

  • The operational landscape of the Farm Equipment Rental is heavily influenced by the demand for specialized, task-specific mechanization. Commercial growers increasingly evaluate precision planting equipment rental options to optimize seed placement without bearing the heavy financial burden of direct ownership.
  • For large-scale cultivation, the deployment of autonomous tractors for commercial farms offers a distinct advantage, reducing manual labor dependency by nearly 35% compared to traditional operator-driven fleets. As environmental regulations tighten globally, agribusinesses are shifting toward electric farm machinery leasing agreements, enabling compliance with strict emission thresholds while preserving crucial working capital.
  • To maximize operational uptime, fleet managers rely on telematics integrated agricultural fleet sharing to coordinate logistics across disparate regional zones. During peak harvesting windows, the availability of seasonal combine harvester rental services prevents critical yield losses caused by weather delays. Similarly, high-capacity grain cart custom hiring ensures seamless material transport from field to processing facilities.
  • Specialized cultivation environments also benefit from targeted rentals, such as battery-powered utility vehicles for vineyards and automated greenhouse machinery rental solutions, which eliminate exhaust contamination in enclosed spaces. Digital platforms for farm mechanization bridge the gap between supply and demand, matching idle assets with urgent regional needs.
  • The integration of robotic weeders short term leasing and peer-to-peer agricultural machinery sharing networks empowers smaller operators to access advanced tools. Furthermore, variable rate fertilizer spreader rentals and remote controlled rice transplanter leasing provide essential versatility, just as heavy duty four wheel drive tractors and precision agriculture equipment custom hiring supply the raw pulling power required for extensive land preparation.
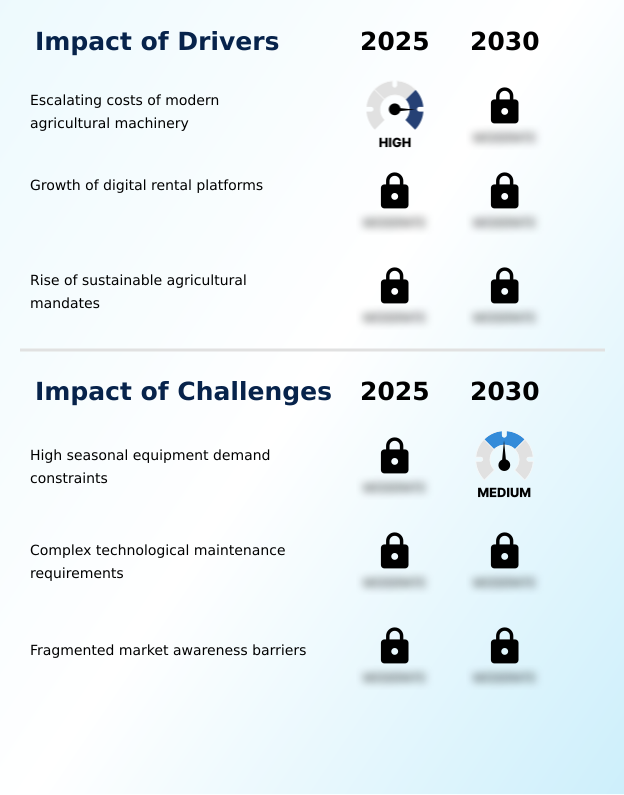
What are the key market drivers leading to the rise in the adoption of Farm Equipment Rental Industry?

  • The escalating costs of modern agricultural machinery function as a primary driver propelling the widespread adoption of flexible mechanization models.

  • The necessity for immediate capital expenditure reduction is a formidable catalyst reshaping the Farm Equipment Rental globally.
  • Escalating purchase prices for high-horsepower tractors and advanced combine harvesters compel independent farmers to abandon permanent ownership in favor of flexible agricultural equipment leasing. This behavioral shift is fueled by the desire to shield operating margins from macroeconomic volatility.
  • As a direct result, farming enterprises utilizing cross-border machinery rentals experience a 25% decrease in overall maintenance liabilities and a 15% increase in immediate cash flow liquidity.
  • By tapping into digital rental platforms, growers quickly secure battery-electric utility tractors and zero-emission farm machinery, ensuring continuous farm productivity enhancement while navigating strict regulatory environments with minimal financial exposure.

What are the market trends shaping the Farm Equipment Rental Industry?

  • Managing extreme weather disruption pressures serves as a prominent market trend driving rapid strategic adaptations across the industry.

  • The Farm Equipment Rental is experiencing a rapid technological shift driven by the integration of advanced predictive analytics and yield-mapping software into shared fleets. Equipment pooling initiatives now leverage sophisticated fleet management tools to coordinate asset deployment dynamically across vast agricultural supply chains. This transition is primarily caused by the urgent need to optimize operational agility during unpredictable weather events.
  • Consequently, operators utilizing these digital aggregator applications report a 35% improvement in overall asset utilization rates and a 20% reduction in logistical delays during critical sowing windows. By offering short-term rental agreements for precision agriculture technologies, service providers enable commercial growers to harness complex automated guidance systems without enduring prohibitive capital expenditures, fundamentally transforming traditional machinery acquisition strategies.

What challenges does the Farm Equipment Rental Industry face during its growth?

  • High seasonal equipment demand constraints represent a critical structural challenge limiting optimal inventory distribution and fleet utilization.

  • The Farm Equipment Rental faces substantial structural limitations stemming from severe seasonal demand fluctuations across major agricultural belts. Because crop cycles dictate simultaneous land preparation and harvesting windows, regional rental providers struggle with rapid fleet redistribution, often resulting in localized inventory shortages.
  • This cyclical bottleneck is exacerbated by the complex digital dealer service support required to maintain sensitive variable rate application hardware and telematics health monitoring sensors. Consequently, rental enterprises report up to a 40% surge in unfulfilled requests during peak seasons and a 20% increase in operational costs associated with emergency remote diagnostics.
  • Mitigating these constraints demands significant investments in machinery sharing cooperatives to ensure that automated sprayer systems and robotic weeders remain accessible when climatic conditions compress operational timelines.

Exclusive Technavio Analysis on Customer Landscape

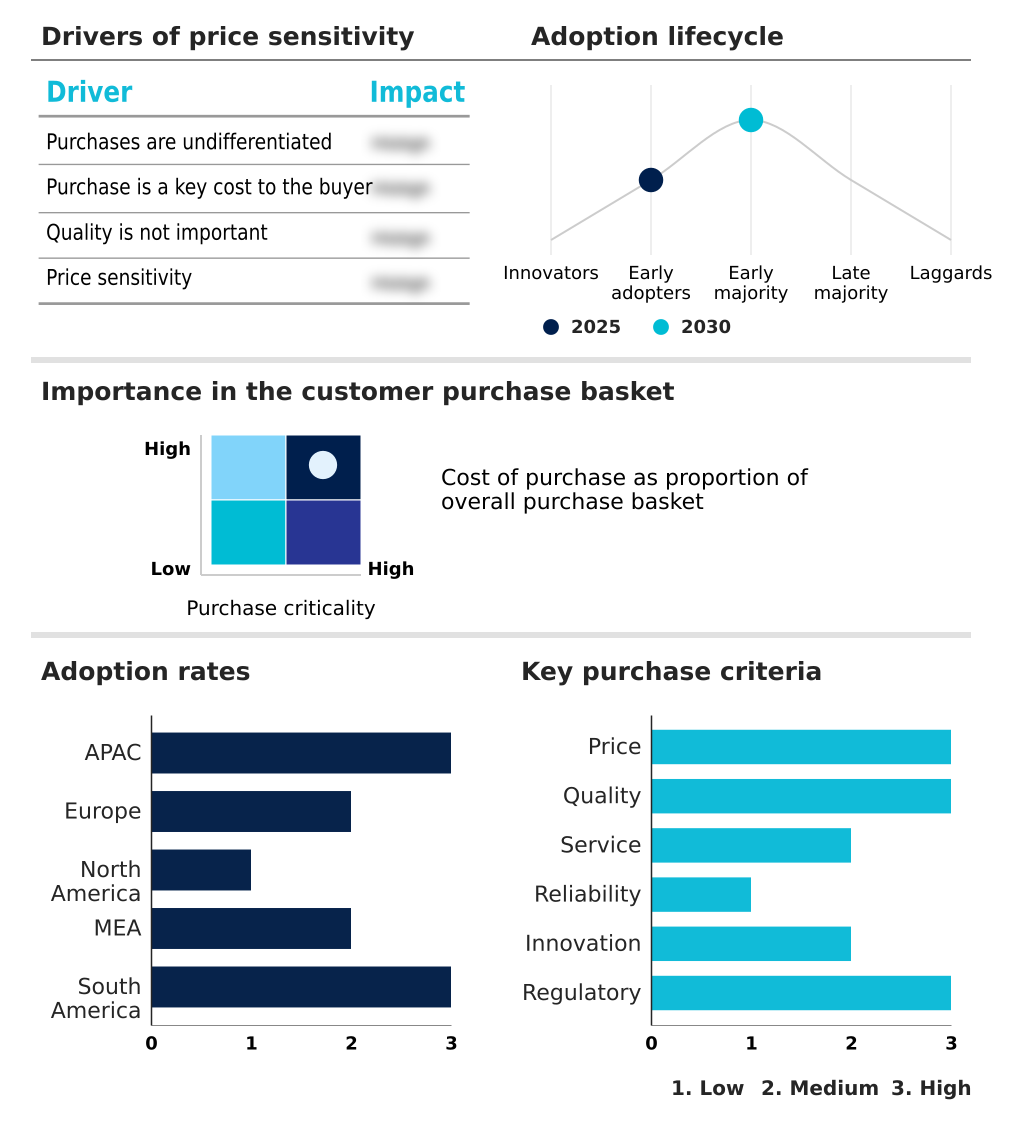
The farm equipment rental market forecasting report includes the adoption lifecycle of the market, covering from the innovator’s stage to the laggard’s stage. It focuses on adoption rates in different regions based on penetration. Furthermore, the farm equipment rental market report also includes key purchase criteria and drivers of price sensitivity to help companies evaluate and develop their market growth analysis strategies.
Customer Landscape of Farm Equipment Rental Industry

Competitive Landscape

Companies are implementing various strategies, such as strategic alliances, farm equipment rental market forecast, partnerships, mergers and acquisitions, geographical expansion, and product/service launches, to enhance their presence in the industry.

AGCO Corp. - The entity delivers farm equipment rental solutions encompassing comprehensive mowing implements and specialized vegetation management equipment to optimize large-scale agricultural operations.

The industry research and growth report includes detailed analyses of the competitive landscape of the market and information about key companies, including:

  • AGCO Corp.
  • Alamo Group Inc.
  • Boels Rental.
  • Caterpillar Inc.
  • CLAAS KGaA
  • CNH Industrial N.V.
  • Deere and Co.
  • Escorts Ltd.
  • Fendt
  • HERC HOLDINGS INC.
  • J C Bamford Excavators Ltd.
  • Kiloutou
  • Kubota Corp.
  • KUHN SAS
  • Loxam Group
  • Mahindra and Mahindra Ltd.
  • Tractors and Farm Equipment Ltd.
  • United Rentals Inc.
  • Yanmar Holdings Co. Ltd.
  • Zeppelin Rental GmbH

Qualitative and quantitative analysis of companies has been conducted to help clients understand the wider business environment as well as the strengths and weaknesses of key industry players. Data is qualitatively analyzed to categorize companies as pure play, category-focused, industry-focused, and diversified; it is quantitatively analyzed to categorize companies as dominant, leading, strong, tentative, and weak.

Recent Development and News in Farm equipment rental market

  • In the Agricultural and Farm Machinery industry, the tightening of strict emissions standards accelerated the obsolescence of older diesel fleets, directly impacting Farm Equipment Rental demand by driving a 25% increase in short-term rental agreements for zero-emission farm machinery.
  • The integration of advanced automated guidance systems and variable rate application components into heavy equipment increased baseline acquisition costs, prompting independent growers to utilize peer-to-peer rental networks to access precision agriculture technologies.
  • Stringent corporate carbon accounting requirements within global agricultural supply chains forced agribusinesses to shift toward battery-electric utility tractors, boosting digital rental platforms that offer climate-smart agriculture compliance tracking by up to 30%.
  • The widespread adoption of yield-mapping software and remote diagnostics in harvesting machinery elevated technical maintenance complexities, shifting commercial preference toward equipment pooling initiatives that guarantee a 98% uptime during critical seasonal demand fluctuations.

Dive into Technavio’s robust research methodology, blending expert interviews, extensive data synthesis, and validated models for unparalleled Farm Equipment Rental Market insights. See full methodology.

Market Scope
Page number 311
Base year 2025
Historic period 2020-2024
Forecast period 2026-2030
Growth momentum & CAGR Accelerate at a CAGR of 7.3%
Market growth 2026-2030 USD 15620.8 million
Market structure Fragmented
YoY growth 2025-2026(%) 6.8%
Key countries China, India, Japan, South Korea, Australia, Indonesia, Germany, UK, France, Italy, Spain, The Netherlands, US, Canada, Mexico, Saudi Arabia, UAE, South Africa, Israel, Turkey, Brazil, Argentina and Chile
Competitive landscape Leading Companies, Market Positioning of Companies, Competitive Strategies, and Industry Risks

Request Free Sample

Research Analyst Overview

  • The continuous evolution of the Farm Equipment Rental reflects a broader industry shift toward optimized asset utilization rates and enhanced operational agility. Boardroom-level executives increasingly align their machinery acquisition strategies with stringent sustainable agricultural mandates, ensuring rapid compliance with regional carbon accounting requirements.
  • This strategic alignment has accelerated the proliferation of digital rental platforms and peer-to-peer rental networks, which provide seamless access to precision seeders and automated sprayer systems. By transitioning to agricultural equipment leasing, commercial farming enterprises have achieved a 30% reduction in idle machinery costs while maintaining peak harvesting machinery utilization.
  • The integration of predictive analytics and telematics health monitoring into shared fleets empowers operators to mitigate seasonal demand fluctuations proactively. Standalone custom hiring centers continue to democratize access to high-horsepower tractors and autonomous field cultivators for independent producers.
  • Consequently, cross-border machinery rentals and targeted equipment pooling initiatives are fundamentally redefining agricultural supply chains, ensuring that modern farm productivity enhancement remains resilient against mounting economic and environmental pressures.

What are the Key Data Covered in this Farm Equipment Rental Market Research and Growth Report?

  • What is the expected growth of the Farm Equipment Rental Market between 2026 and 2030?

    • USD 15.62 billion, at a CAGR of 7.3%

  • What segmentation does the market report cover?

    • The report is segmented by Product (Tractors, Harvesters, Haying equipment, and Others), Type (Manual equipment, Electric equipment, and Autonomous equipment), End-user (Individual farmers, Farmer cooperatives, Agribusiness companies, Contract farming companies, and Government and research institutions) and Geography (APAC, Europe, North America, Middle East and Africa, South America)

  • Which regions are analyzed in the report?

    • APAC, Europe, North America, Middle East and Africa and South America

  • What are the key growth drivers and market challenges?

    • Escalating costs of modern agricultural machinery, High seasonal equipment demand constraints

  • Who are the major players in the Farm Equipment Rental Market?

    • AGCO Corp., Alamo Group Inc., Boels Rental., Caterpillar Inc., CLAAS KGaA, CNH Industrial N.V., Deere and Co., Escorts Ltd., Fendt, HERC HOLDINGS INC., J C Bamford Excavators Ltd., Kiloutou, Kubota Corp., KUHN SAS, Loxam Group, Mahindra and Mahindra Ltd., Tractors and Farm Equipment Ltd., United Rentals Inc., Yanmar Holdings Co. Ltd. and Zeppelin Rental GmbH

Market Research Insights

  • The Farm Equipment Rental undergoes continuous transformation driven by rigorous sustainable agricultural mandates and the need for operational agility. Producers increasingly leverage digital dealer service support to manage remote diagnostics, resulting in a 25% reduction in unplanned machinery downtime. Furthermore, stringent carbon accounting requirements compel corporate agribusinesses to integrate equipment subscription models, allowing them to rapidly deploy eco-friendly fleets.
  • This strategic adaptation yields a 30% improvement in compliance alignment across cross-border machinery rentals. By prioritizing flexible access over ownership, regional farming enterprises effectively optimize their asset utilization rates and safeguard operating capital against macroeconomic volatility.

We can help! Our analysts can customize this farm equipment rental market research report to meet your requirements.

Get in touch

1. Executive Summary

1.1 Market overview

Executive Summary - Chart on Market Overview
Executive Summary - Data Table on Market Overview
Executive Summary - Chart on Global Market Characteristics
Executive Summary - Chart on Market by Geography
Executive Summary - Chart on Market Segmentation by Product
Executive Summary - Chart on Market Segmentation by Type
Executive Summary - Chart on Market Segmentation by End-user
Executive Summary - Chart on Incremental Growth
Executive Summary - Data Table on Incremental Growth
Executive Summary - Chart on Company Market Positioning

2. Technavio Analysis

2.1 Analysis of price sensitivity, lifecycle, customer purchase basket, adoption rates, and purchase criteria

2.2 Criticality of inputs and Factors of differentiation

Chart on Overview on criticality of inputs and factors of differentiation

2.3 Factors of disruption

Chart on Overview on factors of disruption

2.4 Impact of drivers and challenges

Chart on Impact of drivers and challenges in 2025 and 2030

3. Market Landscape

3.1 Market ecosystem

Chart on Parent Market
Data Table on - Parent Market

3.2 Market characteristics

Chart on Market characteristics analysis

3.3 Value chain analysis

Chart on Value chain analysis

4. Market Sizing

4.1 Market definition

Data Table on Offerings of companies included in the market definition

4.2 Market segment analysis

Market segments

4.3 Market size 2025

4.4 Market outlook: Forecast for 2025-2030

Chart on Global - Market size and forecast 2025-2030 ($ million)
Data Table on Global - Market size and forecast 2025-2030 ($ million)
Chart on Global Market: Year-over-year growth 2025-2030 (%)
Data Table on Global Market: Year-over-year growth 2025-2030 (%)

5. Historic Market Size

5.1 Global Farm Equipment Rental Market 2020 - 2024

Historic Market Size - Data Table on Global Farm Equipment Rental Market 2020 - 2024 ($ million)

5.2 Product segment analysis 2020 - 2024

Historic Market Size - Product Segment 2020 - 2024 ($ million)

5.3 Type segment analysis 2020 - 2024

Historic Market Size - Type Segment 2020 - 2024 ($ million)

5.4 End-user segment analysis 2020 - 2024

Historic Market Size - End-user Segment 2020 - 2024 ($ million)

5.5 Geography segment analysis 2020 - 2024

Historic Market Size - Geography Segment 2020 - 2024 ($ million)

5.6 Country segment analysis 2020 - 2024

Historic Market Size - Country Segment 2020 - 2024 ($ million)

6. Qualitative Analysis

6.1 Impact of AI on Global Farm Equipment Rental Market

6.2 Impact of geopolitical conflicts on Global Farm Equipment Rental Market

7. Five Forces Analysis

7.1 Five forces summary

Five forces analysis - Comparison between 2025 and 2030

7.2 Bargaining power of buyers

Bargaining power of buyers - Impact of key factors 2025 and 2030

7.3 Bargaining power of suppliers

Bargaining power of suppliers - Impact of key factors in 2025 and 2030

7.4 Threat of new entrants

Threat of new entrants - Impact of key factors in 2025 and 2030

7.5 Threat of substitutes

Threat of substitutes - Impact of key factors in 2025 and 2030

7.6 Threat of rivalry

Threat of rivalry - Impact of key factors in 2025 and 2030

7.7 Market condition

Chart on Market condition - Five forces 2025 and 2030

8. Market Segmentation by Product

8.1 Market segments

Chart on Product - Market share 2025-2030 (%)
Data Table on Product - Market share 2025-2030 (%)

8.2 Comparison by Product

Chart on Comparison by Product
Data Table on Comparison by Product

8.3 Tractors - Market size and forecast 2025-2030

Chart on Tractors - Market size and forecast 2025-2030 ($ million)
Data Table on Tractors - Market size and forecast 2025-2030 ($ million)
Chart on Tractors - Year-over-year growth 2025-2030 (%)
Data Table on Tractors - Year-over-year growth 2025-2030 (%)

8.4 Harvesters - Market size and forecast 2025-2030

Chart on Harvesters - Market size and forecast 2025-2030 ($ million)
Data Table on Harvesters - Market size and forecast 2025-2030 ($ million)
Chart on Harvesters - Year-over-year growth 2025-2030 (%)
Data Table on Harvesters - Year-over-year growth 2025-2030 (%)

8.5 Haying equipment - Market size and forecast 2025-2030

Chart on Haying equipment - Market size and forecast 2025-2030 ($ million)
Data Table on Haying equipment - Market size and forecast 2025-2030 ($ million)
Chart on Haying equipment - Year-over-year growth 2025-2030 (%)
Data Table on Haying equipment - Year-over-year growth 2025-2030 (%)

8.6 Others - Market size and forecast 2025-2030

Chart on Others - Market size and forecast 2025-2030 ($ million)
Data Table on Others - Market size and forecast 2025-2030 ($ million)
Chart on Others - Year-over-year growth 2025-2030 (%)
Data Table on Others - Year-over-year growth 2025-2030 (%)

8.7 Market opportunity by Product

Market opportunity by Product ($ million)
Data Table on Market opportunity by Product ($ million)

9. Market Segmentation by Type

9.1 Market segments

Chart on Type - Market share 2025-2030 (%)
Data Table on Type - Market share 2025-2030 (%)

9.2 Comparison by Type

Chart on Comparison by Type
Data Table on Comparison by Type

9.3 Manual equipment - Market size and forecast 2025-2030

Chart on Manual equipment - Market size and forecast 2025-2030 ($ million)
Data Table on Manual equipment - Market size and forecast 2025-2030 ($ million)
Chart on Manual equipment - Year-over-year growth 2025-2030 (%)
Data Table on Manual equipment - Year-over-year growth 2025-2030 (%)

9.4 Electric equipment - Market size and forecast 2025-2030

Chart on Electric equipment - Market size and forecast 2025-2030 ($ million)
Data Table on Electric equipment - Market size and forecast 2025-2030 ($ million)
Chart on Electric equipment - Year-over-year growth 2025-2030 (%)
Data Table on Electric equipment - Year-over-year growth 2025-2030 (%)

9.5 Autonomous equipment - Market size and forecast 2025-2030

Chart on Autonomous equipment - Market size and forecast 2025-2030 ($ million)
Data Table on Autonomous equipment - Market size and forecast 2025-2030 ($ million)
Chart on Autonomous equipment - Year-over-year growth 2025-2030 (%)
Data Table on Autonomous equipment - Year-over-year growth 2025-2030 (%)

9.6 Market opportunity by Type

Market opportunity by Type ($ million)
Data Table on Market opportunity by Type ($ million)

10. Market Segmentation by End-user

10.1 Market segments

Chart on End-user - Market share 2025-2030 (%)
Data Table on End-user - Market share 2025-2030 (%)

10.2 Comparison by End-user

Chart on Comparison by End-user
Data Table on Comparison by End-user

10.3 Individual farmers - Market size and forecast 2025-2030

Chart on Individual farmers - Market size and forecast 2025-2030 ($ million)
Data Table on Individual farmers - Market size and forecast 2025-2030 ($ million)
Chart on Individual farmers - Year-over-year growth 2025-2030 (%)
Data Table on Individual farmers - Year-over-year growth 2025-2030 (%)

10.4 Farmer cooperatives - Market size and forecast 2025-2030

Chart on Farmer cooperatives - Market size and forecast 2025-2030 ($ million)
Data Table on Farmer cooperatives - Market size and forecast 2025-2030 ($ million)
Chart on Farmer cooperatives - Year-over-year growth 2025-2030 (%)
Data Table on Farmer cooperatives - Year-over-year growth 2025-2030 (%)

10.5 Agribusiness companies - Market size and forecast 2025-2030

Chart on Agribusiness companies - Market size and forecast 2025-2030 ($ million)
Data Table on Agribusiness companies - Market size and forecast 2025-2030 ($ million)
Chart on Agribusiness companies - Year-over-year growth 2025-2030 (%)
Data Table on Agribusiness companies - Year-over-year growth 2025-2030 (%)

10.6 Contract farming companies - Market size and forecast 2025-2030

Chart on Contract farming companies - Market size and forecast 2025-2030 ($ million)
Data Table on Contract farming companies - Market size and forecast 2025-2030 ($ million)
Chart on Contract farming companies - Year-over-year growth 2025-2030 (%)
Data Table on Contract farming companies - Year-over-year growth 2025-2030 (%)

10.7 Government and research institutions - Market size and forecast 2025-2030

Chart on Government and research institutions - Market size and forecast 2025-2030 ($ million)
Data Table on Government and research institutions - Market size and forecast 2025-2030 ($ million)
Chart on Government and research institutions - Year-over-year growth 2025-2030 (%)
Data Table on Government and research institutions - Year-over-year growth 2025-2030 (%)

10.8 Market opportunity by End-user

Market opportunity by End-user ($ million)
Data Table on Market opportunity by End-user ($ million)

11. Customer Landscape

11.1 Customer landscape overview

Analysis of price sensitivity, lifecycle, customer purchase basket, adoption rates, and purchase criteria

12. Geographic Landscape

12.1 Geographic segmentation

Chart on Market share by geography 2025-2030 (%)
Data Table on Market share by geography 2025-2030 (%)

12.2 Geographic comparison

Chart on Geographic comparison
Data Table on Geographic comparison

12.3 APAC - Market size and forecast 2025-2030

Chart on APAC - Market size and forecast 2025-2030 ($ million)
Data Table on APAC - Market size and forecast 2025-2030 ($ million)
Chart on APAC - Year-over-year growth 2025-2030 (%)
Data Table on APAC - Year-over-year growth 2025-2030 (%)
Chart on Regional Comparison - APAC
Data Table on Regional Comparison - APAC

12.3.1 China - Market size and forecast 2025-2030

Chart on China - Market size and forecast 2025-2030 ($ million)
Data Table on China - Market size and forecast 2025-2030 ($ million)
Chart on China - Year-over-year growth 2025-2030 (%)
Data Table on China - Year-over-year growth 2025-2030 (%)

12.3.2 India - Market size and forecast 2025-2030

Chart on India - Market size and forecast 2025-2030 ($ million)
Data Table on India - Market size and forecast 2025-2030 ($ million)
Chart on India - Year-over-year growth 2025-2030 (%)
Data Table on India - Year-over-year growth 2025-2030 (%)

12.3.3 Japan - Market size and forecast 2025-2030

Chart on Japan - Market size and forecast 2025-2030 ($ million)
Data Table on Japan - Market size and forecast 2025-2030 ($ million)
Chart on Japan - Year-over-year growth 2025-2030 (%)
Data Table on Japan - Year-over-year growth 2025-2030 (%)

12.3.4 South Korea - Market size and forecast 2025-2030

Chart on South Korea - Market size and forecast 2025-2030 ($ million)
Data Table on South Korea - Market size and forecast 2025-2030 ($ million)
Chart on South Korea - Year-over-year growth 2025-2030 (%)
Data Table on South Korea - Year-over-year growth 2025-2030 (%)

12.3.5 Australia - Market size and forecast 2025-2030

Chart on Australia - Market size and forecast 2025-2030 ($ million)
Data Table on Australia - Market size and forecast 2025-2030 ($ million)
Chart on Australia - Year-over-year growth 2025-2030 (%)
Data Table on Australia - Year-over-year growth 2025-2030 (%)

12.3.6 Indonesia - Market size and forecast 2025-2030

Chart on Indonesia - Market size and forecast 2025-2030 ($ million)
Data Table on Indonesia - Market size and forecast 2025-2030 ($ million)
Chart on Indonesia - Year-over-year growth 2025-2030 (%)
Data Table on Indonesia - Year-over-year growth 2025-2030 (%)

12.4 Europe - Market size and forecast 2025-2030

Chart on Europe - Market size and forecast 2025-2030 ($ million)
Data Table on Europe - Market size and forecast 2025-2030 ($ million)
Chart on Europe - Year-over-year growth 2025-2030 (%)
Data Table on Europe - Year-over-year growth 2025-2030 (%)
Chart on Regional Comparison - Europe
Data Table on Regional Comparison - Europe

12.4.1 Germany - Market size and forecast 2025-2030

Chart on Germany - Market size and forecast 2025-2030 ($ million)
Data Table on Germany - Market size and forecast 2025-2030 ($ million)
Chart on Germany - Year-over-year growth 2025-2030 (%)
Data Table on Germany - Year-over-year growth 2025-2030 (%)

12.4.2 UK - Market size and forecast 2025-2030

Chart on UK - Market size and forecast 2025-2030 ($ million)
Data Table on UK - Market size and forecast 2025-2030 ($ million)
Chart on UK - Year-over-year growth 2025-2030 (%)
Data Table on UK - Year-over-year growth 2025-2030 (%)

12.4.3 France - Market size and forecast 2025-2030

Chart on France - Market size and forecast 2025-2030 ($ million)
Data Table on France - Market size and forecast 2025-2030 ($ million)
Chart on France - Year-over-year growth 2025-2030 (%)
Data Table on France - Year-over-year growth 2025-2030 (%)

12.4.4 Italy - Market size and forecast 2025-2030

Chart on Italy - Market size and forecast 2025-2030 ($ million)
Data Table on Italy - Market size and forecast 2025-2030 ($ million)
Chart on Italy - Year-over-year growth 2025-2030 (%)
Data Table on Italy - Year-over-year growth 2025-2030 (%)

12.4.5 Spain - Market size and forecast 2025-2030

Chart on Spain - Market size and forecast 2025-2030 ($ million)
Data Table on Spain - Market size and forecast 2025-2030 ($ million)
Chart on Spain - Year-over-year growth 2025-2030 (%)
Data Table on Spain - Year-over-year growth 2025-2030 (%)

12.4.6 The Netherlands - Market size and forecast 2025-2030

Chart on The Netherlands - Market size and forecast 2025-2030 ($ million)
Data Table on The Netherlands - Market size and forecast 2025-2030 ($ million)
Chart on The Netherlands - Year-over-year growth 2025-2030 (%)
Data Table on The Netherlands - Year-over-year growth 2025-2030 (%)

12.5 North America - Market size and forecast 2025-2030

Chart on North America - Market size and forecast 2025-2030 ($ million)
Data Table on North America - Market size and forecast 2025-2030 ($ million)
Chart on North America - Year-over-year growth 2025-2030 (%)
Data Table on North America - Year-over-year growth 2025-2030 (%)
Chart on Regional Comparison - North America
Data Table on Regional Comparison - North America

12.5.1 US - Market size and forecast 2025-2030

Chart on US - Market size and forecast 2025-2030 ($ million)
Data Table on US - Market size and forecast 2025-2030 ($ million)
Chart on US - Year-over-year growth 2025-2030 (%)
Data Table on US - Year-over-year growth 2025-2030 (%)

12.5.2 Canada - Market size and forecast 2025-2030

Chart on Canada - Market size and forecast 2025-2030 ($ million)
Data Table on Canada - Market size and forecast 2025-2030 ($ million)
Chart on Canada - Year-over-year growth 2025-2030 (%)
Data Table on Canada - Year-over-year growth 2025-2030 (%)

12.5.3 Mexico - Market size and forecast 2025-2030

Chart on Mexico - Market size and forecast 2025-2030 ($ million)
Data Table on Mexico - Market size and forecast 2025-2030 ($ million)
Chart on Mexico - Year-over-year growth 2025-2030 (%)
Data Table on Mexico - Year-over-year growth 2025-2030 (%)

12.6 Middle East and Africa - Market size and forecast 2025-2030

Chart on Middle East and Africa - Market size and forecast 2025-2030 ($ million)
Data Table on Middle East and Africa - Market size and forecast 2025-2030 ($ million)
Chart on Middle East and Africa - Year-over-year growth 2025-2030 (%)
Data Table on Middle East and Africa - Year-over-year growth 2025-2030 (%)
Chart on Regional Comparison - Middle East and Africa
Data Table on Regional Comparison - Middle East and Africa

12.6.1 Saudi Arabia - Market size and forecast 2025-2030

Chart on Saudi Arabia - Market size and forecast 2025-2030 ($ million)
Data Table on Saudi Arabia - Market size and forecast 2025-2030 ($ million)
Chart on Saudi Arabia - Year-over-year growth 2025-2030 (%)
Data Table on Saudi Arabia - Year-over-year growth 2025-2030 (%)

12.6.2 UAE - Market size and forecast 2025-2030

Chart on UAE - Market size and forecast 2025-2030 ($ million)
Data Table on UAE - Market size and forecast 2025-2030 ($ million)
Chart on UAE - Year-over-year growth 2025-2030 (%)
Data Table on UAE - Year-over-year growth 2025-2030 (%)

12.6.3 South Africa - Market size and forecast 2025-2030

Chart on South Africa - Market size and forecast 2025-2030 ($ million)
Data Table on South Africa - Market size and forecast 2025-2030 ($ million)
Chart on South Africa - Year-over-year growth 2025-2030 (%)
Data Table on South Africa - Year-over-year growth 2025-2030 (%)

12.6.4 Israel - Market size and forecast 2025-2030

Chart on Israel - Market size and forecast 2025-2030 ($ million)
Data Table on Israel - Market size and forecast 2025-2030 ($ million)
Chart on Israel - Year-over-year growth 2025-2030 (%)
Data Table on Israel - Year-over-year growth 2025-2030 (%)

12.6.5 Turkey - Market size and forecast 2025-2030

Chart on Turkey - Market size and forecast 2025-2030 ($ million)
Data Table on Turkey - Market size and forecast 2025-2030 ($ million)
Chart on Turkey - Year-over-year growth 2025-2030 (%)
Data Table on Turkey - Year-over-year growth 2025-2030 (%)

12.7 South America - Market size and forecast 2025-2030

Chart on South America - Market size and forecast 2025-2030 ($ million)
Data Table on South America - Market size and forecast 2025-2030 ($ million)
Chart on South America - Year-over-year growth 2025-2030 (%)
Data Table on South America - Year-over-year growth 2025-2030 (%)
Chart on Regional Comparison - South America
Data Table on Regional Comparison - South America

12.7.1 Brazil - Market size and forecast 2025-2030

Chart on Brazil - Market size and forecast 2025-2030 ($ million)
Data Table on Brazil - Market size and forecast 2025-2030 ($ million)
Chart on Brazil - Year-over-year growth 2025-2030 (%)
Data Table on Brazil - Year-over-year growth 2025-2030 (%)

12.7.2 Argentina - Market size and forecast 2025-2030

Chart on Argentina - Market size and forecast 2025-2030 ($ million)
Data Table on Argentina - Market size and forecast 2025-2030 ($ million)
Chart on Argentina - Year-over-year growth 2025-2030 (%)
Data Table on Argentina - Year-over-year growth 2025-2030 (%)

12.7.3 Chile - Market size and forecast 2025-2030

Chart on Chile - Market size and forecast 2025-2030 ($ million)
Data Table on Chile - Market size and forecast 2025-2030 ($ million)
Chart on Chile - Year-over-year growth 2025-2030 (%)
Data Table on Chile - Year-over-year growth 2025-2030 (%)

12.8 Market opportunity by geography

Market opportunity by geography ($ million)
Data Tables on Market opportunity by geography ($ million)

13. Drivers, Challenges, and Opportunity

13.1 Market drivers

Escalating costs of modern agricultural machinery
Growth of digital rental platforms
Rise of sustainable agricultural mandates

13.2 Market challenges

High seasonal equipment demand constraints
Complex technological maintenance requirements
Fragmented market awareness barriers

13.3 Impact of drivers and challenges

Impact of drivers and challenges in 2025 and 2030

13.4 Market opportunities

Managing extreme weather disruption pressures
Accelerating specialized contract farming models
Expanding cross-border equipment sharing platforms

14. Competitive Landscape

14.1 Overview

14.2

Overview on criticality of inputs and factors of differentiation

14.3 Landscape disruption

Overview on factors of disruption

14.4 Industry risks

Impact of key risks on business

15. Competitive Analysis

15.1 Companies profiled

Companies covered

15.2 Company ranking index

15.3 Market positioning of companies

Matrix on companies position and classification

15.4 AGCO Corp.

AGCO Corp. - Overview
AGCO Corp. - Product / Service
AGCO Corp. - Key offerings
SWOT

15.5 Alamo Group Inc.

Alamo Group Inc. - Overview
Alamo Group Inc. - Business segments
Alamo Group Inc. - Key offerings
Alamo Group Inc. - Segment focus
SWOT

15.6 Boels Rental.

Boels Rental. - Overview
Boels Rental. - Product / Service
Boels Rental. - Key offerings
SWOT

15.7 Caterpillar Inc.

Caterpillar Inc. - Overview
Caterpillar Inc. - Business segments
Caterpillar Inc. - Key offerings
Caterpillar Inc. - Segment focus
SWOT

15.8 CLAAS KGaA

CLAAS KGaA - Overview
CLAAS KGaA - Product / Service
CLAAS KGaA - Key offerings
SWOT

15.9 CNH Industrial N.V.

CNH Industrial N.V. - Overview
CNH Industrial N.V. - Business segments
CNH Industrial N.V. - Key offerings
CNH Industrial N.V. - Segment focus
SWOT

15.10 Deere and Co.

Deere and Co. - Overview
Deere and Co. - Business segments
Deere and Co. - Key offerings
Deere and Co. - Segment focus
SWOT

15.11 Escorts Ltd.

Escorts Ltd. - Overview
Escorts Ltd. - Business segments
Escorts Ltd. - Key offerings
Escorts Ltd. - Segment focus
SWOT

15.12 Fendt

Fendt - Overview
Fendt - Product / Service
Fendt - Key offerings
SWOT

15.13 HERC HOLDINGS INC.

HERC HOLDINGS INC. - Overview
HERC HOLDINGS INC. - Product / Service
HERC HOLDINGS INC. - Key offerings
SWOT

15.14 Kubota Corp.

Kubota Corp. - Overview
Kubota Corp. - Business segments
Kubota Corp. - Key offerings
Kubota Corp. - Segment focus
SWOT

15.15 KUHN SAS

KUHN SAS - Overview
KUHN SAS - Product / Service
KUHN SAS - Key offerings
SWOT

15.16 Loxam Group

Loxam Group - Overview
Loxam Group - Business segments
Loxam Group - Key offerings
Loxam Group - Segment focus
SWOT

15.17 Mahindra and Mahindra Ltd.

Mahindra and Mahindra Ltd. - Overview
Mahindra and Mahindra Ltd. - Business segments
Mahindra and Mahindra Ltd. - Key offerings
Mahindra and Mahindra Ltd. - Segment focus
SWOT

15.18 United Rentals Inc.

United Rentals Inc. - Overview
United Rentals Inc. - Business segments
United Rentals Inc. - Key offerings
United Rentals Inc. - Segment focus
SWOT

16. Appendix

16.1 Scope of the report

Market definition
Objectives
Notes and caveats

16.2 Inclusions and exclusions checklist

Inclusions checklist
Exclusions checklist

16.3 Currency conversion rates for US$

16.4 Research methodology

16.5 Data procurement

Information sources

16.6 Data validation

16.7 Validation techniques employed for market sizing

16.8 Data synthesis

16.9 360 degree market analysis

16.10 List of abbreviations

Research Methodology

Technavio presents a detailed picture of the market by way of study, synthesis, and summation of data from multiple sources. The analysts have presented the various facets of the market with a particular focus on identifying the key industry influencers. The data thus presented is comprehensive, reliable, and the result of extensive research, both primary and secondary.

INFORMATION SOURCES

Primary sources

  • Manufacturers and suppliers
  • Channel partners
  • Industry experts
  • Strategic decision makers

Secondary sources

  • Industry journals and periodicals
  • Government data
  • Financial reports of key industry players
  • Historical data
  • Press releases

DATA ANALYSIS

Data Synthesis

  • Collation of data
  • Estimation of key figures
  • Analysis of derived insights

Data Validation

  • Triangulation with data models
  • Reference against proprietary databases
  • Corroboration with industry experts

REPORT WRITING

Qualitative

  • Market drivers
  • Market challenges
  • Market trends
  • Five forces analysis

Quantitative

  • Market size and forecast
  • Market segmentation
  • Geographical insights
  • Competitive landscape

Interested in this report?

Get your sample now to see our research methodology and insights!

Download Now

Frequently Asked Questions

Farm Equipment Rental market growth will increase by USD 15620.8 million during 2026-2030.

The Farm Equipment Rental market is expected to grow at a CAGR of 7.3% during 2026-2030.

Farm Equipment Rental market is segmented by Product (Tractors, Harvesters, Haying equipment, Others) Type (Manual equipment, Electric equipment, Autonomous equipment) End-user (Individual farmers, Farmer cooperatives, Agribusiness companies, Contract farming companies, Government and research institutions)

AGCO Corp., Alamo Group Inc., Boels Rental., Caterpillar Inc., CLAAS KGaA, CNH Industrial N.V., Deere and Co., Escorts Ltd., Fendt, HERC HOLDINGS INC., J C Bamford Excavators Ltd., Kiloutou, Kubota Corp., KUHN SAS, Loxam Group, Mahindra and Mahindra Ltd., Tractors and Farm Equipment Ltd., United Rentals Inc., Yanmar Holdings Co. Ltd., Zeppelin Rental GmbH are a few of the key vendors in the Farm Equipment Rental market.

APAC will register the highest growth rate of 47% among the other regions. Therefore, the Farm Equipment Rental market in APAC is expected to garner significant business opportunities for the vendors during the forecast period.

China, India, Japan, South Korea, Australia, Indonesia, Germany, UK, France, Italy, Spain, The Netherlands, US, Canada, Mexico, Saudi Arabia, UAE, South Africa, Israel, Turkey, Brazil, Argentina, Chile

  • Escalating costs of modern agricultural machinery is the driving factor this market.

The Farm Equipment Rental market vendors should focus on grabbing business opportunities from the Product segment as it accounted for the largest market share in the base year.
RIA - Research AI Assistant
Ask RIA
